Munich, 19-20 June 2018 Fear and Loathing on the Campaign Trail: Did Immigration Cause Brexit? - Max Viskanic
←
→
Page content transcription
If your browser does not render page correctly, please read the page content below
Munich, 19–20 June 2018

Fear and Loathing on the Campaign Trail:
Did Immigration Cause Brexit?
Max Viskanic
Fear and Loathing on the Campaign Trail:
                Did Immigration Cause Brexit?∗
                                        Max Viskanic†

                                      October 24, 2017

                                             Abstract
          Can immigration impact electoral outcomes and specifically, what impact did
      immigration have on the vote in favour of leaving the European Union (Brexit)
      in the UK? In particular, I focus on how the increase in Polish immigration, the
      major group of immigrants post 2004, affected votes in favour of leaving the EU. I
      find a percentage point increase in Polish immigration to the UK to have caused an
      increase in votes in favour of Brexit of about 2.72-3.12 percentage points, depending
      on the specification. To obtain exogenous variation in Polish immigration, I use a
      novel instrumental variables approach that relies on the fact that after WW2 Polish
      army officers fighting in the Royal Air Force were quasi randomly allocated to War
      Resettlement Camps all across the UK. Discussing potential mechanisms, I examine
      public opinion data in the British Election Study 2015 and find evidence of adversity
      towards immigration to be a root cause. Other considerations such as the National
      Health Service (NHS), incumbency and the general trust in politicians as well as
      the political institutions seem not to play a role.

Keywords: Political Economy; Voting; Migration; Brexit; EU; UK
JEL Classifications: C36, D72, J15, N44, R21, R23

  ∗
      Acknowledgements: I would like to thank Emeric Henry for the supervison and guidance of this
project. This paper has greatly benefitted from discussions with Nicolo Dalvit, Quoc-Anh Do, Roberto
Galbiati, Sergei Guriev, Erik Lindqvist, Andreas Madestam, Helene Maghin, Vadim Marmer, Julien
Pascal, Erik Prawitz, Andrew Proctor, Laurence Vardaxoglou and Paul Vertier as well as seminar par-
ticipants at the SDPE PhD Workshop, MicroWave, SITE as well as the ASWEDE meetings. I thank
Robert Honeyman for the proofread.
    †
      Department of Economics and LIEPP, Sciences Po Paris, max.viskanic@sciencespo.fr

                                                 1
1       Introduction
On the 23rd of June 2016 the United Kingdom (UK) decided by referendum to exit the
European Union (EU). A major topic in the debate prior to the referendum was the impact
of increased immigration to the UK in recent years, especially from Eastern and Central
European countries many of which joined the EU in 2004. Proponents of the “Leave.EU”
campaign, used the slogan “Take back control” and thus taking control of the flow of
immigration to the UK. The UK’s membership of the EU meant that the free movement
of people in Europe was non-negotiable. Exiting the EU however would allow the UK
to independently determine its immigration policy. Throughout the campaign there was
increased scrutiny of migrant communities, especially the Polish community.1 After the
vote to leave the EU prevailed, the new British prime minister Theresa May asserted that
immigration will be at the heart of the Brexit deal to be negotiated (Guardian, 2016).
    In this paper I show that a percentage point increase in Polish immigration post 2004
led to a statistically significant increase in votes in favour of Brexit of 2.72-3.12 percentage
points, depending on the specification. I find a discernible effect of immigration on shaping
political preferences of the native population. Overall, for every percentage point of Polish
immigration, there is a 5 percentage point increase in people mentioning immigration to
be the most important issue that politicians in Britain face today as answered in the first
open ended question in the British Election Study 2015. I cannot find evidence that other
competing reasons such as incumbency, general trust in politicians or investment in the
NHS had any effects on the Brexit vote. On the other hand there is evidence that the
vote on Brexit was not a protest vote and Local Authorities (LAs) with increased Polish
immigration actually have a higher trust in British politicians in general. Those results
are indicative that immigration played a root cause in the Brexit vote.
    In order to estimate the causal impact of immigration I rely on an instrumental vari-
able analysis. After World War 2 Polish army officers fighting in the Royal Air Force were
allowed to move with their families to the UK. The government then quasi-randomly
assigned them to War Resettlement Camps, where they built their initial Polish commu-
nities and remained in the UK thereafter (Biegus and Biegus, 2013). Following the idea
first pioneered by (Card, 2001) that new migrants allocate close to established immigrant
networks, Polish immigrants post 2004 would allocate close to where their ancestors did
just after WW2.
    This paper closely related to two concurrent papers by (Becker and Fetzer, 2016) and
(Becker et al., 2016).2 The first examines the impact of EU enlargement in 2004 and
    1
    See amongst others: (Express, 2016), (BBC, 2016) or (Vox, 2016).
    2
    Other papers that aim at understanding the causes of Brexit are (Arnorsson and Zoega, 2016) and
(Goodwin and Heath, 2016).

                                                2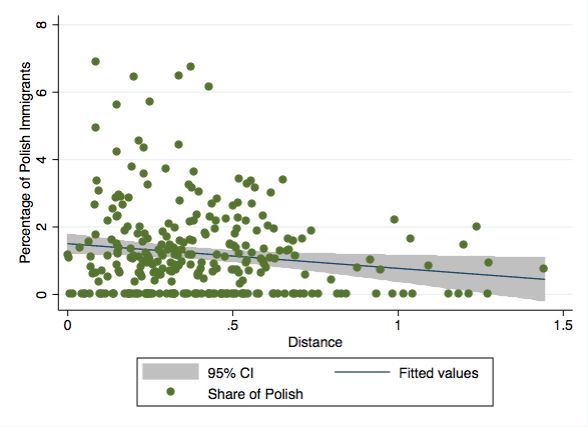
subsequent immigration to the UK on voting outcomes using a Difference-in-Difference
estimation strategy. The second paper tries to identify the leading determinants of the
Brexit vote outcome. I add to these discussions by providing an identification strategy to
estimate the causal impact of immigration on the Brexit vote outcome.
   This paper relates to the literature on the impact of immigration on voting outcomes,
where the most recent publication is by (Barone et al., 2016). In this paper the authors
causally estimate the impact of immigration on three national elections using the prior
allocation of immigrants before 1992 as an instrumental variable. The exclusion restriction
being that a political scandal (“Mani Pulite”) led to the creation of completely new parties
in 1993. In (Halla et al., forthcoming), the authors study the impact of immigration on
voting in favour of the extreme right in the 1980s to 1990s. To obtain exogenous variation
in the allocation of immigrants they use the prior settlement patterns of immigrants in
the 1960s. (Harmon, forthcoming) determines the impact of immigration to Denmark
to have had a positive impact on votes in favour of anti-immigrants nationalist parties.
His instrumental variables strategy uses the historical housing stock to address issues
of endogeneity. (Otto and Steinhardt, 2014) study local elections in Hamburg under
periods of high immigration to determine that in right wing xenophobic parties gained
considerably. On the other hand (Mendez and Cutillas, 2014) show that the rise of
Latin American immigrants led to an increase in votes for the major Left wing party,
but an increased immigration from Africa led to more votes for the major right wing
party. (Brunner and Kuhn, 2014) is the only paper that considers referendum outcomes.
They determine the impact of cultural distance of immigrants to the native population
on referenda about immigration. They instrument for the share of immigrants in the
municipality by using local labour market conditions. Two recent attempts at estimating
the electoral impact of the relatively recent refugee crisis in Europe on electoral outcomes
are carried out by (Steinmayr, 2016) and (Vertier and Viskanic, 2017). Both find negative
effects of refugees on Far Right Nationalist parties in Austria and France respectively. The
instruments used are very similar, (Steinmayr, 2016) uses group housing to instrument for
the allocation of refugees, whereas (Vertier and Viskanic, 2017) use holiday villages all over
France. A relatively new avenue of research considers the impact of rising trade exposure
on electoral outcomes. (Autor et al., 2016) show that increased Chinese competition
has led citizens to elect more extreme house representatives by examining congressman’s
voting records. (Dippel et al., 2015) and (Malgouyres, 2017) examine the impact of rising
trade exposure directly on election outcomes and find a positive effect on extreme right
wing parties in Germany and France respectively.3 Other studies in political science such
   3
    In a Vox column (O’Rourke, 2016) makes the case for historical impacts of Globalisation to have
been a major factor in the Brexit vote outcome.

                                                3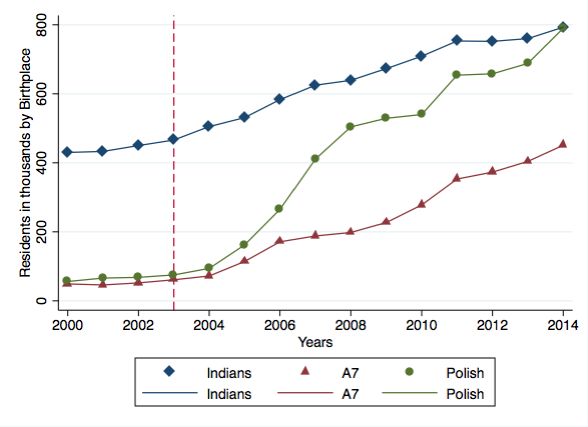
as (Clarke et al., 2016) or (Arzheimer, 2009) have shown that anti-immigrant sentiment
can give rise to votes in favour of extreme right wing parties.4,5
    Many papers have also analysed the impact of immigration to the UK, especially on the
labour market.6 (Dustmann et al., 2014) use data from the British Labour Force survey to
estimate the impact of immigration in both a theoretical and empirical fashion. They find
the skillset of immigrants to be very similar to the one of natives and no strong effects on
aggregate employment, participation, unemployment and wages. Specifically (Manacorda
et al., 2011) find that the mild effects of immigration on the UK labour market are due to
the imperfect substitutability between natives and immigrants. Related to this, (Gilpin
et al., 2006) use the 2004 accession wave of immigration and find no discernible evidence
on unemployment claims. The authors paint a picture of a flexible UK labour market
that has seen a modest, but broadly positive impact of immigration on the economy.
(Nickell and Saleheen, 2015) analyse the specific occupational impact of immigration,
they find small negative effects on wages but a strong impact of immigration on wages in
the semi-skilled/unskilled occupational group.
    My paper thus contributes in two ways to the literature:
    It is one of the first papers examining the determinants of the Brexit vote outcome as
well as the impact of immigration on referendum vote outcomes in general.
    Secondly the paper offers a new instrumental variables approach that relies on archive
data from the book (Biegus and Biegus, 2013), which reveals the exact location of Polish
resettlement camps after WW2. It is an instrument that relies on the basic intuition
pioneered by (Card, 2001) i.e. that new immigrants partially allocated where prior im-
migrants did. I extend this instrument to a historical and spatial setting. This approach
will be explained in full detail below.
    The next section outlines the historical context, Section 3 formulates the empirical and
identification strategy, Section 4 provides the main empirical results, Section 5 presents
some robustness checks and a falsification exercise (5.2) and Section 6 concludes.

2       Historical Context
The largest group of Non-British troops that fought in the Royal Air Force during World
War 2 were born in Poland. Also, occupied Poland’s exiled government was located in
London. As a result of the service of the Polish people in the British army, Churchill
    4
      (Whitaker and Lynch, 2011) study specifically the rise of UKIP in Britain.
    5
      A review on the Economic determinants of Electoral outcomes is compiled by (Lewis-Beck and
Stegmaier, 2015)
    6
      (Wadsworth, 2015) provides a comprehensive review on the general impact of immigration on the
UK Labour market

                                                4
told parliament in 1945: “His Majesty’s government will never forget the debt we owe to
the Polish troops. I earnestly hope it will be possible for them to have citizenship and
freedom of the British empire, if they so desire.” (Pittsburgh-Post-Gazette, Mar 2, 1945).
The legislative consequence of this was the Polish Resettlement Act of 1947. This
allowed Polish troops and their families to move to the UK after WW2 and find initial
shelter in one of the War Resettlement Camps located across the country. This assignment
appears quasi-random and was partially based on the location of newly created housing,
the further usage of old military bases and hospitals as well as the donation of housing
and land by British citizens (Biegus and Biegus, 2013). The size of those camps is unfor-
tunately not directly determinable as the documentation provided on those settlements
is scarce and official records of inhabitants were not taken. I will try to demonstrate that
this initial allocation of immigrants can be seen as exogenous to political outcomes in the
21st century. After initial permanence in the War Resettlement Camps, Polish soldiers
and their family integrated into the local communities (Biegus and Biegus, 2013).
At the same time, all regressions presented below include extensive post- and pre-
accession controls i.e. the logarithm of Unemployment rates per LA in 2004 and 2014,
the logarithm of Gross Value added (GVA) in 2014 and 2004 for the NUTS1, NUTS2,
NUTS3 region, Latitude and Longitude as well as the logarithm of Population in 2014.
In the robustness check I also include further controls related to the shares of natives. It
is also important to mention that new LAs were defined and merged as a result of the
Local Government Act of 1972. Therefore the allocation in 1947 cannot be related to any
historical political force that prevails in those communities now. This complete redrawing
of LAs brakes any potential political persistence that prevailed in those communities. In
Section 5 I provide graphical evidence for the large scale redrawing of LAs as well as
a randomisation exercise (Section 5.2) showing that the instrumented coefficient is not
significant on political outcomes after the redrawing in 1973 as well as that the Distance
to the closest War Resettlement Camp (my instrument) is also unrelated to political
outcomes in 1973. The 1951 census counted 162,399 people born in Poland in the UK.
After the EU-Accession of Poland in 2004, the number of Polish born immigrants in the
UK increased rapidly, as can be seen in Figure 1 and Figure 2. In Figure 1 we can clearly
see that Polish born residents have now overtaken Indian born residents as the largest
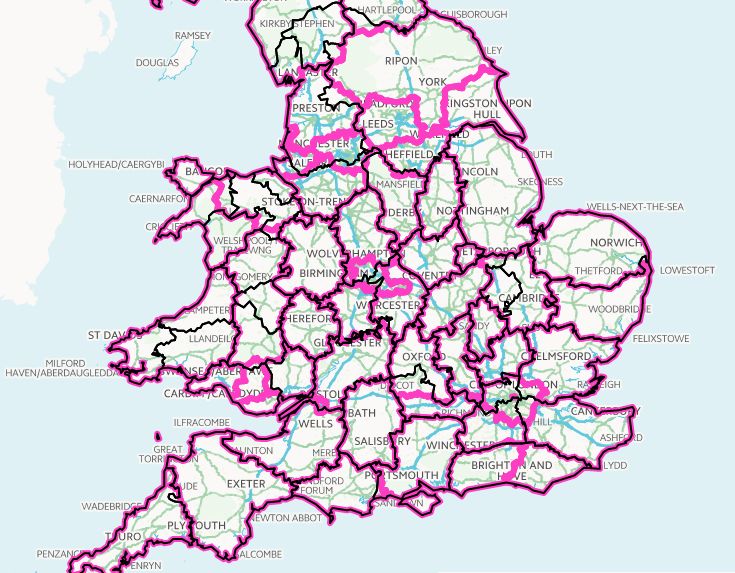
immigrant group. In Figure 2, one can see how relatively little immigrants from other
A8 countries7 migrated to the UK, yielding initial evidence of the “special” relationship
between the UK and Poland. As we can see pre-accession levels of Polish born residents
are under 100 000 and probably represent ancestors allocated in the United Kingdom
7
Accession 8 countries are all the Eastern and Central European countries that joined the EU in
2004: Czech Republic, Estonia, Hungary, Latvia, Lithuania, Poland, Slovakia and Slovenia.
5since World War II as migrating to the UK before 2004 was very difficult.
In 2016, the number of Polish born residents reached about 1 million, which at the
time of writing makes it now the largest group of immigrants in the UK. This is implied
by “overtaking India”.
[Figure 1 about here]
[Figure 2 about here]
3 Empirical Specification and Identification
In this paper I will estimate the causal impact of Polish immigration post 2004 on the
Brexit vote and turnout outcomes in each LA with the following equation:
P olishi
Y i = β0 + β1 + βk Ωi + i (1)
P opulationi
P olishi
In this case P opulationi
will be the amount of people born in Poland that live in a certain
LA over the total population in that LA expressed in percentage points.8 Ωi are both
current and past economic, social as well as geographic controls i.e. the natural logarithm
of Gross Value Added in 2004 and 2014 at the NUTS1, NUTS2 and NUTS3 level as well
as Unemployment in 2004 and 2014 per LA together with Latitude and Longitude and
the natural logarithm of Population in 2014. Yi is either turnout or the share of votes in
favour of leaving the EU (Leave) in percentage points.
For reasons of geographic selection β1 might be biased. New Polish Immigrants might
allocate to certain LAs because of some observable or unobservable characteristics that
8
In general, the best approach would be to subtract the Polish residents in 2003 to the residents
present in 2014 and divide those by population in order to obtain the share of immigrants between 2003
and 2014. The problem with this approach is that for many LAs the share of Polish residents is not
defined in 2003. I thus use the stocks of Polish born residents in 2014 to have as many observations as
possible. Using the Census in 2001 would lead to inconsistent data sources and since it was conducted in
2001 it would also be measuring Polish residents 2-3 years too early. Examining Figure 1 we can see that
this will not be problematic, given the low number of immigrants in 2003, which as mentioned before
will probably be the people that moved to the UK because of the Polish Resettlement Act in 1947, the
ancestors where new immigrants will partially allocate.
6could be correlated with political outcomes in that place. For this reason I propose to
use the Distance to the closest War Resettlement Camp as an instrument for the share
of Polish immigrants. The idea being that new Polish Immigrants, approximated by
the shares of foreign-born Polish people in 2014, will partially allocate close to where
their ancestors after WW2 did. The ones that allocated closer to the War Resettlement
Camps will allocate there because of ties to the ancestors. The further away the Polish
immigrants allocate from those War Resettlement Camps, the less likely it is that they
allocated there because of reasons of ancestry, but rather because of other factors such
as for example better employment opportunities. This instrumental variables approach
claims that, controlling for aforementioned controls, the Distance to the War Resettlement
Camps can lead to filtering out the exogenous component in Polish immigrant allocation
in order to measure its impact on Political outcomes. The underlying assumption, i.e.
the exclusion restriction, that the distance to the War Resettlement Camps is per se
unrelated to Political outcomes, which is corroborated by the vast redrawing of LAs in
1972 together with the randomisation exercises carried out on the local elections in 1973
(5.2). As mentioned the first stage regression includes the same controls as the second
stage regression i.e. NUTS1, NUTS2, NUTS3 Gross Valued Added and Unemployment
both pre- and post accession (2004 and 2014) together with Latitude and Longitude and
the logarithm of Population in 2014.9
The first stage in the 2 Stage-Least-Squares regression can thus be written as:
P olishi
= γ0 + γ1 Distancei + βk Ωi + εi (2)
P opulationi
Where Distancei is the distance to the closest War Resettlement Camp. The controls
are the same as in the main specification. Given the aforementioned reasons I expect
γ1 to be negative and highly significant, given that new immigrants should partially sort
towards prior established immigrant networks. I fit both a linear first stage (as specified)
as well as one using Distancei , Distance2i and Distance3i as instruments.10 The reason
being the shape of the data shown in Figure 4.
4 Empirical Results
In the following sections I present the data description, summary statistics, the main re-
sults as well as the main mechanism for the findings. In section 5 I will provide Robustness
9
Some scholars (notably (Davies, 2016)) have shown that the Leave Vote was especially strong in
places, where historically Labour was stronger. With the randomisation exercises in 5.2. on elections in
1973, I disprove this claim in this setting.
10
Higher powers of Distancei than n = 3, do not increase the fit.
7checks and randomisation exercises (5.2).
4.1 Data Description and Summary Statistics
Using the Office for National Statistics (ONS)11 micro dataset I am able to obtain data
on population by country of birth as well as many socio-economic variables i.e. Unem-
ployment, Gross Value Added (at the NUTS1, NUTS2 and NUTS3 level) both post- and
pre-accession per LA in the United Kingdom, which I also include as controls in all the
regression. The earliest complete data for every LA in England and Wales is from 2004,
whereas the most recent available is for 2014.12
From the national archives and newly digitised data of the book “Polish resettlement
camps in the UK and Wales 1946-1969” (2013) I have collected the location and address of
the camps, where former polish soldiers were allocated after WW2. In order to calculate
the distance from the LA to the War Resettlement Camp I use the location of the main
council building.
The public opinion data is retrieved from the British Election study in 2015 collected
by (Fieldhouse et al., 2016). This is a survey on political attitudes carried out on a
representative part of the British electorate. Here I recode certain variables and aggregate
them to the NUTS2 level and assign them to the LAs in question (further details below).
Table 1 refers to the 287 LAs for which detailed migration data is available.13 For
all others in the sample only data on the amount of British-born residents and total
population were available.
We can see that the size of LAs is fairly heterogenous. General economic indicators
improved from 2004 to 2014 and unemployment also increased during that time. The
share of Polish people averages at 1.21%, and the share of British people at 88.03% with
also strong heterogeneity across LAs. Turnout is comparatively high and the share of votes
in favour of leaving the EU is high at over 54% in the sample. Latitude and longitude are
my two included geographical controls, which pinpoint the main council building.14
11
www.ons.co.uk
12
Except for the variable on Polish born residents, which are still missing at some Local Authorities
even in 2014.
13
Given some data constraints in terms of birthplace and economic/social controls, the used sample
includes only LAs in England and Wales.
14
In the whole discussion so far, there is no political variable used as control. The most relevant seem
potentially the outcomes for European elections. I will explain why including them makes little sense
here. In (Becker et al., 2016) the authors show that the UKIP vote outcomes of the European Elections
in 2014 are very good predictors of the Brexit Vote in 2016. This is consistent with the estimation here.
The fact is that in this setting using the outcome of European elections in 2014 as a control, would be
committing a fallacy known as “bad control” (Angrist and Pischke, 2009). The UKIP vote outcome in
2014 is probably caused by the very same immigration taking place post-2004 (consistent with (Becker
and Fetzer, 2016)). As a result any political outcome post-2004 can be seen as an outcome variable and
generally be influenced by immigration. Before 2004, there are no strong right wing parties that could
8[Table 1 about here]
4.2 The First Stage
Figure 3 provides some initial graphical evidence for a quasi-random location of the War
Resettlement camps in 1947. The locations are spread all over England and Wales, but
not in an evidently deterministic way. Later in the paper I will show that this initial
allocation is not related to any political outcomes as well as that the first stage does not
significantly differ if controls are included or not.
Figure 4 shows a clear negative pattern, whereby the shorter the distance to the closest
War Resettlement Camp, the higher the concentration of Polish born immigrants in the
LA. Given the shape of the plot I will use two different specifications in the first stage. One
specification will be the linear distance. Given some graphical evidence of non-linearity
I also fit a model with the square and the cube of the distance15 to the closest War
Resettlement Camp. In the end, the effects of both instruments are very similar.
Fitting the first stage in the linear case, gives a parameter estimate that is negative
and highly significant. The parameter size is -1.15 with standard error of 0.30 (Table 2).
Parameter estimates do not significantly differ with or without controls. An F-Test for
the excluded instrument with controls is 14.7, which puts me in a relatively safe zone for
inference. Nevertheless, I will also provide Conditional Likelihood Ratios (CLRs) that are
valid even under weak instruments.
[Figure 3 about here]
[Figure 4 about here]
predict the Brexit vote outcome.
15
I.e. with Distancei and Distance2i and Distance3i as the three instruments.
94.3 Main Results
Table 2 contains cross-sectional evidence of the correlation of Polish immigrants with
turnout and outcomes on votes in favour of Brexit. Polish immigrants sort significantly,
but not largely, towards areas, where less people voted but those that did, voted more in
favour of Brexit (Column 3 and 6). A reason for this could be that new Polish migrants
often immigrate without many financial resources (Okolski and Salt, 2014) and might
therefore allocate to places that are relatively less well-off.16 Using the linear instrument,
we can see that a one percentage point increase in Polish immigrants has causally lead
to an increase in votes in favour of Brexit of about 2.72 percentage points (Column 4).
Using the non-linear first stage, I find the effect of an increase in one percentage point of
Polish immigrants to increase votes in favour of Brexit by about 3.12 percentage points
(Column 5) and in this case the CLR also excludes 0. We can also see that there is a
negative non significant impact of immigration on voter turnout.
Performing a back of the envelope calculation I try to determine whether the 3.12%
swing in votes caused by Polish immigration could have reversed the Brexit vote outcome.
This is an approximate calculation and should thus not be taken as hard evidence. In
my dataset, I find that 199 LAs have a positive share of Polish born residents and those
LAs have an average size of about 202,00017 . Taking into account a 3.12% swing, average
Turnout at 73.77% and an adult population share of around 75% (Office for National
Statistics, 2016), we have the following potential swing vote:
3.12% × (199 × 202, 000) × 73.77% × 75% ≈ 693905
693 905 is about two thirds of the actual difference between Brexit and Remain votes
of 1 Million. Therefore we can see that Polish immigration could have not accounted for
the total swing in Brexit votes. At the same time it is important to keep in mind that
those calculations are very stylised.
[Table 2 about here]
16
This is corroborated by the fact that most of the economic controls are negatively correlated with
the vote in favour of Leave and positively with turnout.
17
The exact number is 201,945.
104.4 Mechanism: Examining Public Opinion Data
One major mechanism through which immigration can shape electoral outcomes is through
affecting political preferences. A good way to proxy this is to rely on public opinion
surveys. In the following part I recode parts of the British election study 2015 collected
by (Fieldhouse et al., 2016) and use them as outcome variables aggregated to the NUTS2
level to measure the impact of Polish immigration on political opinion.
I replace the Leave and Turnout outcomes with variables regarding immigration, the
case of a protest vote, trust in in British politicians, naming the Secretary General of
the UN correctly, raising or lowering spending on the NHS, people’s attitude towards the
future and towards democracy. The detailed description and recoding of those variables
can be found in the appendix.
Overall we can clearly see that for a percentage point increase in Polish immigrants
there is a 5 percentage point increase of people mentioning immigration as the main
problem facing Britain today. Therefore areas where more Polish people exogenously
allocated, there is an increase in immigration resentment. This corroborates the evidence
that Polish immigration had some effect on shaping electoral preferences of the native
population. This is shown in Column 1 in both Table 3 and 4 and the effect is more
pronounced with the non-linear first stage. Together with this also subjects in the survey
described their last vote not to be a protest vote (Column 2). On average people also
have slightly higher trust in politicians and about three percentage points of people are on
average better at naming the Secretary general of the UN (per percentage point increase
in Polish immigration) as can be seen in columns (3) and (4). There is no significant
difference in public opinion on the NHS, nor on considerations of the future or about how
satisfied individuals are about democracy (Columns (5), (6) and (7)). Tables 4 includes
the results for the non-linear first stage. What one can draw from this empirical evidence
is the fact that LAs affected by higher Polish immigration, see immigration as the main
issue facing British society. At the same time, they do not seem to be affected by their
future hopes, their belief in democracy and their views on other social issues such as the
NHS. On the other hand people seem more aware politically speaking i.e. they did not
cast a protest vote, trust their politicians to a greater extent and they are on average more
able to name the secretary General of the United Nations. This evidence suggests that
the increased vote in favour of Leaving the European Union is actually due to additional
concern for immigration brought through Polish immigration.
[Table 3 about here]
11[Table 4 about here]
5 Robustness
In this section I offer a battery of robustness checks and a falsification exercise (5.2).
Section 5.1. deals with the possibility that I might be picking up effects of many groups
of immigrants and not necessarily the one of Polish immigrants. The next subsection looks
at whether the initial allocation of Polish War Resettlement camps is related to historical
political outcomes and thus checks if I am not picking up a pre-eminent political trend. I
also show the redrawing of LAs that brakes any pre-eminent trend in political preferences.
5.1 Other Immigrant Groups
In order to show that the War Resettlement Camps uniquely predict the share of Polish
people, I run the first stage using as a dependent variable the share of immigrants of all
countries except for Poland in Table 5. The importance of this exercises is to show that
the impact is of only Polish immigration and not corroborated with any other share of
immigrants and that the instrument, as explained before, is specific to Polish immigration.
We can observe that the distance to the closest War Resettlement Camp does not reliably
predict the share of immigrants of other countries. This evidence strongly corroborates
the validity of the instrument.
[Table 5 about here]
Additionally, I perform a Robustness check that deals with the possibility that election
outcomes might be caused by other immigrant groups and not specifically by the impact
of Polish immigration. Given data limitations, specifically on the number of non-polish
immigrants, I carry out Robustness checks taking the number of British born people as
reference. Taking into account other specific immigration groups such as for example other
A8 accession countries or Indian residents creates too much attrition in observations.18
18
Per se, data on other immigrant groups is as readily available as for Polish residents, but this is
very heterogenous across LAs. Having information on many immigrant groups simultaneously for one
LA causes the attrition of observations.
12The first exercise is to run the main specification controlling for the logarithm of the
share of British people. In Table 6 we can see those results. The effects on Turnout still
remain non-significant and the impact on Brexit vote is very similar to our main result.
Additionally, I carry out another analysis by constructing an instrument based on
(Card, 2001) for the share of British people. I take the latest share of pre-Accession
British natives available (2000) to instrument for the share of British people in the year
2014 and use this as an additional regressor in the main specification. In Table 7 we
can see that the results are more pronounced, but of similar magnitude. They remain
significant on the Leave vote and not significant on Turnout.
[Table 6 about here]
[Table 7 about here]
5.2 Predicting Outcomes in the local election of 1973
I would be picking up a pre-eminent political trend if the distance to the closest War
Resettlement Camps were related to political outcomes in the past. For example if the War
Resettlement Caps were located in certain areas because of some political considerations.
We already know that about 20 years after Polish people were allocated to the War
Resettlement Camps all LAs were re-drawn and this would theoretically brake this initial
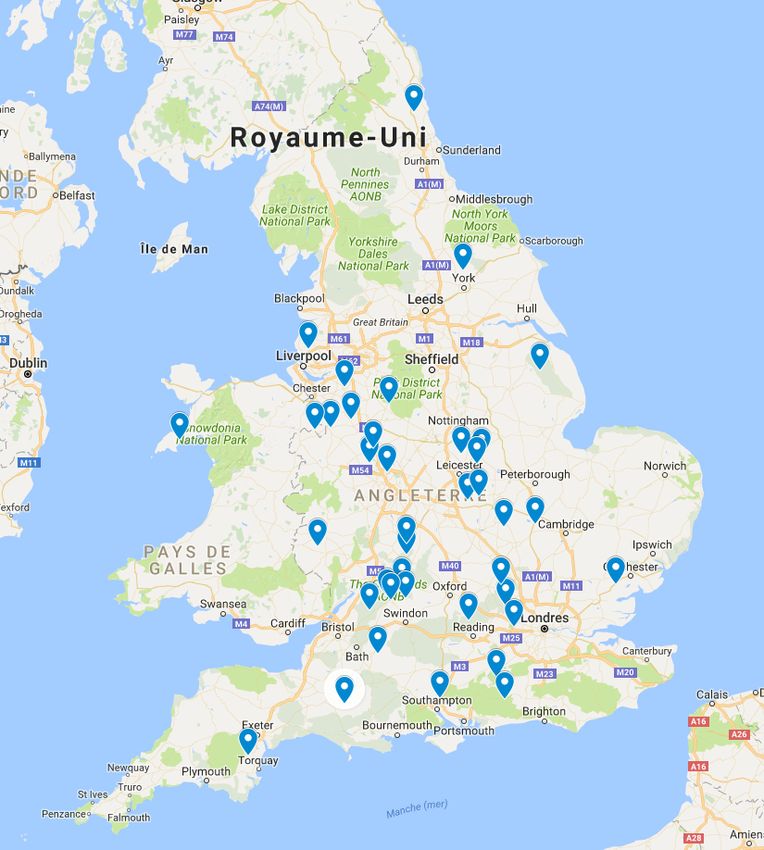
political persistence if it existed. Figure 5 provides evidence of vast redrawing of LAs.
On the other hand, the re-drawing of those LAs might have been deterministic. In the
following regression I take as an outcome variable the Difference between Conservative
and Labour votes (The only two major parties standing for election in 1973) to show that
the instrument is unrelated to political competition in 1973. In Table 8 we can see that
the 2SLS coefficient is not significant on the difference between votes for Conservative
and Labour candidates in 1973 local election and also the plain OLS regression of the
Distance to the closest War Resettlement Camp yields a very imprecise point estimate.19
Therefore the redrawing of districts has not been deterministic and thus the validity of
19
I use the outcome in local elections as they are aggregated at the LA level. Parliamentary election
results are aggregated at the electoral constituency level.
13my instrument is unaffected.20 The first column is the OLS regression and columns (2)
and (3) use the linear first stage and the non-linear first stage respectively.
[Figure 5 about here]
[Table 8 about here]
5.2.1 Outmigration
Immigration can have effects on the composition of the voting population across areas.
In this section I test whether the immigration of Polish people has possibly led to the
outmigration of natives. It could be that Polish immigration displaced native voters,
which in turn could affect voting outcomes if natives do not have representative political
opinions. In Table 9 one can see the result of regressing the instrumented share of Polish
P opulation2014 −P opulation2004
people on the share of Net Outmigrants defined by P opulation2014
. Using both
the linear and the non-linear first stage we can see that the effect is very small and highly
inaccurate. Therefore there is no evidence that Polish immigration had effects on the
composition of the voting population in LAs.
[Table 9 about here]
6 Conclusion
In this paper I have shown that Polish immigration has causally increased the Brexit vote
by 2.72-3.12 percentage points depending on the specification. On the other hand there
is no impact on turnout. The variation in Brexit votes is not sufficient to account for the
total swing votes needed to reverse the result in favour of remaining in the EU.
20
Some observations are missing, given that subsequent Government Acts do not allow to match all
LAs in 2014 with LAs in 1973.
14The main mechanism that can be attributed to those findings is an increase in re-
sentment towards immigrants. I find no evidence on other potential explanations such
as distrust in the political system, voting against incumbency or politicians or a general
protest vote and neither on other policy issues such as the NHS.
I provide one of the first papers on the determinants of Brexit together with a novel
instrumental variables approach to measure the impact of Polish immigration. I trace
back War Resettlement Camps after WW2 and instrument for the size of EU-accession
Polish immigration post 2004. Together with this, I offer many robustness checks that
point towards the electoral effects caused by Polish immigration and the change in native’s
political preferences.
15References
J. Angrist and S. Pischke. Mostly Harmless Econometrics: An Empiricist’s Companion.
Princeton University Press, 2009.
A. Arnorsson and G. Zoega. On the causes of brexit. CESifo Working Paper 6056, 2016.
K. Arzheimer. Contextual factors and the extreme right vote in western europe, 1980-
2002. American Journal of Political Science, 53(2):259?275, 2009.
D. Autor, D. Dorn, G. Hanson, and K. Majlesi. Importing political polarisation? the
electoral consequences of rising trade exposure. Human Development Research Paper,
UNDP Washington, 2016.
G. Barone, A. D’Ignazio, G. de Blasio, and P. Naticchioni. Mr. rossi, mr. hu and politics.
the role of immigration in shaping natives’ voting behavior. Journal of Public Economics
136, pages 1–13, 2016.
BBC. Discussion with polish people about post-brexit possibilities. 2016.
S. Becker and T. Fetzer. Does migration cause extreme voting? Working Paper, 2016.
S. Becker, T. Fetzer, and D. Novy. Who voted for brexit? a comprehensive district-level
analysis. Working Paper, 2016.
Z. Biegus and J. Biegus. Polish resettlement camps in england and wales 1946-1969. PB
Software, 2013.
B. Brunner and A. Kuhn. Immigration, cultural distance and natives’ attitudes towards
immigrants: Evidence from swiss voting results. Working Paper, 2014.
D. Card. Immigrant inflows, native outflows and the local labor market impacts of higher
immigration. Journal of Labor Economics, 19, 2001.
H. Clarke, P. Whiteley, W. Borges, D. Sanders, and M. Stewart. Modelling the dynamics
of support for a right-wing populist party: the case of ukip. Journal of Elections, Public
Opinion and Parties, 2016.
W. Davies. Thoughts on the sociology of brexit. Web Entry, 2016.
C. Dippel, R. Gold, and S. Heblich. Globalisation and its (dis-)content: Trade shocks and
voting behaviour. Working Paper, 2015.
16C. Dustmann, F. Fabbri, and I. Preston. The impact of immigration on the british labour
market. The Economic Journal, 2014.
The Express. “no more polish vermin?”: Racist flyers posted in homes of eastern euro-
peans after brexit by dave burnham. 2016.
E. Fieldhouse, J. Green, G. Evans, H. Schmitt, C. van der Eijk, J. Mellon, and C. Prosser.
British election study, 2015: Face-to-face post-election survey. UK Data Service, pages
SN: 7972, http://doi.org/10.5255/UKDA–SN–7972–1, 2016.
N. Gilpin, M. Henty, S. Lemos, J. Portes, and C. Bullen. The impact of free movement
of workers from central and eastern europe on the uk labour market. Working Paper,
2006.
M.J. Goodwin and O. Heath. The 2016 referendum, brexit and the left behind: An
aggregate-level analysis of the result. The Political Quarterly, 3, 2016.
The Guardian. May: “immigration will be at the heart of the brexit deal”. 2016.
M. Halla, A. Wagner, and J. Zweimueller. Immigration and voting for the extreme right.
Journal of the European Economics Association, forthcoming.
N. Harmon. Immigration, ethnic diversity and political outcomes: evidence from denmark.
Scandinavian Journal of Economics, forthcoming.
M. Lewis-Beck and M. Stegmaier. Economic determinants of electoral outcomes. Annual
Review of Political Science, 3:183–219, 2015.
C. Malgouyres. Trade shocks and far-right voting: Evidence from french presidential
elections. Working Paper, 2017.
M. Manacorda, A. Manning, and J. Wadsworth. The impact of immigration on the struc-
ture of wages: theory and evidence from britain. Journal of the European Economics
Association, 2011.
I. Mendez and I.M. Cutillas. Has immigration affected spanish presidential elections
results? Journal of Population Economics, 27, pages 135–171, 2014.
S. Nickell and J. Saleheen. The impact of immigration on occupational wages: evidence
from britain. Working paper, 2015.
Office for National Statistics. 2011 census aggregate data. UK Data Service, 2016.
17M. Okolski and J. Salt. Polish migration to the uk after 2004; why did so many come?
Central and Eastern European Migration Review, pages 1–27, 2014.
K. O’Rourke. Brexit: This backlash has been a long time coming. Vox.EU column, 2016.
A. H. Otto and M. F. Steinhardt. Immigration and election outcomes ? evidence from
city districts in hamburg. Regional Science and Urban Economics, pages 67–79, 2014.
Pittsburgh-Post-Gazette. Mar 2, 1945.
A. Steinmayr. Exposure to refugees and voting for the far-right. (unexpected) results
from austria. Working Paper, 2016.
P. Vertier and M. Viskanic. Dismantling the “jungle”: Refugee relocation and extreme
voting in france. Working paper, 2017.
Vox. Brexit isn’t about economics. it is about xenofobia. by zack beauchamp. 2016.
J. Wadsworth. Immigration and the uk labour market. Working paper, 2015.
R. Whitaker and P. Lynch. Explaining support for the uk independence party at the 2009
european parliament elections. Working paper, 2011.
18Appendix
Detailed coding of the public opinion questions.
• (1) Issue-Immigration: What is the most important issue facing Britain today?
This is an open-ended question asked in the survey. I look at every single of the
about 3000 observations and if it is related to immigration I code a 1.21 Otherwise
I code a 0.
• (2) Protest-Vote Was your vote a protest vote? If the response is yes I coded a
1, otherwise 0.
• (3) Trust-Politicians How much do you trust British politicians generally? 0 is
equivalent to no trust and 10 is equivalent to trusting them a lot. The few times
where the information is missing I recode it as a 5.
• (4) UN-SG Who is the secretary general of the United Nations (UN)? 1 if Ban
Ki Moon (The Secretary General of the UN at that time) is identified correctly, 0 if
any other name is guessed or no information is provided. I include this question in
the survey in order to check whether LAs affected by Polish immigration could be
less aware of current political developments and thus in some sense deprived.
• (5) NHS-Investment What is your view about putting money in the National
Health Service (NHS)? Very important that it should be done is coded as 1, fairly
important is coded as 2, it does not matter and “don’t know” is coded as 3, fairly
important that it should not be done is coded as 4 and very important that it should
not be done is coded as 5.
• (6) Future-Optimism Over the next ten years, how likely or unlikely is it that
you will improve your standard of living? Very likely is coded as 1, somewhat likely
is coded as 2, “don’t know” is coded as 2.5, somewhat unlikely is coded as 3 and
very unlikely is coded as 4.
21
I am very restrictive with coding a 1. The answer must clearly identify immigration as the main
issue. If it is “foreigners” I include it, but if it is “overpopulation”, I do not.
19• (7) Democracy On the whole, are you satisfied or dissatisfied with the way the
democracy works in this country? Very satisfied is coded as 1, fairly satisfied is
coded as 2, “don’t know” is coded as 2.5, a little dissatisfied is coded as 3 and very
dissatisfied is coded as 4.
20Figures and Tables
Figure 1: Polish Immigration in comparison with other immigrants; Polish people are now
the largest group of immigrants; the vertical line divides time in pre- and post-accession.
Figure 2: The evolution of A8 Migrants since the year 2000; the vertical line divides time
in pre- and post-accession.
21Figure 3: Location of War Resettlement Camps in England and Wales in 1947.
Figure 4: Percentage of Polish immigrants plotted on distance to closest War Resettlement
Camp.
22Figure 5: Pre-1972 Local Authorities in thin black lines and present LAs in thick pink
lines.
23Table 1: Summary statistics for the LAs with detailed Migration data.
Variable Mean Std.Dev. Min. Max.
Population 171.28 115.91 33 1094
log(GVA2004 - NUTS1) 11.54 0.48 10.53 12.34
log(GVA2004 - NUTS2) 10.27 0.47 8.89 11.37
log(GVA2004 - NUTS3) 8.90 0.58 7.45 10.53
log(GVA2014 - NUTS1) 11.85 0.53 10.78 12.81
log(GVA2014 - NUTS2) 10.58 0.51 9.16 11.95
log(GVA2014 - NUTS3) 9.20 0.61 7.64 11.18
Turnout 73.77 4.96 59.25 83.57
Leave 54.55 9.95 21.38 83.57
Share of British 88.03 11.18 43.79 100
Unemployment 2004 4.38 1.88 1.8 13.1
Unemployment 2014 5.81 2.02 2.34 12.47
Distance 0.40 0.26 0.0007 1.44
Share of Polish 1.21 1.34 0 6.90
Latitude 52.03 1.12 50.26 55.15
Longitude -1.36 1.34 -5.07 1.74
The observed Unit is the LA. GVA is calculated using the income approach
and I take the natural logarithm. Unemployment, Turnout, vote in favour
of Leave and shares of immigrants/natives are measured in percentage
points. Population is measured in thousands. Distance as well as latitude
and longitude are directly taken from Google Maps. NUTS1, NUTS2 and
NUTS3 are different classifications for territorial units.
24Table 2: The first stage regressions together with the effect of Polish immigration on Brexit votes.
(1) (2) (3) (4) (5) (6) (7) (8)
P olishi P olishi
P opulationi P opulationi
Leave Leave Leave Turnout Turnout Turnout
Distancei -0.73∗∗∗ -1.15∗∗∗
(0.25) (0.30)
P olishi
P opulationi
0.62∗∗ 2.72∗ 3.12∗∗ -0.29∗∗ -0.71 -0.56
(0.31) (1.55) (1.52) (0.13) (0.49) (0.48)
CLR [-0.29,7.69] [0.13,10.81] [-2.12,0.32] [-4.57,0.92]
Regression OLS OLS OLS 2SLS(1) 2SLS(3) OLS 2SLS(1) 2SLS(3)
Controls No Yes Yes Yes Yes Yes Yes Yes
25
Observations 287 287 287 287 287 287 287 287
Adjusted R2 0.017 0.132 0.541 0.468 0.438 0.805 0.794 0.800
Robust Standard errors in parentheses. The observed unit is the LA. Columns 1 and 2 are the first stage regressions whereas
the the other columns are Two stage Least Squares regressions with controls on voting outcomes. Columns 5 and 8 use the non-
linear first stage. CLR is the conditional Likelihood Ratio. Controls include ln(GVA) for NUTS, NUTS2 and NUTS3 and
ln(Unemployment) for 2004 and 2014 as well as Latitude and Longitude and ln(Population) in 2014.
The F-Statistic for the excluded instrument is 14.6 (Column 2).
∗
p < 0.1, ∗∗ p < 0.05, ∗∗∗ p < 0.01Table 3: The effect of Polish immigration on Public Opinion with the linear first stage.
(1) (2) (3) (4) (5) (6) (7)
Issue-Immigration Protest-Vote Trust-Politicians UN-SG NHS-Investment Future-Optimism Democracy
P olishi
P opulationi
0.05∗∗∗ -0.08∗∗∗ 0.16∗∗ 0.03∗∗ -0.05 -0.02 -0.01
(0.02) (0.02) (0.08) (0.01) (0.03) (0.02) (0.02)
CLR [0.02,0.13] [-0.18,-0.04] [0.02,0.40] [0.01,0.08] [-0.15,0.01] [-0.07,0.01] [-0.05,0.02]
Controls Yes Yes Yes Yes Yes Yes Yes
Observations 287 287 287 287 287 287 287
Adjusted R2 . . 0.391 . 0.387 0.381 0.605
Robust Standard errors in parentheses. The observed Unit is the LA. The outcome variables are described in the Appendix All regressions are 2SLS
regressions carried out with the linear first stage. CLR is the conditional Likelihood Ratio. Controls include ln(GVA) for NUTS, NUTS2 and NUTS3
and ln(Unemployment) for 2004 and 2014 as well as Latitude and Longitude and ln(Population) in 2014. The F-Statistic for the excluded instrument is 14.6.
∗
p < 0.1, ∗∗ p < 0.05, ∗∗∗ p < 0.01
26Table 4: The effect of Polish immigration on Public opinion with the non-linear first stage.
(1) (2) (3) (4) (5) (6) (7)
Issue-Immigration Protest-Vote Trust-Politicians UN-SG NHS-Investment Future-Optimism Democracy
P olishi
P opulationi
0.06∗∗∗ -0.08∗∗∗ 0.18∗∗ 0.03∗∗ -0.03 -0.03 -0.02
(0.02) (0.02) (0.08) (0.01) (0.03) (0.02) (0.01)
CLR [0.03,0.21] [0.03,0.21] [0.04,0.52] [0.01,0.20] [-0.21,0.02] [-0.144, 0.00] [-0.20,0.03]
Controls Yes Yes Yes Yes Yes Yes Yes
Observations 287 287 287 287 287 287 287
Adjusted R2 . . 0.350 . 0.441 0.308 0.595
Robust Standard errors in parentheses. The observed Unit is the LA. The outcome variables are described in the Appendix. All regressions are 2SLS
regressions carried out with the non-linear first stage. CLR is the conditional Likelihood Ratio. Controls include ln(GVA) for NUTS, NUTS2 and NUTS3
and ln(Unemployment) for 2004 and 2014 as well as Latitude and Longitude and ln(Population) in 2014.
∗
p < 0.1, ∗∗ p < 0.05, ∗∗∗ p < 0.01
27Table 5: Distance of the closest WRC as a predictor of Non-Polish Immigrants
(1)
N on−P olishImmigrantsi
P opulationi
Distance -1.96
(1.26)
Regression OLS
Controls Yes
Observations 287
Adjusted R2 0.758
Robust Standard errors in parentheses.
The observed unit is the LA.
Controls include ln(GVA) for NUTS1,
NUTS2 and NUTS3 and
ln(Unemployment) for 2004 and 2014
as well as Latitude and Longitude
and ln(Population) in 2014.
∗
p < 0.1, ∗∗ p < 0.05, ∗∗∗ p < 0.01
Table 6: The impact of Polish Immigration on Brexit and Turnout controlling for the
share of British natives
(1) (2) (3) (4) (5) (6)
Leave Leave Leave Turnout Turnout Turnout
P olishi
P opulationi
1.02∗∗∗ 3.28∗∗ 3.50∗∗ -0.17 -0.60 -0.35
(0.30) (1.61) (1.49) (0.11) (0.49) (0.49)
CLR [0.28, 8.58] [0.47, 9.37] [-2.07, 0.43] [-2.31, 1.03]
Regression OLS 2SLS(1) 2SLS(3) OLS 2SLS(1) 2SLS(3)
Controls Yes Yes Yes Yes Yes
Observations 287 287 287 287 287 287
Adjusted R2 0.590 0.510 0.494 0.823 0.811 0.821
Robust Standard errors in parentheses. The observed Unit is the LA. All regressions control for the
natural logarithm of the share of British people. Regressions in columns (1) and (4) are OLS.
2SLS regressions use the linear first stage in columns (2) and (5) and the non-linear in columns (3)
and (6). CLR is the conditional Likelihood Ratio. Controls include ln(GVA) for NUTS1, NUTS2
and NUTS3 and ln(Unemployment) for 2004 and 2014 as well as Latitude and Longitude
and ln(Population) in 2014.
∗
p < 0.1, ∗∗ p < 0.05, ∗∗∗ p < 0.01
28Table 7: The impact of Polish Immigration on Brexit and Turnout using a (Card, 2001)
type instrument for the share of British people
(1) (2) (3) (4) (5) (6)
Leave Leave Leave Turnout Turnout Turnout
P olishi
P opulationi
1.66∗∗∗ 4.95∗∗ 5.08∗∗∗ 0.11 -0.35 -0.02
(0.33) (1.96) (1.80) (0.11) (0.55) (0.54)
Britishi
P opulationi
0.45∗∗∗ 0.82∗∗∗ 0.83∗∗∗ 0.17∗∗∗ 0.13∗∗ 0.16∗∗∗
(0.09) (0.21) (0.20) (0.02) (0.05) (0.05)
Regression OLS 2SLS(1) 2SLS(3) OLS 2SLS(1) 2SLS(3)
Controls Yes Yes Yes Yes Yes Yes
Observations 287 287 287 287 287 287
Adjusted R2 0.590 0.458 0.447 0.835 0.824 0.834
Robust Standard errors in parentheses. The observed Unit is the LA. The share of British
people is instrumented with its past share in 2000. Regressions in columns (1) and (4) are
OLS. 2SLS regressions use the linear first stage in columns (2) and (5) and the non-linear in
columns (3) and (6). No Conditional Likelihood Ratios are provided as they apply to cases
with only one instrumented variable. CLR is the conditional Likelihood Ratio.
Controls include ln(GVA) for NUTS1, NUTS2 and NUTS3 and ln(Unemployment)
for 2004 and 2014 as well as Latitude and Longitude and ln(Population) in 2014.
∗
p < 0.1, ∗∗ p < 0.05, ∗∗∗ p < 0.01
Table 8: Validity of the instrument: Local elections in 1973
(1) (2) (3)
1973
Con − Lab1973 Con 1973
− Lab1973 Con 1973
− Lab1973
Distancei -4.67
(4.39)
P olishi
P opulationi
3.16 2.70
(3.18) (3.18)
Regression OLS 2SLS(1) 2SLS(3)
Controls Yes Yes Yes
Observations 253 253 253
Adjusted R2 0.282 0.262 0.270
Robust Standard errors in parentheses. The observed Unit is the LA. Both regression
are 2SLS, column (1) uses the linear first stage and column (2) the non-linear first stage.
Con1973 − Lab1973 is the difference between vote shares for Conservative and Labour
candidates n the 1973 local election. CLR is the conditional Likelihood Ratio. Controls
include ln(GVA) for NUTS1, NUTS2 and NUTS3 and ln(Unemployment) for 2004 and 2014
as well as Latitude and Longitude and ln(Population) in 2014.
∗
p < 0.1, ∗∗ p < 0.05, ∗∗∗ p < 0.01
29Table 9: The effect of Polish immigration on the share of Net Outmigrants.
(1) (2)
P opulation2014 −P opulation2004 P opulation2014 −P opulation2004
P opulation2014 P opulation2014
P olishi
P opulationi
0.03 -0.12
(0.78) (0.80)
CLR [-2.25, 1.55] [-4.10, 1.43]
Regression 2SLS(1) 2SLS(3)
Controls Yes Yes
Observations 287 287
Adjusted R2 0.431 0.412
Robust Standard errors in parentheses. The observed Unit is the LA. Both
regressions are 2SLS and column (1) uses the linear and column (2) the
non-linear first stage. CLR is the conditional Likelihood Ratio. Controls
include ln(GVA) for NUTS1, NUTS2 and NUTS3 and ln(Unemployment)
for 2004 and 2014 as well as Latitude and Longitude and ln(Population)
in 2014.
∗
p < 0.1, ∗∗ p < 0.05, ∗∗∗ p < 0.01
30You can also read