Museum Routes in Italy in 2018 - Istat
←
→
Page content transcription
If your browser does not render page correctly, please read the page content below
30 JULY 2020

Museum Routes in Italy in 2018
Road routes that connect the museums and similar institutions surveyed by the Istat survey 2018
form the museum routes presented here (Istat, 2019a), the routes are enriched with information
on places of culture and tourism from official statistics or institutional sources.

The methodology with which they are built was already tested on the data of the survey
Museums and similar institutions 2015, and disseminated in the form of experimental statistics
(Istat, 2019b). Through a GIS procedure, the 107 start point museums, chosen as structures with
the largest number of visitors in each Unità Territoriali Sovracomunali (UTS) (NUTS 3: the
provinces, the metropolitan cities, the free consortia of municipalities or the former provinces
of Friuli-Venezia Giulia) are connected to all museums located up to 30 minutes away by car. The
tracts of road cross a set of communal territories in which there are villages, protected natural
areas and UNESCO sites. These territories are also characterized from the point of view of the
tourists who attend them and the population that inhabits them, all potential users of museums
and their natural and cultural heritage.

The routes here presented are very different from each other, some are particularly rich in
museums and other types of cultural heritage, some are concentrated in a single center and
others are distributed along many kilometers trough the territory, beyond the boundaries of the
UTS and the reference regions. In some cases, the paths overlap with each other, elsewhere they
are isolated. Local public administrators, decision-makers, cultural, tourism entrepreneurs, and
economic operators will find in this integrated geographical vision a useful support for their
work.

Each route is mapped and described in a summary card that presents a series of indicators on
the context, the type of museums and the tourist attitude of the route. Below you will find useful
information for reading the attached fact sheets.

Results
This is a first three-year update on museum routes, based on the aforementioned experimental
Statistics. The periodicity follows that of the long form survey on museums and similar
institutions that is carried out every 3 years.

Compared to the previous experiment, it should first be noted that the number of UTS has
changed, since some provinces of Sardinia have been abolished, from 110 to 107 routes. From
the comparison of those overlapping, in many paths there are little or no variations in both the
geography and the values of the associated statistics. In some cases, however, the differences
are considerable, due to the following causes:
Improvement of the registry of museums, as described in the section on methodological
aspects of the survey, which is to be considered a cognitive tool in continuous
evolution. This makes it possible to better assess the position of the surveyed objects and
to improve the evaluation of the number of visitors. For example, the path that starts
from the Abbey of Farfa reached in 2015 the municipality of Rome (with conspicuous
numerical consequences on associated statistics) for the presence of the "Museum of
instrumentation and crystallographic information" which was generically located on the
Via Salaria. The museum now has an exact address correctly located in the municipality
of Montelibretti. The 2018 route is therefore more compact and reaches museums with
a better geo-referencing. An example of how the change in the number of visitors can
change a route is in the Province of Forlì-Cesena where compared to 2015 the IDRO –
Water Ecomuseum of Ridracoli, located in the Apennines, become less visited than the
Museums of San Domenico located in the city, in a flat and very interconnected area; the
new route is therefore considerably more extensive and rich in itineraries.
Opening of new museums that are sometimes immediately very attractive to the public,
thus replacing the previous starting point of the route. A completely different route from
the previous one is, for example, in the province of Bolzano where in 2018 the most
visited museum is the Rastplatz "Plessi museum"/ rest area "Plessi" of Bressanone, a
recently established structure which, however, is located near the State border,
reachable by a single road and therefore the starting point of a route more meaner than
the one built in 2015 that started from the South Tyrol Archaeological Museum of
Bolzano.
Traffic changes that increase or decrease the distances covered in 30 minutes. An
obvious example is in the path of the archaeological area of Pompei where the
arrangement of the Naples-Salerno motorway and the opening of new communication
routes between the area of Pozzuoli and the Caserta tollbooth and among the Vesuvian
municipalities has modified the previous route by adding 48 new museums to the 53 of
2015.
Table 5 shows the 107 routes ordered according to the number of visitors and provides some
information on the population, the surface area, the number of museums and the arrivals in the
tourist facilities of the area underlying the route.
The analysis, carried out by integrating the different statistical sources, shows that routes with
the largest number of tourist arrivals do not necessarily have the largest number of museum
visitors and vice versa. Some cases are definitely examples of this evidence. The museum route
of Rimini, as an example, in 2018 registered only 637482 museum visitors but 5631140 tourist
arrivals. By contrast, the route of the excavations of Pompei (the third most visited museum in
Italy with about 4 million people) has over 13 million visitors but is at 96th place for tourist
arrivals (3780175 in 2018).
Table 5 – Museum routes in Italy: population, area, number of museums, museum visitors, tourist arrivals year
2018 (absolute values and percentages)
2di cui di cui arrivi
Superficie Numero di
Museo principale del percorso Comune Provincia Popolazione Visitatori visitatori Arrivi di non
(Kmq) (a) musei
stranieri residenti
Pantheon Roma Roma 3.111.709 1.717 131 25.505.971 34,1 10.398.205 70,0
Area Archeologica di Pompei Pompei Napoli 3.391.287 1.421 101 13.019.202 28,3 3.780.175 52,1
Palazzo Reale - Reggia di Caserta Caserta Caserta 2.285.427 1.195 76 12.376.591 26,1 1.949.128 43,9
Uffizi-Galleria delle Statue e delle Pitture Firenze Firenze 975.485 1.461 105 11.986.405 38,0 5.133.640 72,0
Villa Medicea di Poggio a Caiano e Giardino Poggio a Caiano Prato 1.258.614 1.964 140 10.186.141 33,4 5.701.004 70,6
Museo di San Marco Venezia Venezia 260.520 416 29 5.877.142 59,4 5.255.499 86,6
La Venaria Reale (Consorzio Delle Residenze Reali Sabaude) Venaria Reale Torino 1.514.530 1.176 74 5.171.956 17,8 1.736.340 24,4
Mudec - Museo delle Culture Milano Milano 3.344.122 1.390 101 5.083.801 21,3 7.814.451 57,1
Museo della Cattedrale di Lucca Lucca Lucca 1.064.622 2.479 90 5.043.621 30,1 3.100.510 53,8
Museo e Tesoro del Duomo di Monza Monza Monza e della Brianza 3.438.605 1.225 83 4.873.795 23,7 8.046.335 57,6
Cattedrale di Santa Maria Pisa Pisa 813.969 1.634 64 4.848.448 28,4 2.247.092 50,6
Museo di Storia Naturale del Mediterraneo Livorno Livorno 555.627 1.250 34 3.943.285 31,1 1.651.789 51,7
Museo dell'Opera della Metropolitana di Siena - Complesso del Duomo di Siena Siena Siena 152.717 1.123 41 3.502.875 35,7 879.121 56,8
Casa Natale Santa Cabrini Sant'Angelo Lodigiano Lodi 1.990.831 1.235 64 3.318.039 21,6 6.382.371 59,6
Anfiteatro Arena Verona Verona 795.885 1.613 37 2.117.800 27,6 4.502.548 59,6
Musei Civici di Padova - Arte Moderna e Medievale e Archeologica Padova Padova 1.085.935 1.494 53 2.096.827 19,3 7.474.674 74,0
Parco Archeologico di Naxos Taormina Giardini-Naxos Messina 965.997 1.045 25 2.055.045 26,1 1.406.490 55,3
Parco del Castello di Miramare Trieste Trieste 284.212 294 53 1.947.898 28,9 572.133 48,5
Museo Civico di Palazzo Chiericati Vicenza Vicenza 902.513 1.411 61 1.903.410 16,3 1.392.062 46,6
Mambo- Museo d'Arte Moderna di Bologna Bologna Bologna 1.288.364 3.093 93 1.530.454 22,4 2.775.901 41,6
Complesso Monumentale Palazzo Reale e Cappella Palatina Palermo Palermo 1.054.969 1.616 45 1.487.849 26,2 844.207 47,2
Museo Arcivescovile Ravenna Ravenna 626.255 2.249 59 1.483.762 15,9 2.590.375 19,3
Museo delle Scienze Trento Trento 361.662 1.661 41 1.346.765 23,4 1.396.677 48,8
Musei di San Domenico Forlì Forlì-Cesena 601.258 1.944 56 1.341.415 15,4 2.433.216 17,4
Museo Civico Castello Ursino Catania Catania 704.805 906 25 1.281.824 26,0 1.339.250 55,6
Parco Archeologico e Paesaggistico della Valle dei Templi Agrigento Agrigento 183.648 881 10 1.114.375 30,3 183.145 59,1
Storico Giardino Garzoni e Collodi Butterfly House Pescia Pistoia 481.557 1.542 59 1.011.500 29,6 1.207.726 60,3
Galata Museo del Mare Genova Genova 903.022 1.298 91 1.002.400 18,9 1.758.478 46,8
Galleria Nazionale di Parma Parma Parma 649.090 1.953 72 943.437 17,4 857.710 37,0
Parco E Museo del Volo - Volandia Somma Lombardo Varese 2.762.070 1.489 65 917.331 13,8 7.623.072 60,1
Museo Ferrari - Maranello Maranello Modena 471.506 922 34 895.659 19,2 530.090 35,1
Castello Scaligero Sirmione Brescia 280.565 898 26 887.307 23,2 3.178.160 64,3
Area Archeo della Neapolis e Orecchio di Dioniso Siracusa Siracusa 275.971 1.277 11 805.910 32,4 388.282 46,4
Statua Colossale di San Carlo Arona Novara 641.190 999 44 763.272 22,9 1.751.171 62,6
Musei Civici - Palazzo dei Musei Reggio nell'Emilia Reggio nell'Emilia 932.335 1.761 43 730.970 16,9 1.086.816 34,1
Complesso Monumentale del Castello e Parco di Racconigi Racconigi Cuneo 1.278.011 1.618 40 705.362 21,0 1.521.547 27,7
Museo Artistico E Storico di Palazzo Borromeo Stresa Verbano-Cusio-Ossola 122.980 410 24 647.694 35,9 747.384 73,9
Museo di Palazzo Ducale Mantova Mantova 198.332 937 19 646.754 22,9 208.504 26,8
Museo della Citta' Luigi Tonini Rimini Rimini 613.459 1.187 45 637.482 15,2 5.631.140 18,9
Museo del Tesoro della Basilica Papale di San Francesco Assisi Perugia 312.995 1.248 41 629.362 33,1 1.211.581 31,1
Parco dei Mostri, Sacro Bosco di Bomarzo Bomarzo Viterbo 181.554 1.735 25 600.684 25,5 313.256 28,9
Pinacoteca e Museo Civico di Palazzo Mazzetti Asti Asti 1.343.794 1.799 55 581.550 18,9 1.738.030 31,9
Pozzo di San Patrizio Orvieto Terni 68.261 1.207 28 569.990 28,3 284.637 41,6
Parco Archeologico di Segesta Calatafimi-Segesta Trapani 417.211 2.390 22 554.800 27,9 430.573 39,0
Casa Museo Villa Monastero Varenna Lecco 167.251 800 25 540.626 27,6 479.170 75,0
Pinacoteca Accademia Carrara Bergamo Bergamo 1.357.531 1.242 50 527.532 14,2 1.578.546 46,4
Pinacoteca del Seminario Vescovile Rovigo Rovigo 631.621 1.681 50 522.754 20,1 1.863.128 38,6
Villa Carlotta Tremezzina Como 50.324 340 14 487.406 42,3 352.235 83,3
Rocca Demaniale di Gradara Gradara Pesaro e Urbino 459.446 766 31 463.110 19,8 3.735.335 20,6
Museo Archeologico Nazionale di Paestum Capaccio Paestum Salerno 96.978 358 8 462.789 23,1 206.530 20,8
Basilica Patriarcale Aquileia Udine 200.134 831 26 461.844 18,2 258.740 49,3
Castello di Gorizia - Museo del Medioevo Goriziano Gorizia Gorizia 161.646 527 26 458.634 16,7 242.455 50,8
Museo Regionale Villa Romana del Casale di Piazza Armerina Piazza Armerina Enna 53.555 874 7 403.288 35,8 56.695 43,2
Rastplatz "Plessi Museum"/Area di Sosta "Plessi" Bressanone Bolzano/Bozen 44.435 663 5 395.431 67,7 636.315 64,8
Castello Malaspina Massa Massa-Carrara 470.326 775 39 363.197 20,7 1.263.208 43,0
Casa Leopardi Recanati Macerata 423.213 1.240 54 359.244 14,7 720.718 17,0
Forte di Bard Bard V.d'Aosta/Vallée d'Aoste 25.885 389 14 354.246 16,4 133.728 28,4
Abbazia di Fossanova Priverno Latina 402.907 1.523 24 349.989 12,1 262.475 17,0
Museo Preistorico della Val Varatella Nino Lamboglia Toirano Savona 273.884 656 46 321.278 27,1 1.474.340 30,1
Basilica di San Francesco Arezzo Arezzo 270.062 2.032 39 321.104 29,6 450.222 47,4
Castel del Monte Andria Barletta-Andria-Trani 200.067 865 6 301.911 17,3 49.378 20,4
Abbazia di Montecassino Cassino Frosinone 93.411 563 9 300.323 25,3 61.323 21,3
Sacro Monte di Crea Serralunga di Crea Alessandria 144.163 732 22 299.814 17,8 103.229 39,6
Museo Archeologico Nazionale Reggio di Calabria Reggio Calabria 257.146 482 16 299.394 25,3 138.943 18,3
Galleria d'Arte di Palazzo Bellini Comacchio Ferrara 235.250 1.706 16 271.205 13,3 951.882 27,2
Fondazione Museo del Violino Antonio Stradivari Cremona Cremona Cremona 357.708 1.448 34 253.731 12,5 332.857 30,8
Museo del Castello. Collezioni Civiche Archeologiche U. Formentini La Spezia La Spezia 365.815 1.105 33 249.791 23,6 696.963 44,7
Area Archeologica Su Nuraxi Barumini Sud Sardegna 73.279 1.422 38 246.296 12,8 28.394 14,7
Storica Casa Grotta di Vico Solitario Matera Matera 168.530 1.173 14 231.649 33,7 396.700 25,5
Museo della Rocca Viscontea di Castell'Arquato Castell'Arquato Piacenza 258.896 1.264 25 229.173 19,4 436.350 34,1
Museo Civico Summonte Avellino 516.184 876 29 224.543 16,7 426.830 29,2
Trullo Sovrano Alberobello Bari 366.875 1.845 17 213.091 30,4 678.787 35,6
Parco Archeologico di Siponto Manfredonia Foggia 102.223 935 8 212.503 19,4 339.550 26,5
Ricetto Candelo - Ecomuseo Della Vitivinicoltura Candelo Biella 198.170 764 31 211.638 16,5 94.771 28,3
Sacrario Militare di Cima Grappa Crespano del Grappa Treviso 86.973 391 12 197.883 18,8 122.518 43,8
Museo dell'Intreccio Mediterraneo Castelsardo Sassari 17.471 266 6 186.794 45,0 66.176 71,4
Museo Nazionale e Parco Archeologico Archeologico di Egnazia G. Andreassi Fasano Brindisi 256.571 1.164 15 183.189 36,1 723.018 37,2
Museo Malacologico Piceno Cupra Marittima Ascoli Piceno 429.179 1.159 62 181.398 19,7 896.146 13,8
Area Archeologica di Tharros Cabras Oristano 40.861 187 8 159.988 29,8 87.423 41,9
Museo Abbazia Benedettina di Santa Maria In Silvis Sesto al Reghena Pordenone 524.680 1.808 37 157.673 11,8 468.360 50,0
Castello Sforzesco Visconteo Vigevano Pavia 199.211 493 11 156.724 9,0 43.089 35,6
Museo della Vita e delle Tradizioni Popolari Sarde / Museo del Costume Nuoro Nuoro 59.475 820 14 156.660 29,9 119.041 55,2
Museo Marca - Museo delle Arti Catanzaro - Open Marca Parco Internazionale delle
Catanzaro
Sculture Catanzaro 199.108 784 14 150.463 20,0 152.126 14,5
Cisterne Romane Fermo Fermo 317.792 804 37 146.913 16,4 587.815 14,6
Forte Santa Tecla Sanremo Imperia 181.085 486 25 146.278 36,4 588.314 50,9
Area Archeologica del Teatro Romano di Benevento Benevento Benevento 322.588 1.440 28 137.303 17,3 113.641 16,3
Area Archeologica di Nora Pula Cagliari 8.976 236 3 129.589 36,7 120.729 51,8
Museo Archeologico Nazionale del Melfese Massimo Pallottino Melfi Potenza 91.324 1.202 9 129.071 20,0 42.914 10,8
Le Castella Isola di Capo Rizzuto Crotone 92.968 442 5 128.175 35,0 117.755 7,6
Museo Archeologico Nazionale D'Abruzzo - Villa Frigerj Chieti Chieti 419.874 960 25 123.741 21,8 501.816 13,9
Parco Archeologico 'Citta' del Tufo' Sorano Grosseto 41.061 1.321 25 123.408 25,0 183.161 23,5
Museo Casa Natale di Gabriele D'Annunzio Pescara Pescara 469.467 1.011 29 120.642 22,5 674.920 14,3
Museo della Carta e della Filigrana Fabriano Ancona 135.644 1.694 35 120.219 15,5 186.350 17,2
Museo Provinciale Murattiano Pizzo Vibo Valentia 196.868 857 16 118.125 24,2 316.562 36,1
Fortezza e Museo delle Armi e Mappe Antiche Civitella del Tronto Teramo 298.876 906 29 106.715 19,4 432.448 13,7
Museo Archeologico Nazionale di Taranto Taranto Taranto 387.319 1.106 11 89.456 17,3 157.437 23,6
Museo Naturalistico Centro Visita Cupone Spezzano della Sila Cosenza 50.483 981 8 83.339 28,3 38.671 3,6
Area Archeologica di Cava D'Ispica Modica Ragusa 216.310 1.621 11 80.773 35,6 345.171 40,4
Museo della Grande Guerra In Marmolada-Onlus Rocca Pietore Belluno 4.553 252 3 74.913 25,0 204.542 50,4
Museo Civico di Niscemi Niscemi Caltanissetta 225.468 1.340 15 73.317 18,5 47.110 32,9
Sacro Monte di Varallo Varallo Vercelli 29.636 258 10 64.819 19,1 9.726 23,2
Frantoi Ipogei di Palazzo Granafei Gallipoli Lecce 179.651 674 14 62.844 18,9 291.886 21,4
Museo dei Misteri Campobasso Campobasso 99.249 931 16 60.361 22,7 20.653 7,2
Castello Piccolomini Celano L'Aquila 92.535 973 12 50.327 18,6 32.475 13,2
Abbazia di Farfa Fara in Sabina Rieti 119.428 519 14 44.753 14,2 145.698 63,2
Museo Valtellinese di Storia e Arte Sondrio Sondrio 90.535 921 7 33.515 19,3 134.187 29,5
Santuario Italico Pietrabbondante Isernia 46.004 807 13 31.790 11,9 17.743 8,0
(a) Surface areas are dated 1.1.2019 Source: process on Istat data
3Information Gap filled
Often information on museum heritage is spread out according to traditional administrative
geographies. In identifying non-administrative geographies, this study provide a more accurate
and consistent spatial reading of the phenomenon analyzed. There are many actors potentially
interested in this information: local and national administrators and policy makers, economic
operators involved in tourist services management, researchers involved in the study of the
relationships of cultural phenomena with the territory.
Innovation
The method (described in the section dedicated to methodology, and in the experimental
statistics on Museum Routes 2015) is an original method to identify routes that, starting from
the geographical coordinates of the most visited museum, defines all the routes that connect it
to all museums within 30 minutes driving time; hence giving rise to a precise representation of
the path independent from administrative boundaries. Paths can be updated thanks to the
periodicity of the survey on museums and similar institutions.
The 2018 survey, described below, acquires an additional key of reading the many data
produced. The method allows the survey data to be presented in relation to new geographies
and integrated with other sources (tourism data, environmental data, demographic data, etc.).
The sources used are mainly from official statistics, with verified reliability and considerable
synthesis.
Method
The Survey on museums and similar institutions
Methodological aspects
The Survey on museums and similar institutions - foreseen in the National Statistical Programme
2017-2019 that defines statistics of national importance - was carried out by ISTAT in the
framework of the "Memorandum of Understanding for the development of the integrated
information system on institutes and places of culture", signed in 2017 at the State-Regions
Conference by Istat, MIBACT, Regions and Autonomous Provinces of Trento and Bolzano, and in
close collaboration with the CEI - Ufficio Nazionale per i Beni Culturali Ecclesiastici e l'Edilizia di
Culto, which provided the data of institutes of ecclesiastical institutions collected annually as
part of its institutional activities. Since 2017 the survey is conducted on an annual basis thanks
to the agreement between ISTAT and the Managing Authority of the PON "Governance and
Institutional Capacity 2014-2020", relating to the implementation of the Project "Territorial and
Sectorial Statistical Information for Cohesion Policies 2014-2020", which sees ISTAT and the
Department of Cohesion Policies (DPCOE) as proposers Presidency of the Council of Ministers
and the Territorial Cohesion Agency (ACT) and that allows to update in a systematic way the
identification and descriptive data on the institutes and places of culture (museums and
4libraries) present in Italy, through the realization of special short surveys.
The census survey provides an updated and detailed description of all the museums and other
museums in Italy, whether public or private, state or non-state, as long as they are open to the
public in the reference year, with regulated way of use. The survey is aimed at the main of each
unit present in the starting list through the compilation of online questionnaires divided into
several modules. The survey explores several topics. In addition to the description of the
structural characteristics of the museums, the type of assets preserved and exhibited, the legal
nature and forms of management, it investigates how to access and visit, the consistency of
assets owned, staff employed, on the financial resources and expenses incurred, on the support
for the visit, the cultural activities and services offered to the public and, for the first time, also
on the presence and the characteristics of the museum structures that are part of ecomuseal
projects formally recognized.
Istat conducted the survey between May and July 2019, sending the information letter to all the
museums and similar institutions present in the list built based on the previous Istat survey and
integration provided by the regions and intermediate bodies that actively collaborate at the
different stages of the survey1.
Of the 5688 museum units on the starting list 5042 units were eligible – that is, they had the
requisites to become part of the observation universe. To these, adding the ecclesiastical
structures and the province of Bolzano, provided respectively by the CEI and the Provincial
Statistical Institute (Astat) at the end of the survey, there is a total of 5,236 eligible units (Tav.
1).
Tavola 1 - Unità eleggibili per tipologia e regione - Anno 2018
ISTITUTI MUSEALI
REGIONI NON TOTALE
STATALI
STATALI
Piemonte 16 408 424
Valle d'Aosta - Vallée d'Aoste - 65 65
Lombardia 26 422 448
Trentino-Alto Adige - 207 207
Bolzano Bozen - 112 112
Trento - 95 95
Veneto 16 304 320
Friuli-Venezia Giulia 14 170 184
Liguria 13 202 215
Emilia-Romagna 34 451 485
Toscana 66 518 584
Umbria 13 159 172
Marche 17 335 352
1 especially the Ministry for cultural heritage and activities (Mibact), Regions and autonomous Province (via documental,
statistics and administrative archieves) and the Italian Episcopal Conference (Cei) with its database BeWeb.
5Lazio 97 277 374
Abruzzo 26 100 126
Molise 13 31 44
Campania 72 178 250
Puglia 19 155 174
Basilicata 15 35 50
Calabria 19 158 177
Sicilia - 265 265
Sardegna 20 300 320
Italia 496 4.740 5.236
Of these, in 2018, 4,908 museums and similar institutions are open to the public. The 328
structures that remained excluded, equal to 6.2%, declare to have remained closed to the public
in the reference year.
Results of the 2018 survey
In 2018, the Italian heritage is quantified in 4,908 institutions spread throughout the national
territory able to mobilize a total of over 128 million visitors2.
It is a heritage consisting of 3,882 museums and collections of collections (79.1%), 630
monuments or monumental complexes (12.8%), 327 areas or archaeological parks (6.7%) and
69 museum structures belonging to ecomuseal projects (1.4%), found in a capillary way
throughout the territory: one in three Italian municipalities offers at least one structure, about
1 per 50 square km and 1 per 12 thousand inhabitants.
Tuscany (553), Emilia-Romagna (454), Lombardy (433), Piedmont (411), Lazio (357) and Veneto
(304) are the regions with the highest concentration of structures either museums,
archaeological areas or monuments while Rome (121), Florence (69), Turin (49), Milan (47),
Bologna (46), Trieste (41) Genoa (40), Naples (38), Venice (37) and Siena (34) are the first 10
cities with the greatest number of evidence of the historical-cultural, architectural and
archaeological wealth of Italy.
In addition to the poles of greatest attraction there are also places of cultural interest in small
and very small municipalities: 16.1% of museums are located in municipalities with less than 2
thousand inhabitants – some of which can count up to 5-6 structures – while 30% is present in
municipalities from 2 thousand to 10 thousand residents. The cultural offer presented by Italian
museums is extremely varied. There is a wide diffusion of archaeological museums with
evidence of prehistoric and ancient civilizations, archaeological areas and parks and
archaeological artifacts (20%) especially in Sardinia, Basilicata, Molise, Sicily and Lazio. Then
there are the museums that exhibit collections and heritage of ancient, modern and
contemporary art (17.8%), mainly present in Umbria, Tuscany, Marche and Lombardy, and the
2 The number of visitors is calculated based on the data provided by museums and similar institutions that answered the
question, equal to 90.5% of the total facilities.
6museums that tell the uses and customs of local communities through ethno-anthropological
collections (11.7%), mainly found in Basilicata, the Province of Bolzano, Calabria, Valle d'Aosta
and Piedmont. The museums of sacred art, museums and monuments with a religious vocation
are 10.3% of the total, located largely in the South (Apulia, Campania, Calabria and Sicily).
In 2018 there was a record number of 128.6 million admissions (+8% compared to 2017): 63.4
million in museums, 51.1 million in monuments, 13.7 million in archaeological areas and 488
thousand in museum structures participating in ecomuseal projects.
In addition to the variety of the offer, the national cultural heritage also distinguishes the
dimensional polarization and concentration of visitor flows: Pantheon, Flavian Amphitheater
(Colosseum), Archaeological Area of Pompeii and Museum and Park of Capodimonte, have
registered more than three million visitors each in 2018, totaling 21.5 million people,
representing 17% of the total audience of the entire Italian cultural heritage.
The territorial and type of structure differences are however relevant. To attract the largest
number of public (100 thousand admissions on average per structure) are mainly villas, palaces
and monuments of historical and artistic interest, especially in Friuli-Venezia Giulia and Lazio. On
average, more than 40 thousand visitors per exhibition structure are registered by modern and
contemporary art museums (especially in Veneto, Tuscany, Campania and Piedmont). Abruzzo,
Molise and Marche are the regions whose structures welcome the lowest number of visitors (on
average about 6 thousand per year).
In 2018, the audience of foreigners is estimated at 58.6 million (46% of the total audience).
Almost half are attracted by works and goods exhibited in museums and/or art collections
(45.9%), 42% by monumental beauties and 12% by archaeological areas or parks.
Routes identification
The "Survey on Museums and Similar Institutions" has, for the first time in 2015, allowed to
locate on the territory the objects detected through the control and normalization of addresses
and the assignment of a pair of geographical coordinates to the access point of the museum. The
processes of geo-coding and geo-referencing evolve in the successive editions of the survey so,
together with the refinement of the registry, the knowledge of the position of the objects of the
culture surveyed has improved.
Territorial geo-reference assigned to each structure concern:
normalized address, or the address is rewritten in the normal form (DUG + nome + civic)
and possibly identified by the national register of ANNCSU addresses. This process is
assisted by commercial software (Egon owned by the company Ware Place srl) for
recognition and standardization
mesh of the European regular grid provided by EUROSTAT, defined in the reference
7system (EPSG: 3035) ETRS89/LAEA and transformed into WGS84 / UTM32N
address point coordinates in the WGS84 reference system projected into UTM32N. The
geo-referencing process, which began with the survey of 2016, consists in assigning the
coordinates of the entrance of the museum, starting first from those available together
with the addresses automatically recognized. An operator using orthophoto recognition,
Openstreetmap or Google Maps, tracks missing coordinates on a map. In the following
occasions of investigation, it has been possible to verify the automatic positioning while
validating all those for which the position had been retrieved with approximation.
Geo-referencing and geo-coding allow immediate comparison with spatial information from
other sources, at different levels of detail.
For each supra-municipal territorial unit (NUTS 3), from the geographical coordinates of the most
attractive museum, in terms of annual number of visitors (main museum), all routes connecting
it to other museums within a maximum driving time of 30 minutes have been defined, even if
there are temporary traffic restrictions (for example, limited traffic zones provided for time slots
in some urban centres). To define the routes, the Tom-Tom road graph was used in the March
2018 version within the Arcmap Network Analyst tool. This process allows to obtain a
representation of the paths adhering to the territorial reality regardless of administrative
boundaries.
The choice of the starting point of the itineraries is a proposal to answer the pressing question
on how to reduce congestion in "fashionable" tourist destinations, distributing the public in the
less known though interesting structures. The current need for compliance with physical spacing
measures in the most well-known mosaic structures because of emergency management Covid-
19 and the rediscovery by the public from both Italy and the rest of the world of part of the
museum heritage make the proposal even more congruent. However, the methodology used
would allow routes to be drawn from any other starting point, using different means of
transport, over different distances. It would be possible, for example, to design cycling routes
around a farm, or walking routes from a parking lot, or even train routes from airports or ports
and also routes from the most popular tourist destinations, just to name a few.
The routes are analyzed and characterized by their spatial aspects, both in relation to each other
and to the territory they cross, using or G.I.S. instruments (e.g. the number of accessible
museums, proximity to parks and natural areas).
The geographies obtained are also characterized by integrating the data of the survey on the
Museums with those available on an area basis at a minimum level of the municipality: tourism
(Istat, Movement of customers in accommodation establishments), demography (Istat,
Movement and calculation of the annual resident population), UNESCO sites (UNESCO),
municipalities "Borgo" (The Most Beautiful Villages in Italy, Orange Flags, and the "Authentic
Villages of Italy"), protected natural areas (Ministry of the environment). All the sources used
provide geo-referenced information or, at least, geocoded information at the municipal level. It
is therefore possible to analyze the range of statistical information available in relation to the
new geographical units defined.
8Overall, the 107 museum routes consist of 3,770 itineraries that lead to each museum reachable
in 30 minutes by car; the museum institutions placed in the total of the routes are 2,749, 74 of
which are reached in more than one route as shown in Figure 2. The routes cross 2,470
municipalities, which represent the geographical unit of analysis for the statistics presented in
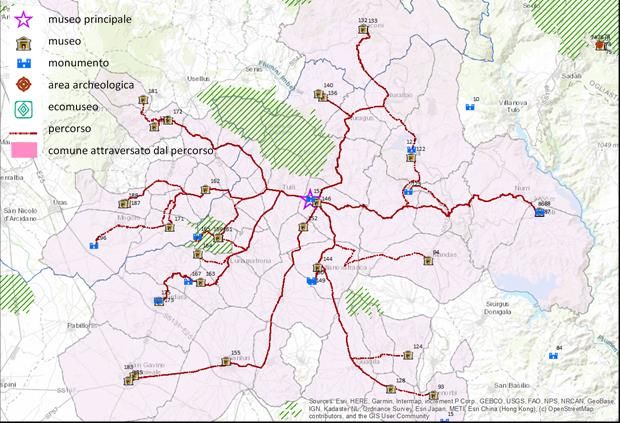
the attached tables (Figure 1).
Figura 1 – I percorsi museali: geografie
As already mentioned, sometimes the same museum can be reached from one or more main
museums and therefore become a destination in more than one route, as can be seen from
figure 2.
Each identified route is described by the characteristics of the museums reached, the presence
or not of parks, villages, UNESCO sites and the basin of potential users (resident population and
tourist arrivals). While to characterize each of the itineraries we use exact spatial information
(for example, exact location of the museum, the park, etc.), in the same way, for the 107 routes,
data and indicators refer to the municipalities underlying them:
tourism (Istat, Movement of customers in accommodation establishments);
demography (Istat, Movement and calculation of annual resident population);
UNESCO sites (UNESCO);
hamlets (I Borghi più belli d’Italia, Bandiere arancioni, Borghi Autentici d’Italia);
protected natural areas (Ministero dell’ambiente e della Tutela del Territorio e del Mare).
9Figura 2 – Example of partially coincident routes
percorso 1
percorso 2
percorsi 1 e 2 sovrapposti
Table 1 shows some information on the identified routes. The museum routes are 107,
corresponding to the 107 most visited museums for each NUTS 3, from which you can visit 2,749
museums (56% of all Italian museums) through a network of routes that can be covered in 30
minutes by car. Table 1 also shows a marked polarization in terms of visitors. In fact, the
identified routes concentrate about one third of the visitors (31.4%) in the 107 most frequented
museums and 86.6% in all the museums located in the itineraries. The museums not reached by
the routes are, however, 2,159, for a basin of just over 17 million visitors, 13.4% of all visitors to
Italian museums.
On average, there are 34 museums in each route, but with an extreme variability: from 3 to 140
institutes. This depends on several factors, including the historical-cultural identity, very varied
in the country, the road networks and the morphology of the different territories. The latter
shapes the extension of the routes that can be covered in 30 minutes by car and therefore the
number of museums: routes located in the plains will have a greater linear extension as more
developed and more easily passable will be the road networks compared to those of routes
located in mountain areas.
10Tabella 1 - Musei ed istituti similari inseriti nei percorsi museali,
anno 2018 (valori assoluti e percentuali)
Musei e istituti similari Visitatori
Musei
Numero % Numero %
Musei inseriti nei percorsi 2.749 56,0 111.338.085 86,6
Musei più visitati nei percorsi 107 2,2 40.350.491 31,4
Altri musei inseriti nei percorsi 2.642 53,8 70.987.594 55,2
Musei non inseriti nei percorsi 2.159 44,0 17.301.837 13,4
Totale musei Italia 4.908 100,0 128.639.922 100,0
Fonte: El a bora zi one s u da ti Is tat, "Inda gi ne s ui mus ei e gl i i s tituti s i mi l a ri ", a nno 2018.
Table 2 provides information on the types of museum institutions included in the routes: 51.4%
of the most visited are museums, 35.5% monuments or monumental complexes and 12.1%
archaeological areas or parks, in line with national averages.
The legal form (Table 3) does not seem to be characteristic of museums included in museum
routes compared to those that are not part of it. The total number of institutions present in the
routes identified shows, in fact, characteristics in line with the national value, with 62.7% of
public museums and 37.3% private. This correspondence, however, disappears when looking at
the 107 most visited museums of the routes. The majority of public museums are included in the
routes, with peaks of over 70% among the most visited museums.
11Tabella 3 - Musei ed istituti similari inseriti nei percorsi museali per forma giuridica del soggetto titolare,
anno 2018 (valori assoluti e percentuali) (a)
Forma giuridica
Musei Numero %
Pubblico Privato Totale Pubblico Privato Totale
Totale musei inseriti nei percorsi 1.658 985 2.643 62,7 37,3 100
Musei più visitati nei percorsi 75 31 106 70,8 29,2 100
Altri musei inseriti nei percorsi 1.583 954 2.537 62,4 37,6 100
Totale musei non inseriti nei percorsi 1.373 683 2.056 66,8 33,2 100
Totale musei Italia 3.031 1.668 4.699 64,5 35,5 100
(a) Le percentuali sono calcolate sui 4699 musei che hanno risposto al quesito sulla forma giuridica.
Fonte: El a bora zi one s u da ti Is tat, "Inda gi ne s ui mus ei e gl i i s tituti s i mi l a ri ", a nno 2018.
As for the presence of green areas, certified villages and UNESCO sites, just under 90% of the
routes insist on at least one green area while 54.2% cross municipalities that have in their
territory one or more hamlet and 50.5% municipalities with UNESCO World Heritage Sites
(United Nations Educational, Scientific and Cultural Organization). Finally, 20.6% of routes have
all three characteristics (Table 4).
Moving on to an analysis of the context of the routes identified, we relate data on museum
visitors to those of tourist presence in the municipalities crossed by the different routes, also in
order to assess the potential catchment area of the different territories.
Tabella 4 - Percorsi museali che attraversano aree naturali protette, comuni "Borgo" e/o siti UNESCO,
anno 2018 (valori assoluti e percentuali)
% sul totale
Percorsi museali Numero
dei percorsi
Percorsi con aree naturali protette 85 79,4
Percorsi con comuni "Borgo" 58 54,2
Percorsi con siti Unesco 54 50,5
Percorsi con aree verdi, comuni "Borgo" e siti Unesco 21 19,6
Fonte: Elaborazione su dati Anci, Touring Club Italiano, “Borghi Autentici d’Italia", Ministero dell'Ambiente, UNESCO.
Bibliography
Bertollini M., Caramis A., D'Elia M., Prisco M.R., Talice S. (2019), I percorsi museali in Italia: un
mosaico culturale da ricomporre, in S. Cerutti e M. Tadini (a cura di), Mosaico, Memorie
geografiche della Società di Studi Geografici, Franco Angeli, Milano.
Bertollini M., Di Pede F., Talice S. Georiferimento di musei e istituzioni similari attraverso
l’archivio nazionale degli indirizzi. ASITA 2017.
12Comitato Permanente di Promozione del Turismo, Piano Strategico di Sviluppo del Turismo
2017-2022, MiBACT - Ministero dei Beni e delle Attività Culturali e del Turismo, Roma, 2017.
Consiglio d’Europa (2005), Convenzione quadro del Consiglio d’Europa sul valore dell’eredità
culturale per la società, Faro.
Istat (2020), Movimento dei clienti negli esercizi ricettivi, Roma.
Istat (2019a), Indagine sui musei e istituzioni similari, Roma.
Istat (2019b), Statistica sperimentale, I percorsi museali in Italia,
https://www.istat.it/it/archivio/236140
Minucciani V. (2017), The territory and the small museums: The case of Piemonte, , pp.1-10.
M. Rota (2019). Musei per la sostenibilità integrata. Fondazione Fizcarraldo, collana Geografie
culturali. Editrice Bibliografica
I Quaderni di Symbola – 11 Gen 2018. Piccoli Comuni e Tipicità.
https://www.symbola.net/ricerca/piccoli-comuni-e-tipicita-la-ricerca-coldiretti-symbola/
Santagata W. (2005), I distretti culturali nei paesi avanzati e nelle economie emergenti, in
, X, pp.141-152M.
For information:
Silvia Talice
talice@istat.it
ph. +39 06 4673.7369
Maria Rosaria Prisco
prisco@istat.it
ph. +39 06 4673.7518
The research group that has contributed to the production and analysis of "The museum routes
in Italy" is composed of:
Marina Bertollini, Alessandro Caramis, Marica D'Elia, Alessandra Federici, M. Rosaria Prisco
e Silvia Talice.
13You can also read