National Analytical Study on Housing - RAXEN Focal Point for the Netherlands Dutch Monitoring Centre on Racism and Xenophobia (DUMC) - European ...
←
→
Page content transcription
If your browser does not render page correctly, please read the page content below
National Analytical Study
                  on Housing

RAXEN Focal Point for the Netherlands

 Dutch Monitoring Centre on Racism and Xenophobia (DUMC)

                            Jacky W. Nieuwboer, MA, LLM

                                         October 2003

                                                      1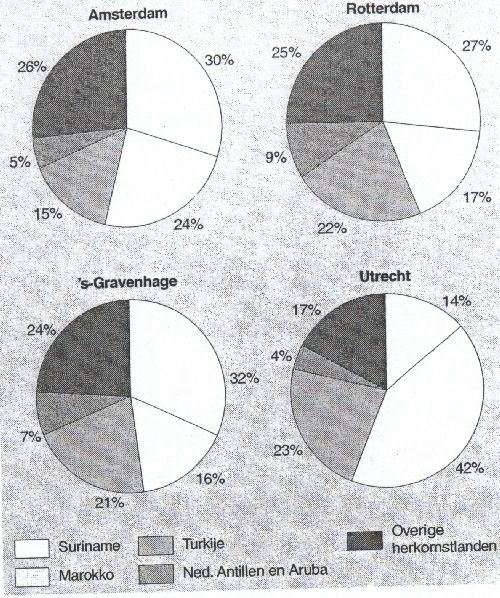
DISCLAIMER: This study has been compiled by the National Focal Point of the Racism and Xenophobia Network
operated by the European Monitoring Centre on Racism and Xenophobia (EUMC). The opinions expressed by the
author/s do not necessarily reflect the opinion or position of the EUMC. No mention of any authority, organisation,
company or individual shall imply any approval as to their standing and capability on the part of the EUMC. This study is
provided by the National Focal Point as information guide only, and in particular does not constitute legal advice.

                                                                                                                  2
TABLE OF CONTENTS
1. EXECUTIVE SUMMARY 5
2. GLOSSARY 9
3. INTRODUCTION 12
4. LEGISLATION AND POLICIES 15
4.1. INTRODUCTION 15
4.2. BRIEF HISTORICAL SKETCH 15
4.3. LEGISLATION 15
4.3.1. PUBLIC HOUSING LEGISLATION 15
4.3.2. THE HOUSING ACT AND SUBSIDISED RENTED SECTOR MANAGEMENT DECREE 17
4.3.3. HOUSING ALLOCATION ACT 18
4.3.4. RENT ALLOWANCE ACT AND RENT ALLOWANCE DECREE 18
4.3.5. CIVIL CODE 19
4.3.6. EQUAL TREATMENT ACT 20
4.4. HOUSING ALLOCATION IN PRACTICE 21
4.4.1. INTRODUCTION 21
4.4.3. SUPPLY MODEL 22
4.4.4. COMPARING THE DISTRIBUTION MODEL AND THE SUPPLY MODEL 23
4.5. POLICIES 25
4.5.1. POLICY DOCUMENT ON HOUSING, PEOPLE AND THEIR NEEDS 25
4.5.2. LETTER ON SEGREGATION 26
5. DESCRIPTION AND ANALYSIS 27
5.1. MINORITY GROUPS AND HOUSING - DENSITY 27
5.1.1. DATA 27
5.2. MINORITY GROUPS AND HOUSING - QUALITY 33
5.2.1. DATA 33
5.3. DISTRIBUTION POLICY 36
5.3.1. ARGUMENTS FOR A DISTRIBUTION POLICY 36
5.3.2. ARGUMENTS AGAINST A DISTRIBUTION POLICY 37
5.3.3. EVALUATION 38
5.4. DATA ON COURT CASES 38
5.4.1. COMPLAINTS BEFORE THE BENCH AND BEYOND 38
6. ANALYSIS OF DISCRIMINATION 40
6.1. INTRODUCTION 40
6.2. INDIRECT DISCRIMINATION IN THE SUPPLY SYSTEM BY MEANS OF REQUIRED LENGTH 40
OF RESIDENCE 40
6.3. SEGREGATION AND INCOME 42
36.4. SEGREGATION AND EDUCATION 43
6.5. DATA ON COURT CASES 45
6.5.1. HOUSING ALLOCATION 45
6.5.2. DISTRIBUTION POLICY 49
6.5.3. NEIGHBOURHOOD DISPUTES 50
6.6. OTHER COMPLAINTS 51
6.7 ROOM RENTAL 57
6.7.1. INTRODUCTION 57
6.7.2. DISTRIBUTION OF ROOMS 58
6.7.3. DISADVANTAGE AND DISCRIMINATION 59
6.7.4. COVENANTS 59
6.8. PURCHASING MARKET 60
7. STRATEGIES, INITIATIVES AND GOOD PRACTICES 62
7.1. INTRODUCTION 62
7.2. BIG CITIES POLICY 63
7.4. HOUSING DISTRIBUTION 65
7.5. CONFLICT MEDIATION 67
8. SUMMARY AND CONCLUSIONS 68
ANNEX 72
FACTS AND FIGURES 72
MIGRATION HISTORY 72
DEFINITION 74
DEMOGRAPHICS 74
PEOPLE WITH A FOREIGN BACKGROUND 82
ALIENS ACT 87
FOREIGN NATIONALS EMPLOYMENT ACT 89
NEWCOMERS INTEGRATION ACT 90
Figure 1 Proportion of rented and owner-occupied property in the
housing supply, 1986-1998 16
Figure 2 Ethnic composition of the big cities 31
List of tables
Table 1 Number of ethnic minorities by group of origin and part of the country,
per hundred thousand residents, 1 January 2001 27
Table 2 Intensity index, ethnic minorities, 1996 and 2001 (100 = proportion equal
to that within the total population) 28
Table 3 Intensity index, first and second generation ethnic minorities, 25 years
and older, 2001 (100 = proportion equal to that of the total population 25 years and older)
29
Table 4 Type of dwelling per ethnic group 33
Table 5 Number of rooms per ethnic group 34
Table 6 Percentage of complaints about housing 39
41. Executive summary
Ethnic minorities in the Netherlands are dependent to a large extent on the
subsidised rented sector, an important part of the housing market in this country.
Consequently, this will be the main focus in this report. The subsidised rented sector
makes use of a number of protection mechanisms. Another striking feature is that the
subsidised rented sector is determined by housing corporations, which usually
allocate housing on the basis of a supply system whereby dwellings are listed weekly
in the newspaper and people looking for housing can register for them. As a rule, the
person with the longest history of residence has the best chance, although allocation
can also depend on age or reaction time. It is very important that people looking for
housing adopt an active attitude. The supply system is a vast improvement over the
previous distribution system in which landlords had a great deal of control over who
came to live where. This encouraged the placing of ethnic minorities in certain
districts or blocks of flats without their having requested such a placement. People
seeking housing had much less influence on their future housing than they do in the
supply system. Another advantage of the supply system is that it is much more clear-
cut than the distribution system.
The Dutch government does not pursue any specific group policy with regard to the
housing position of ethnic minorities, although there is a certain amount of
segregation, especially in the West and in the big cities. At the same time, the
housing situation for ethnic minorities is of lower quality on average than that of the
native population, although there are certainly no impoverished ghettos here. In the
past, landlords did attempt to adopt a distribution policy. Distribution policy in the form
of maintaining a quota (not permitting more than a certain number or percentage of
ethnic minorities in a district) was rejected by the courts, however. The main obstacle
to such a policy is its compulsory aspect. In practice, distribution did occur during the
eighties and nineties under the distribution system, and the discussion of this topic
has not yet subsided. Some political parties are great advocates of a distribution
policy, but the supply system as described above does not provide very much room
for it.
5In fact, the regulation of the Dutch housing market has resulted in little or no direct
discrimination. A great deal of improvement has also taken place with the
disappearance of the distribution in recent years and the emergence of the supply
system. Even so, indirect discrimination does exist.
The supply system can discriminate against ethnic groups indirectly if the emphasis
is placed on length of residence, because such groups have a shorter history of
residence on average than native Dutch people. As a result, ethnic minorities
sometimes get stuck in the lowest strata of the housing market. A possible
improvement might be to stress the ‘length of registration’ criterion. Income
requirements also tend to put ethnic minorities at a disadvantage, since they
generally earn less than native Dutch people. In fact, the situation concerning
housing and segregation is mainly a socio-economic problem. Some consolation can
be found in the system of individual rent subsidies, by which those with somewhat
lower incomes can allow themselves slightly more expensive housing because they
receive a monthly housing subsidy.
A consequence of segregation in certain districts is the black schools, schools in
which the vast majority of the students are ethnic minorities. These schools are not
necessarily of lower quality than the non-black schools, but it is a fact that among the
weakest schools in the country there are more black than non-black schools.
Segregation results in reduced opportunities for ethnic minority young people so they
end up in a vicious circle as far as future opportunities, housing district and jobs are
concerned.
In neighbourhoods that are more or less segregated there have also been conflicts
down through the years, with discrimination playing a role. When neighbours become
aware of the arrival of an ethnic minority resident, they sometimes try to bar the
person by means of actions and petitions. Often the move never takes place. In a
case in Utrecht in 1989, a complaint was made by a future ethnic minority resident
concerning the inadequate efforts of the police and the Public Prosecution Service to
deal with this kind of action that had been directed against him. Finally the complaint
was taken to the CERD Committee of the United Nations. This Committee supervises
compliance with the Convention on the Elimination of all forms of Racial
Discrimination (1967), signed by the Netherlands, which requires member states to
6resist all forms of discrimination. The Committee decided that the Dutch government
should take more active measures against neighbours who discriminate in these
kinds of cases.
Reports have also come in of ethnic minority residents being hounded out of the
neighbourhood and forced to move. Sometimes the neighbours become violent:
bricks are thrown through windows, small fires are started and car tyres punctured.
Lawsuits having to do with the allocation of dwellings, the distribution policy or
neighbourhood disputes occur only sporadically. But the Equal Treatment
Commission, which provides citizens with a low-threshold forum, deals regularly with
such cases. No lawyer is required and the procedure is free of charge.
In addition to the rental of full residential units, the rental of rooms is also a feature of
the Dutch housing market. There is little information on the national level concerning
the disadvantages and discrimination that young people from ethnic minorities must
deal with in the room-rental market. This is a subject that deserves further study.
As far as good practices are concerned, it should be noted that solutions are being
found for neighbourhood disputes. Projects in the context of neighbourhood
management, including arbitration between quarrelling parties, are very successful.
More social cohesion is being introduced. An example of this is the Moroccan fathers
in Amsterdam who deal with the behaviour of Moroccan young people there.
The government has been occupied for quite some time with the situation in the
country’s big cities in the context of the Big Cities Policy. This policy is aimed at
improving the competitive position of 25 big cities by means of a coherent approach
involving physical, social and economic goals. One of the components of the Big
Cities Policy is urban renewal, which is subsidised by the government and which
focuses in part on diversity. By building more expensive homes in urban renewal
areas, attempts are made to attract residents with greater financial leeway – at the
same time emphasising the importance of supportive measures so that urban
renewal areas can also be equipped with a wide range of facilities. There is also
public housing in the better districts. The goal is a distribution of population groups
7without any compulsion; the main thing is that choices remain voluntary. Besides this,
construction is focusing on the multicultural nature of the population so that the
specific wishes of particular groups (such as the Mediterranean nationalities) can be
met.
It can be concluded that there is little or no discrimination taking place in the
Netherlands. There is a certain measure of segregation, although there are no
ghettos. Another problem consists of racially motivated neighbourhood disputes, but
hard work is being done on many different levels to improve the situation, at both the
government and the district level. It is recommended that the Netherlands continue
along this path. The supply system, which is how housing is distributed today as a
rule, is sometimes indirectly discriminatory and in this respect is in need of
adjustment. The allocation criteria should be studied to see whether they can be
formulated in a more objective way.
82. Glossary
Concentration: relatively high percentage of ethnic minorities within a particular
district.
Discrimination: any distinction, exclusion, restriction, or preference that has the
purpose or effect of nullifying or impairing the recognition, enjoyment or exercise on
an equal footing of human rights and fundamental freedoms in the political,
economic, social, cultural or any other field of social life. Discrimination is either direct
(a) or indirect (b).
a) direct discrimination: discrimination between persons on the grounds of religion,
belief, political opinion, nationality, race, sex, heterosexual or homosexual orientation
or civil status;
b) indirect discrimination: discrimination on the grounds of other characteristics or
behaviour than those meant under (a), resulting in direct discrimination.
Distribution: spreading of ethnic minorities and native people over different areas, the
aim being to attain as proportionate a population as possible; can be compulsory or
voluntary.
Employed labour force: Person aged 15-64 working at least 12 hours a week.
Ethnic Minority: see Non-Western foreign background. For the purposes of this
report, persons belonging to ethnic minority groups are defined as people born in, or
of whom at least one parent was born in, Africa, Asia (excluding Japan and former
Dutch East Indies and Indonesia), South America and Turkey. The largest groups are
Moroccans, Turks, and people from Suriname and the Netherlands Antilles/Aruba.
First- and second-generation foreigners: Persons are considered to have a foreign
background if at least one parent was born abroad. A distinction is made between
persons born abroad (first generation) and persons born in the Netherlands (second
generation). The foreign background is determined by the country of birth of the
person (first generation) or the country of birth of the mother (second generation). If
the mother was born in the Netherlands, the person is classified according to the
father's country of birth.
9Gross labour participation: Labour force as a percentage of the population (15-64
years).
Housing corporation: private institution (foundation or association) whose exclusive
goal is to work in the area of public housing and as such are authorised by the
Crown.
Labour force: The labour force (15-64 years) includes:
- persons who work at least 12 hours a week;
- persons who have accepted work for at least 12 hours a week;
- persons willing to work at least 12 hours a week, who are available and
actively seeking work for at least 12 hours a week.
The employed labour force includes all persons working at least 12 hours
a week.
The unemployed labour force includes all persons unemployed or working
less than 12 hours a week.
Labour position: Classification of the population aged 15-64:
- employed labour force,
- unemployed labour force,
- persons not included in the labour force.
Net labour participation: Employed labour force as a percentage of the population
(aged 15-64 yrs).
Non-Western foreign background (Du.: Niet-westerse allochtoon): People born in, or
of whom at least one parent was born in, Africa, Asia (excluding Japan and former
Dutch East Indies and Indonesia), South America and Turkey. The largest groups are
Moroccans, Turks, and people from Suriname and the Netherlands Antilles/Aruba.
Reference to this term is made in connection with statistical data compiled by the
Central Statistical Agency.
Percentage unemployed: Unemployed labour force as a percentage of labour force
(15-64 yrs).
Persons with a foreign background (Du.: allochtoon): Persons are considered to have
a foreign background if at least one parent was born abroad. A distinction is made
10between persons born abroad (first generation) and persons born in the Netherlands
(second generation). The foreign background is determined by the country of birth of
the person (first generation) or the country of birth of the mother (second generation).
If the mother was born in the Netherlands, the person is classified according to the
father's country of birth.
Refugee: Person residing in the Netherlands on the basis of a permanent residence
permit issued on the basis of recognition as a refugee, according to the Geneva
Convention.
Segregation: cluster formation of ethnic minorities within certain areas.
Self-employed: Persons working in their own business or practice; persons working in
their partner's or parents' business or practice; other self-employed, e.g. freelancers.
Unemployed labour force: Persons who have accepted work for at least 12 hours a
week, or are willing to work at least 12 hours a week, who are available and actively
seeking work for at least 12 hours a week.
Western foreign background (Du: westers allochtoon): People with a European
background (excluding Turkish), North American, Oceanic, Japanese or Indonesian
(including persons from the Dutch East Indies).
113. Introduction
In collecting and analysing data on the position of minorities in housing, and
pinpointing the possible discrimination that may play an attendant role, a large
number of sources were tapped.
First and foremost, an extensive study was carried out of the most relevant recent
literature in this area from the years 1998 until now. This involved not only
government publications but also relevant studies carried out at various Dutch
universities. Second, sources were consulted for statistical information. One such
source consisted of a number of databases that are usually used for research
purposes. An example of this is the data available from the Central Statistical Agency
-Statistics Netherlands- (Centraal Bureau voor de Statistiek; CBS). This agency
collects statistical data on the Dutch population, including demographic and
economic data. The statistics collected by the CBS are used in research, but they
can also be consulted directly via the website or helpdesk. The CBS is therefore the
source for a few of the figures used in this document. In general it does not provide
specific data about housing and minority groups, so that its information is limited.
Graphs and tables have been taken from other sources such as the literature
mentioned above. Some of the data comes from the research on Social Position and
Use of Services by Ethnic minorities-98. A more recent study has not yet been
published.
Data on discrimination in housing are scanty. Information has been derived from
organisations involved in dealing with complaints of discrimination: the anti-
discrimination agencies. These agencies maintain registries with separate notations
indicating whether the complaint took place within the housing system. The rulings of
the Equal Treatment Commission have been studied as well. Complaints concerning
housing can also be lodged with this Commission. Although few in number, such
complaints do come in. Both organisations present their annual statistics in annual
reports, which were used for this report.1 Finally, use was also made of the inventory
1
Landelijke Vereniging van Anti Discriminatie Bureaus en Meldpunten [National Federation of Anti-Discrimination Agencies and
Hotlines, or LVADB], (2001) Kerncijfers 2000 [Annual report 2000] The Hague: LVADB.
LVADB. (2002) Kerncijfers 2001 [Annual report 2001] The Hague: LVADB.
LVADB. (2003) Kerncijfers 2002 [Annual Report 2002] Amsterdam: LVADB.
12and analysis of complaints of discrimination in this area that were part of the Racism
and the Extreme Right monitoring project.2
The sources reveal that the housing market in the Netherlands is subject to strong
government regulation. In the present report, chapter 4 will provide a description of
how the Dutch housing market functions, both in theory and in practice. The
subsidised rented sector is of great importance, especially for ethnic minorities. In the
past a housing allocation system was mainly used, which gave landlords a great deal
of room to accept or reject people seeking to rent living space (the distribution
system). Today, however, a transparent system is commonly used in which those
with the longest record of residence, whether native or ethnic minority, have the first
right to a dwelling for which they must register (the supply system). The supply
system is less sensitive to discrimination that the distribution system, but it has only
been in force for about ten years. Chapter 5 explains what kind of effect the
allocation policy had on ethnic minorities over time. To a certain extent segregation
does exist, especially in the big cities of the West, while the quality of the dwellings
leaves much to be desired relatively speaking. There are no ghettos in the
Netherlands, however, nor is there any serious impoverishment. For various reasons,
some municipalities have developed a distribution policy with the intention of
attaining a proportionally composed population within their borders. Such a
distribution policy has been rejected by the courts, however. Chapter 6 will focus on
the discriminatory aspects within the housing department. A distinction is made
between discrimination in the allocation of housing, discrimination in connection with
the distribution policy, and the discrimination that plays a role in neighbourhood
disputes. In the allocation of housing, the criterion of length of residence mentioned
above in regard to the supply system is indirectly discriminating to ethnic minorities
because they usually have a shorter residential history than native Dutch people.
According to the courts, the distribution policy places an accent on ethnic origins and
has therefore been forbidden. And ethnic minorities often have to move because they
are being terrorised by their neighbours. Finally, this chapter will take a look at the
T. Loenen (ed.). (2001) Gelijke behandeling: Oordelen en commentaar 2000. [Equal Treatment: Judgements and comments 2000]
Utrecht: CGB. De Wolff, D.J.B. (ed.). (2002) Gelijke behandeling: Oordelen en commentaar 2001. [Equal Treatment: Judgements
and comments 2001] Utrecht: CGB.
2
J. van Donselaar and P.R. Rodrigues (2002) Monitor racisme en extreem rechts; vijfde rapportage. [Monitor on racism and the
extreme right; fifth edition]. Amsterdam/Leiden: Anne Frank Stichting /University of Leiden.
13discriminatory aspects of the room-rental market in the Netherlands and at
discrimination in the purchasing market, which does not play a large role, however.
Chapter 7 will examine the many good initiatives being carried out in the Netherlands,
including the Big Cities Policy with the attendant urban renewal and neighbourhood
management. Neighbourhood mediation also plays a significant, positive role in the
Netherlands. Chapter 8 provides summaries and conclusions.
J. van Donselaar and P.R. Rodrigues (2001) Monitor racisme en extreem rechts; vierde rapportage. [Monitor on racism and the
extreme right; fourth edition]. Amsterdam/Leiden: Anne Frank Stichting /University of Leiden.
144. Legislation and policies
4.1. Introduction
This chapter is primarily devoted to examining the housing market in the Netherlands
in general. It will begin with a discussion of the legislation that controls this market
and then look at how this legislation works in practice (housing allocation). This will
be followed by a glance at the specific legislation aimed at discouraging
discrimination in the housing sector. The chapter will end with an outline of the
government’s policy with regard to discrimination against ethnic minorities in the
housing market.
4.2. Brief historical sketch
The Dutch government had become involved in construction and housing even
before 1851. Building regulations were laid down that usually had to do with public
safety (often fire safety) and health, but they still tended to be based on purely
economic considerations. The 1901 Housing Act established a legal basis for quality
control and quality testing in public housing. In the years after the Second World War,
the government made decisions that were aimed at helping find housing for as many
people as possible despite the post-war housing shortage. This shortage made it
necessary to pass measures concerning housing distribution. Ceilings were put on
rents, for example, and the option to terminate tenancy was limited. As we shall see,
these kinds of regulations are still in force. There is strong government involvement in
the Dutch housing market, which can be explained by looking at the past.3
4.3. Legislation
4.3.1. Public housing legislation
In the Netherlands there are a number of laws in force in the area of housing. These
are laws having to do with housing in general: the Housing Act, which contains many
regulations governing not only building construction but also concerning the
institutions involved in renting to the weaker members of society. This Act is worked
out in greater detail in the Subsidised Rented Sector Management Decree and the
Housing Allocation act, which make sure that municipalities are able to regulate the
distribution of housing within their city limits. There is also more specific legislation
3
C.A. Adriaansens and A.Ch. Fortgens, Volkshuisvestingsrecht[Public housing law], Deventer: Kluwer, 2000, pp 1-18.
15that covers the renting of living space: first the Civil Code, which lays down the
obligations of tenants and landlords in a general sense; then the Rent Act,4 the
Residential Tenancies Rent Act, the Rent Decree and the Rent Allowance Act, with
the accompanying Rent Allowance Decree.
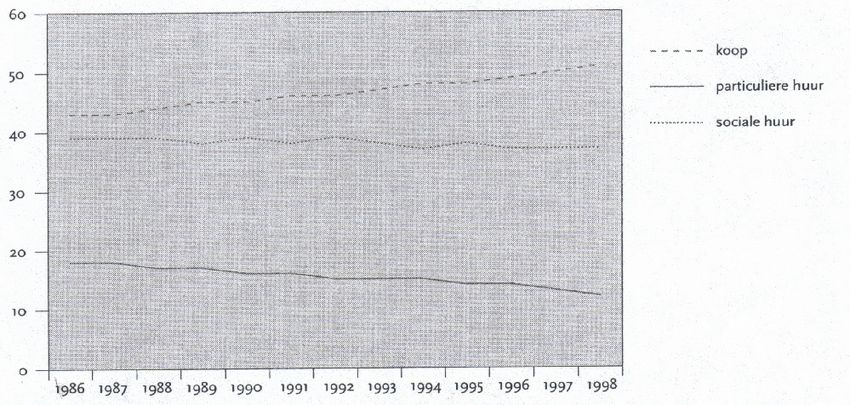
In the opinion of the DUMC, this list makes it clear that a great deal of attention is
being paid to home rental. This is not very surprising, since home ownership in the
Netherlands, while it has steadily grown, occupies much less of the housing market
than in other European countries. Figure 1 shows the proportion of rented and
owner-occupied property in the housing supply between 1986 and 1998.
Figure 1 Proportion of rented and owner-occupied property in the housing
supply, 1986-1998
owner-occupied
private rental
subsidised housing
source: CBS/DGVH-bewerking
Source: Ministry of Housing, Spatial Planning and the Environment, Policy Document on the
Evaluation of Public Housing in the Nineties, www.vrom.nl, July 2003, p. 38
In the four big cities there is even less owner-occupied property; the number of
owner-occupied dwellings there is only 25%, and in Amsterdam only 14%.5 In the
following sections of this report the accent will be placed on rental because ethnic
4
The Rent Act is not of importance to the subject at hand. This act has existed since 1950, but more and more items have been
transferred to the Civil Code so that the Rent Act is now only relevant to home offices, garages, warehouses, studios, etc. For this
reason, this act is being left out of this discussion.
5
Ministry of Housing, Spatial Planning and the Environment, Nota Wonen, mensen, wensen, wonen [policy document on Housing,
People and their Needs], Lower House, 2000-2001, 27 559, no. 1, p. 11.
16minorities live in rented dwellings for the most part, often concentrated in the big
cities.6
4.3.2. The Housing Act and Subsidised Rented Sector Management Decree
The government is intensively involved in regulating the housing market. The
Housing Act, for instance, allows for the setting up of institutions that act on behalf of
public housing: housing corporations. These corporations find housing for people
with a preference for those who, on account of their income or other circumstances,
have difficulty finding suitable housing. By renting out dwellings that are under their
management at relatively low rentals, the housing corporation gives as much
preference as possible to people looking for housing who, considering their income,
are especially suited for those dwellings. In principle these institutions are under the
supervision of the Minister of Housing, Spatial Planning and the Environment.
Housing corporations have existed for more than a century. They developed from
private initiatives aimed at improving the dreadful living conditions of the country’s
workers. They are companies governed by private law and having a social function
that, within the framework of the Housing Act, has been further elaborated in the
Subsidised Rented Sector Management Decree. After 1945, the housing
corporations in the rental sector grew to become the primary means by which public
housing is arranged.7 The corporations have built 2.4 million good and affordable
rental dwellings over the years, about 40% of the total housing supply in the
Netherlands. The construction of public housing offers quality in more ways than one.
The dwellings are generally solidly built and well maintained for the most part. They
are affordable. And unlike in other countries, the rental sector is not a form of poor
relief, in the opinion of the DUMC.
In the past, candidates for subsidised dwellings in many municipalities with a tight
housing market were recommended by the municipality itself, and the corporation
had less of a say. Today, most of the municipalities have transferred the work of
6
P.T.M. Tesser et al. (1995) Rapportage minderheden 1995, Concentratie en segregatie [Report on minorities 1995, Concentratin
and segregation], Rijswijk: Sociaal Cultureel Planbureau, p. 425.
7
J. Janssen and K. Nagel (1991) Woningcorporaties: meer dan een huisbaas? Een onderzoek naar de dienstverlening van
woningcorporaties [Housing Corporations: More than a landlord? A study of the services supplied by housing corporations], The
Hague: Konsumenten Kontakt
17housing distribution to the corporations. Since 1995, when the corporations were put
on their own two feet, they became even more independent.8
4.3.3. Housing Allocation Act
The housing corporations do have to take the Housing Allocation Act into account,
which stipulates that municipalities may lay down certain requirements applicable to
those who want to settle within the city or town limits by means of a housing
ordinance that governs housing permits. In such ordinances, housing space must be
distributed in a balanced and fair way. Municipalities usually require economic or
social ties with the municipality when property is sold below a certain price or rented
below a certain rental. The goal is that when dwelling space is put to use at a
relatively low price, preference be given to housing-seekers who, on account of their
income, are especially suited to that dwelling. Such an ordinance is now in force in
25% of the country’s municipalities, most of which are in urban areas. Generally
speaking, what this boils down to is that a permit is required if the basic rent of a self-
contained accommodation is below 541.36 euros. A person qualifies for such an
accommodation if his or her yearly income is no more than 27,000 euros.9
4.3.4. Rent Allowance Act and Rent Allowance Decree
When a dwelling is allocated, the Rent Allowance Act and the Rent Allowance
Decree are also taken into account. These should be appealed to as little as
possible. These laws and regulations are meant to assist renters who live in a
situation in which the accommodation is too expensive relative to their income but in
which rent limits and income limits have been established. The dwelling space must
be appropriate. The rent may not drop below 172.80 euros in any case, nor rise
above 585.24 euros. The maximum income was set between 16,275 and 24,575
euros in 2002, with the possible addition of a small amount of property.10 More than 1
million households make use of this regulation.11 Since the eighties, this group has
included a steadily growing group of ethnic minority households.
8
www.aedes.nl.: Wat zijn woningcorporaties? [What are housing corporations?], July 2003.
9
www.Vrom.nl: Housing permit dossier, July 2003
10
Volkshuisvesting, Ruimtelijke Ordening en Milieu brochure: Huursubsidie 2003-2004, Wanneer kunt u huursubsidie krijgen?
[brochure issued by Public Housing, Spatial Planning and the Environment: Rent Subsidies 2003-2004, When can you get a rent
subsidy?]
11
Volkshuisvesting, Ruimtelijke Ordening en Milieu, Nota Mensen, wensen, wonen, [Public Housing, Spatial Planning and the
Environment, policy document on Housing, People and their Needs] Lower House, 2000-2001, 27 559, no. 1, p.18.
184.3.5. Civil Code
The rights and duties of landlords and tenants are laid down in the Civil Code. The
tenant must take good care of the dwelling he occupies and pay the rent. Rather far-
reaching tenant protection is also important, that is, tenants should be protected from
termination of the rental agreement by cancellation on the part of the landlord.
Cancellation is only possible in very exceptional cases, such as ‘urgent private use’.
The tenant protection is so extensive it even protects a tenant from being evicted if
he starts earning too much money, even though he was admitted to the subsidised
housing sector in the first place on the basis of his salary. He cannot be put out of the
subsidised housing sector.
Furthermore, the subsidised housing sector only works if the rents are controlled or
restrained. If sizeable rent increases take place on a regular basis, the goal of the
subsidised public housing policy will be surpassed. So tenant protection goes hand in
hand with rent control.12 This is where the Residential Tenancies Rent Act comes in,
as well as the decree that is based on this act. In August 2003 the act will be
repealed, but the regulations will be transferred to the Civil Code while the procedural
questions will be laid down in Residential Tenancies Rent Implementation
Legislation. People will still be able to acquire a dwelling on the basis of number of
points, and reasonable prices will be established, including service costs and the
like.13
Legislation such as that described above is what regulates the Dutch housing market.
There is a large, high-quality subsidised housing sector in which housing
corporations play an important role. These housing corporations still have to take into
account any demands that the municipality might pose. The rent subsidy regulations
and rent control are beneficial to low-income people seeking accommodation. In
addition, tenant protection means that people do not have to be afraid of being
tossed out of their homes.
12
Zuidema, Tj. (2001) Recht voor de huurder [Tenant’s rights], Lelystad/ The Hague: Koninklijke Vermande, pp. 147-153.
13
R.A. Dozy and Y.A.M. Jacobs (1999) Hoofdstukken Huurrecht voor de praktijk [Chapters on tenant’s rights for the trade], third
printing, Gouda: Gouda Quint, pp. 251-339.
194.3.6. Equal Treatment Act
The Equal Treatment Act plays a role in the struggle to overcome discrimination.14
The Equal Treatment Act, or ETA, has been in force since 1994. Its scope is not only
the housing sphere; it also covers employment, education, and the provision of
goods and services. The ETA regulates discrimination perpetrated on a number of
grounds: besides race and ethnic origin, it covers religion, belief, political opinion,
nationality, heterosexual or homosexual orientation and civil status. It may be noted
that two grounds mentioned in the Framework Directive 2000/78/EC, handicap and
age are not included. Separate legislation is being developed for these, and for the
time being they will not be part of the ETA.
The ETA is a so-called closed system: there is a general prohibition of unequal
treatment. Exceptions are only possible if they are explicitly mentioned in the Act.
According to the ETA, both direct and indirect discrimination are prohibited, although
objective justifications may exist for indirect discrimination. These justifications are
the same as those applied by the European Court of Justice in gender case law: the
unequal treatment serves an objectively justified goal; the chosen measures are
appropriate and necessary to reach this goal and the goal cannot be reached
otherwise.
The ETA is supervised by the Equal Treatment Commission (Commissie Gelijke
Behandeling, or CGB), a semi-judicial body. The Commission’s main task is to
investigate private complaints and to rule on whether the provisions of the ETA were
violated.
The rulings of the Commission are non-binding. The reason for the choice for a non-
binding status was that the Commission was intended to be easily accessible for
persons complaining about discrimination. If the Commission had been given the
status of a court, it would not have been able to play an active role in the
proceedings, such as informing the victim of his or her rights. In the event that a
ruling by the Commission is not followed, the victim or the Commission itself can
present a case in a civil court and claim his or her rights.
14
This section was adapted from: D.C. Houtzager (2001) Equal Treatment in The Netherlands, in M. Miguel Sierra and K. Romberg
(eds.) From Principle to Practice – evaluation of legislation dealing with racial and ethnic discrimination in certain EU Member
States, Brussels: European Network Against Racism.
20Changes in the ETA were proposed in 2003 in the context of the implementation of
the EC Directive 43/2000 concerning equal treatment on the basis of race and
ethnicity. The government presented the relevant proposals to Parliament on 28
January 2003.15
4.4. Housing allocation in practice
4.4.1. Introduction
What follows is a closer look at the practical aspects of housing allocation.
4.4.2. Distribution model
For many years, the so-called distribution model was used in the distribution of living
accommodations, at least in non-liberalised areas (generally speaking, the Randstad,
or the western conurbation, and urban areas elsewhere). There are several variations
of this system, but most models contain the following characteristics:
- If a household wants to rent a subsidised dwelling, it must register with a
Foundation for Housing Distribution, a cooperative partnership formed by the
municipality and the housing associations in the city. The household's characteristics
as well as its particular demands (such as price, neighbourhood, type, size) are
included on the registration form.
- The household makes an appointment with a housing officer. At this meeting the
housing demands are discussed.
- The allocation of a dwelling depends on the number of ‘points’ accumulated. A
household receives two points for every month it is registered. A starter receives 24
points on joining. Urgency can also play a role.
- When a dwelling becomes vacant, it is offered to the household with the highest
number of points (that is, the household at the top of the waiting list).
- Sequence is not the only criterion, however. Three suitability criteria also come into
play: the relationship between household size and housing type, the relationship
between income and the price of the dwelling, and suitability in terms of liveability
and ties with the neighbourhood. This last criterion in particular makes it possible for
housing officers to select on the basis of other characteristics than income or size of
households. In this respect the system makes it possible for landlords to employ a
15
The Netherlands, Parliamentary Documents II, 2002/03, 28 770.
21placement policy in which ethnic minorities are placed (or not placed) in particular
blocks of flats, streets or districts.
4.4.3. Supply model
The distribution model is becoming less and less fashionable. In 1989 the city of Delft
was the first to use the so-called supply model. Many municipalities have adopted
this model and adapted it to their local situation. Housing associations in a
municipality may join in following this model. Landlords publish housing
advertisements in a weekly newspaper delivered to every address in the city. The
procedure is often as follows:
- A household looking for a home must first register. Anyone aged eighteen years or
older is eligible to do so. Registration is free. Registration with one association
implies registration with the other associations.
- A house-seeker is expected to react to the advertisements in the weekly
newspaper. Households may apply no more than once a week. If a household does
not apply, it will never be offered a dwelling.
- The newspaper descriptions provide information about the type of dwelling, the floor
on which it is located (in the case of flats), the year it was built, the rent, service
costs, the target group (for example, above a certain age), the maximum number of
persons, the required income of the prospective tenants, and the name of the
housing corporation that owns the dwelling.
- Should there be several candidates for one dwelling (as is usually the case),
sequence criteria come into play. These criteria are familiar to everybody. In the case
of starters, the starter who has been registered the longest gets the offer; sometimes
age is used as a criterion. In the case of transfer households, the duration of the stay
in the present dwelling is the important factor. The longer one has lived in one’s
present dwelling, the greater the chance of finding a new one.
- Two suitability criteria play a role. The housing corporations offer the least
expensive dwellings to the households with the lowest incomes, and the size of the
dwelling is related to the size of the household. This information is made clear in the
advertisement. The present income of the household is crucial.
22In July 1995, 144 municipalities used this model. In 2000, it was estimated that 80
per cent of all municipalities were using the supply model.16
4.4.4. Comparing the distribution model and the supply model
The expectation is that under the supply model households eventually end up in
dwellings and neighbourhoods that are more in keeping with their own wishes,
because, unlike the distribution model, people are not made to wait passively under a
supply model.17
The DUMC believes that the supply system is more transparent than the distribution
system. There is less room for discrimination; more than 60% of the country’s
municipalities and almost 60% of the corporations agree with this assessment.18 In
the distribution system, the municipalities or housing corporations have the freedom
to look at individual cases to see whether or not they want to place someone in a
particularly dwelling. Although a distribution policy with a maximum number of ethnic
minority inhabitants per district, complex, street or block of flats was not legally
permissible, theory proved weaker than practice. Under the motto ‘careful placement
policy’ and the effort to attain ‘a balanced population’, the ethnic background of
housing-seekers played a role right through the nineties. ‘Placement policy’ refers to
a special form of housing allocation policy. Accepted criteria such as income, size of
household and urgency were deemed insufficient by some landlords. They wanted to
allow more subjective factors to play a role, such as the way of life and lifestyle of the
housing-seeker and the housing culture in the neighbourhood. Often, implicitly or
explicitly, a connection was made with the ethnic origins of the housing-seeker and
the ethnic composition of the district or street. The distribution policy is tainted by the
risk of arbitrariness and discrimination,19 as was demonstrated in practice in Tilburg,
where a housing corporation held up ‘lifestyle’ as a criterion. According to some
16
R. van Kempen and M. Idamir (2003) Housing Allocation and Ethnic Minority Groups: the Effects of Different Housing
Allocation Models on Moroccan Households in Two Dutch Cities, to be published in Journal of Housing and the Built Environment.
17
Ibid.
18
J. Jansen (2000), Ergens anders onderdak, Een geschiedenis van opvang en huisvesting van immigranten in Nederland, 1945-1995
[Seeking shelter, A history of the reception and housing of immigrants in the Netherlands, 1945-1995], Leiden: University of
Leiden, pp. 110-115.
19
C.A. Tazelaar (2000) Huisvesting [Housing], in J.E. Overdijk-Francis et al. (eds), (1984-…) Handboek Minderheden [Minorities
handbook], Houten: Bohn Stafleu Van Loghum, The Hague: SDU Uitgevers/Koninklijke Vermande, (loose-leaf), p. 6/1-1050-5.
23people in public housing, this suggests that ‘the migrant’ has a deviant lifestyle by
definition.20
In the supply system, however, the rules are firmly established and verifiable. Usually
an indication is given as to who is eligible for a certain dwelling and on what grounds.
In this way, anyone who is discriminated against can take action. In fact, the DUMC
believes there is no longer any place for a local distribution or placement policy
maintained by municipalities or housing corporations.
Even so, illegal discrimination can still occur within the supply system. To illustrate
this, here is a complaint that was lodged with one of the Anti-Discrimination
Agencies.
A man of Moroccan origin responded several times to advertisements in the
housing newspaper in which available dwellings are announced in his town. The
man was looking for a five-room dwelling and, according to his son, he is eligible
for such a home. The man had been registered for a dwelling since 15-6-87. On
two separate occasions, someone who registered at a later date was given the
next available dwelling. On 19 April 2001 the man responded to an
announcement of a dwelling in Boylestraat. Through the housing newspaper of 7
June 2001 he learned that this dwelling had been allocated to someone with a
briefer registration period than his (since 9-11-92). So on 7 June 2001 the man
wrote a letter to the Rijnmond Housing Distribution Arbitration Board. He received
confirmation that his letter had been received. On 19 April 2001, the man had
submitted another a request for a dwelling on Bellstraat. Later he read in the
housing newspaper of 1 August 2001 that this dwelling had also been allocated to
someone with a briefer registration period. So he sent another letter to the same
board, dated 7 August 2001. On 24 August he received an answer from the board
in writing. He was told that the dwelling on Boylestraat had been allocated in
connected with a declaration of urgency. As for the dwelling on Bellstraat, the
board had no information. They did tell him that the questions and/or complaints
regarding this housing allocation were unfounded, since it was determined that no
20
M. Schuring (November/December 1993) De Geranium-norm in de volkshuisvesting [The Geranium Norm in housing], in
Casablanca 6, volume 2, pp. 10-11.
24rules had been broken. In the week of 27 August the man had a personal
conversation with two employees of the housing corporation in his town. There he
was told that the dwellings were not given to him because the people in the
neighbourhoods where the dwellings are located do not tolerate foreigners. One
of the employees also told him that this is why there are no ethnic minorities living
in these districts. Apparently there were ethnic minorities living there at one time,
but they were hounded out. The man was also given a map with several streets
marked. The employee discouraged the man from registering for any dwellings in
these streets since his father would not be eligible for them because he is an
ethnic minority. The man went to look in the districts and told the Anti-
Discrimination Agency that there was an entire multicultural population in the
Bellstraat district. He also told them he thought the employee’s remarks were
highly discriminatory.21
The supply model is so transparent that, according to research carried out among
Moroccans in two cities, Breda and Eindhoven, 90% of this group understand the
system, while only a third of this group understood the distribution system.22 It is true
that older Turks and Moroccans have trouble assessing their chances through the
newspaper and with filling in the weekly or bi-weekly housing forms to report for a
certain dwelling.23 Every aspect of the supply model, however, is a vast improvement
over the distribution model, according to the DUMC.
4.5. Policies
4.5.1. Policy document on housing, people and their needs
In the policy document on Housing, People and their Needs, the Ministry of Housing,
Spatial Planning and the Environment formulated a framework for national
government policy concerning housing in the 21st century. The document reveals
that no specific target group policy aimed at such issues as improving the position of
21
Klachtendatabase van de Rotterdamse Anti Discriminatie Raad [Complaints database of the Rotterdam Anti-Discrimination
Council], no. 431-01.
22
R. van Kempen and M. Idamir (2003) Housing Allocation and Ethnic Minority Groups: The Effects of Different Housing
Allocation Models on Moroccan Households in Two Dutch Cities, to be published in Journal of Housing and the Built Environment.
23
J. Jongerden in cooperation with Osmose (2000) De gedeelde stad, Een case-study naar woningaanbodsystemen en differentiatie
binnen wijken in Apeldoorn, Arnhem en Nijmegen [The divided city, A case study of housing supply systems and differentiation in
districts of Apeldoorn, Arnhem and Nijmegen], Arnhem: Osmose, p. 20.
25ethnic minorities is being carried out.24 The Ministry is attempting to follow a
consumer policy in which the citizen is to be more intensively involved in the
planning, design and furnishing of the dwelling and the housing environment, and at
an earlier point in time.
4.5.2. Letter on segregation
In a letter to the Lower House dated 9 January 2003, the Minister of Housing, Spatial
Planning and the Environment and the Minister of Alien Affairs and Integration came
out against segregation. They want to discourage the growth of districts with one-
sided populations by offering a more varied supply of dwellings and by following a
policy that creates more opportunities to find a place in the housing market for people
seeking accommodation.25
24
Ministry of Housing, Spatial Planning and the Environment, Policy document on Housing, People and their Needs.
25
Lower House, 2002-2003, 28 612, no. 3.
265. Description and analysis
5.1. Minority groups and housing - density
5.1.1. Data
Seen in geographical terms, ethnic minorities are unequally distributed throughout
the Netherlands. They live more in the west, and partly in the south, than in the north
or the east of the country (see Tables 1, 2 and 3).
Table 1 Number of ethnic minorities by group of origin and part of the country,
per hundred thousand residents, 1 January 2001
North East West South Total in the
Netherlands
Ethnic 9216 13818 22740 15 907 17 953
minorities
Non-Western: 3 669 6 424 13 429 5 870 9 277
Turkey 412 2 043 2 574 1 495 1 999
Suriname 624 933 3 309 588 1 932
Morocco 262 775 2 640 1 230 1 706
Neth. Antilles/ 400 474 1 038 490 732
Aruba
Iraq 284 277 254 148 239
China 167 176 236 171 202
Somalia 143 127 206 217 185
Afghanistan 159 160 170 162 165
Iran 127 142 189 105 154
Western: 5 546 7 394 9 312 10 037 8 676
Indonesia 1 610 2 318 2 985 2 188 2 526
Germany 1 922 2 784 1 856 3 842 2 494
Belgium 136 230 648 1 559 707
Former 432 365 492 436 447
Yugoslavia
Source: Central Statistical Agency (2002) Ethnic minorities in the Netherlands 2002,
Voorburg/Heerlen: Central Statistical Agency, pp. 98-99.
27Table 2 Intensity index, ethnic minorities, 1996 and 2001 (100 = proportion
equal to that within the total population)26
North East West South
1996 2001 1996 2001 1996 2001 1996 2001
Ethnic 49 51 76 77 126 127 91 89
minorities
Non- 36 40 66 69 148 145 60 63
Western:
Turkey 21 21 104 102 129 129 73 75
Suriname 34 32 41 48 174 171 30 30
Morocco 16 15 45 45 154 155 76 76
Neth.
Antilles /
Aruba
Iraq 112 119 111 116 112 106 58 62
China 79 83 86 87 118 117 84 85
Somalia 132 77 77 69 103 111 100 117
Afghanistan 61 96 90 97 113 103 100 98
Iran 77 82 87 92 126 122 67 68
Western: 60 64 86 85 107 107 118 116
Indonesia 63 64 92 91 118 118 86 87
Germany 74 77 112 112 74 74 156 154
Belgium 17 19 31 32 90 92 226 220
Former 86 97 77 82 118 110 90 98
Yugoslavia
Source: Central Statistical Agency (2002) Ethnic minorities in the Netherlands 2002,
Voorburg/Heerlen: Central Statistical Agency, pp. 98-99.
26
For the years 1996 and 2001, ‘intensity indexes’ were calculated for the major incoming foreign groups. If a certain group is
distributed across the parts of the country in the same way as the total population, then the index figure for this group would be 100
28Table 3 Intensity index, first and second generation ethnic minorities, 25 years
and older, 200127 (100 = proportion equal to that of the total population
25 years and older)
North East West South
1st gen 2nd gen 1st gen 2nd gen 1st gen 2nd gen 1st gen 2nd gen
Ethnic 46 59 71 95 136 100 77 124
minorities
Non- 37 31 68 69 147 151 61 53
Western:
Turkey 21 19 105 108 128 126 74 76
Suriname 30 28 45 58 174 167 29 33
Morocco 15 23 46 54 154 135 76 104
Neth. 49 42 64 71 143 147 66 55
Antilles/
Aruba
Western: 59 62 76 97 119 96 102 130
Indonesia 60 61 93 91 117 122 89 80
Germany 75 75 94 123 83 71 153 152
Belgium 18 17 29 33 108 80 187 243
Former 92 59 81 68 114 113 93 121
Yugoslavia
Source: Central Statistical Agency (2002) Ethnic minorities in the Netherlands 2002,
Voorburg/Heerlen: Central Statistical Agency, pp. 98-99.
Western minorities are more strongly represented in the north and east than non-
Western ethnic minorities. This is even more the case for the south. Non-Western
ethnic minorities are located mainly in the west.
In addition, ethnic minorities are concentrated in the four big cities: Amsterdam,
Rotterdam, The Hague and Utrecht. In these cities, three out of every ten inhabitants
belong to non-Western ethnic groups. In the other municipalities with more than
100,000 inhabitants this proportion is one in ten. In the smaller municipalities it is one
in twenty.
for all parts of the country. A value higher than 100 indicates concentration within a certain part of the country; a value lower than
100 indicated underrepresentation.
27
For 2001, ‘intensity indexes’ were calculated for the major incoming foreign groups, divided into first and second generation. If a
certain group is distributed across the parts of the country in the same way as the total population, then the index figure for this group
would be 100 for all parts of the country. A value higher than 100 indicates concentration within a certain part of the country; a value
lower than 100 indicates underrepresentation.
29Approximately three-quarters of the total population of non-Western ethnic minorities
in the four big cities consist of Surinamese, Moroccans, Turks and Antilleans or
Arubans. There are large differences between the cities in the distribution according
to land of origin, however. In Amsterdam and The Hague, the Surinamese constitute
about one-third of the total number of non-Western ethnic minorities; in Utrecht this is
one-seventh. There the Moroccans are the largest group by far, with 42% of the
total.28 In The Hague and Rotterdam there are significantly fewer Moroccans. Turks
are much more evenly distributed throughout the four big cities, although their
proportion in Amsterdam is relatively low. Finally, Antilleans and Arubans are most
heavily represented in Rotterdam and The Hague (see figure 2).
28
P.T.M. Tesser , F.A. van Dugteren and C.S. van Praag speak of an overrepresentation, Report on Ethnic Minorities, 1994,
Ruimtelijke Spreiding van Ethnic minorities: Ontwikkelingen, Achtergronden, Gevolgen [Spatial Distribution of Ethnic Minorities:
30Figure 2 Ethnic composition of the big cities
Other countries
Suriname Turkey of origin
Morocco Neth. Antilles and Aruba
Source: J. Garssen and A. Sprangers, Regionale spreiding van de ethnic minorities bevolking,
Mndstat bevolking 2002/7 [Regional Distribution of the Ethnic Minority Population, Monthly Statistics
Population 2002/7 , Rijswijk: Central Statistical Agency, p. 5.
This study will mainly focus on these four big cities, home to 44% of all ethnic
minorities, while only 13% of the total population of the Netherlands live there.29
Taken as a whole, from the first to the second generation of ethnic minorities, the
concentration of non-Western ethnic minorities in the western Netherlands has
increased rather than decreased.30
Developments, Backgrounds, Consequences], Rijswijk: Sociaal en Cultureel Planbureau, pp. 39-65.
29
R. van Kempen et al. (2000) Segregatie en concentratie in Nederlandse steden: mogelijke effecten en mogelijk beleid [Segregation
and concentration in Dutch cities: possible effects and possible policy], Assen: Van Gorcum, p.13.
30
See note 5, p. 8.
31As was said earlier, the non-Western ethnic minorities are concentrated mainly in the
four big cities in the western part of the country: Amsterdam, Rotterdam, Utrecht and
The Hague. Within these cities there are also concentrated districts. Segregation is
certainly present, and is markedly stronger in Rotterdam and The Hague than in
Amsterdam or Utrecht, but it is certainly not the case that the groups distinguished
only live in a few neighbourhoods while the rest of the city is not accessible. It is also
clear that in general Turks and Moroccans are more strongly segregated than other
groups such as Surinamese and Antilleans.31
There are historical reasons for the segregation that exists. Originally, the ethnic
minorities lived mainly in boarding houses in the cities. In the first phase of their
transition from boarding house life to autonomous housing, discrimination resulted in
a concentration of ethnic minority households in the old districts of the big cities.
When subsidised housing was opened to them, the location of the available dwellings
and the practices being followed in the allocation of those dwellings contributed to the
development of substantial concentrations of ethnic minority households in the inner
cities.32 At the moment, people who earn a bit more money are moving to the new
subsidised residential districts that are being built farther outside the city, the so-
called ‘vinexlocaties’. Some ethnic minorities are disappointed when they encounter
their old neighbours in these districts, but on the whole these new districts are seen
as an opportunity to build a good life.33 Income is a very important factor in finding a
new place to live.
It is the opinion of the DUMC that the segregation phenomenon should not be
exaggerated, however. It manifests itself rather differently in each of the four big
cities. Segregation can be expressed in an index indicating what percentage of the
ethnic minorities would have to move to create a distribution in the city equal to the
distribution of the entire population. According to this index, the percentages for The
Hague, Rotterdam, Utrecht and Amsterdam are 51.0, 46.1, 35.0 and 32.5
respectively. By way of comparison: in the big cities of the United States, the indexes
for the segregation of the black population have been calculated from between 70 to
31
G. Bolt, P. Hooimeijer and R. van Kempen (2002) Ethnic segregation in the Netherlands: new patterns, new policies?, in
Tijdschrift voor economische en sociale geografie, vol. 93, no. 2, p. 215.
32
P.T.M. Tesser, F.A. van Dugteren and C.S. van Praag, Rapportage Minderheden 1994, Ruimtelijke Spreiding van Ethnic
minorities: Ontwikkelingen, Achtergronden, Gevolgen [Minorities Report 1994, Spatial distribution of ethnic minorities:
Developments, backgrounds, consequences], Rijswijk: Social and Cultural Planning Agency, p. 37.
33
J. Chorus (7 /8.06.2003) 'Zwarte vlucht' naar vinexwijk [‘Black flight’ to vinexwijk], in het NRC Handelsblad.
32You can also read