National Television and Computer Product Stewardship Scheme - Targets, trajectories and implications for Scheme design
←
→
Page content transcription
If your browser does not render page correctly, please read the page content below
National Television
       and Computer
    Product Stewardship
          Scheme
        Targets, trajectories and
     implications for Scheme design

C

        Report to the Department of
     Sustainability, Environment, Water,
        Population and Communities

                 July 2011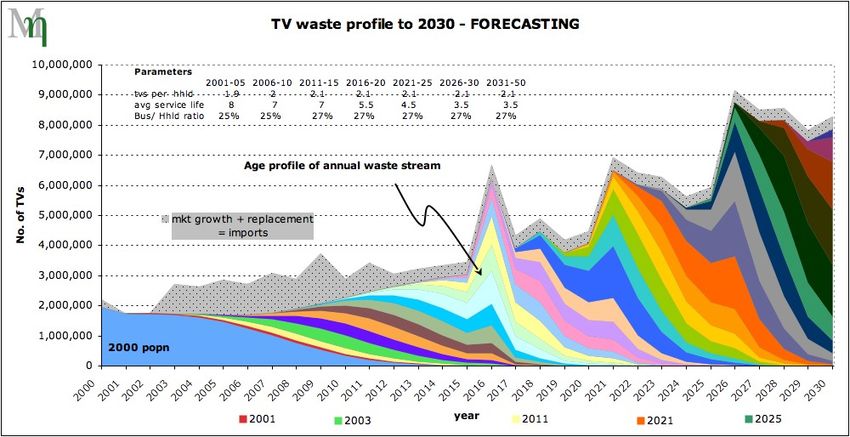
META ECONOMICS CONSULTING GROUP PTY LTD
                                    A.B.N. 50 143 853 123

      metá - (prefix): sense of change of position or condition,
      behind or after, beyond, of a higher order …

      CLIENT DISCLAIMER: The views and opinions expressed in this publication are
      those of the author and do not necessarily reflect those of the Australian
      Government or the Parliamentary Secretary for Sustainability and Urban Water.

      While reasonable efforts have been made to ensure that the contents of this
      publication are factually correct, the Commonwealth does not accept responsibility
      for the accuracy or completeness of the contents, and shall not be liable for any loss
      or damage that may be occasioned directly or indirectly through the use of, or
      reliance on, the contents of this publication.

      Contact:
      Meta Economics Consulting Group Pty Ltd
      PO Box 47
      Jamison Centre ACT 2614

      Email: contact@metaeconsult.com.au
      Web: www.metaeconsult.com.au

      Disclaimer: Meta Economics Consulting Group Pty Ltd strives to ensure the
      accuracy and value of information contained in its reports and other analysis.
      However, due to the subjective and incomplete nature of some information, and
      changing knowledge, valuations and perspectives, readers should apply their
      own judgement with respect to the analysis and advice offered in this report.
      Meta Economics Consulting Group Pty Ltd offers no warranties with respect to
      the information and analysis contained herein, or the outcome of decisions
      taken on the basis of that information or analysis.

      © Meta Economics Consulting Group, 2011

META ECONOMICS CONSULTING GROUP                      ii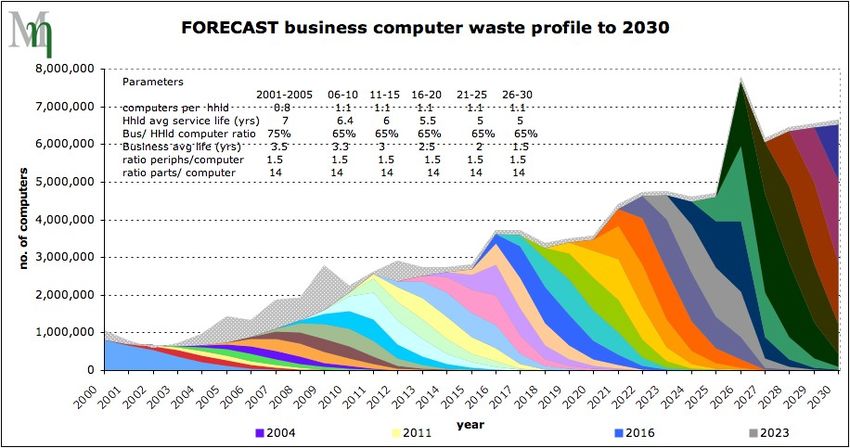
Contents
          Executive summary ________________________iv
      Chapter 1
          Design issues for TV & computer stewardship ____ 1
           1.1 Policy background __________________________________ 1

      Chapter 2
          Calculating waste generation _________________ 4
           2.1 How much waste? __________________________________ 4
           2.2 Televisions ________________________________________ 5
           2.3 Computers _______________________________________ 13
           2.4 Stockpiling — incidence and implications _______________ 19
           2.5 Implications for target setting ________________________ 20

      Chapter 3
          Target trajectories ________________________ 23
           3.1 Product target shares_______________________________ 23
           3.2 Target trajectories _________________________________ 25

      Chapter 4
          Flexibility arrangements ____________________ 30
           4.1 A 3 year moving average waste estimator ______________ 30
           4.2 Carryover provisions________________________________ 30
           4.3 Grouped and third party compliance ___________________ 30
           4.4 Contingency fund __________________________________ 31

      Chapter 5
          Conclusions: Scheme targets and approaches ___ 33
      .

META ECONOMICS CONSULTING GROUP            iii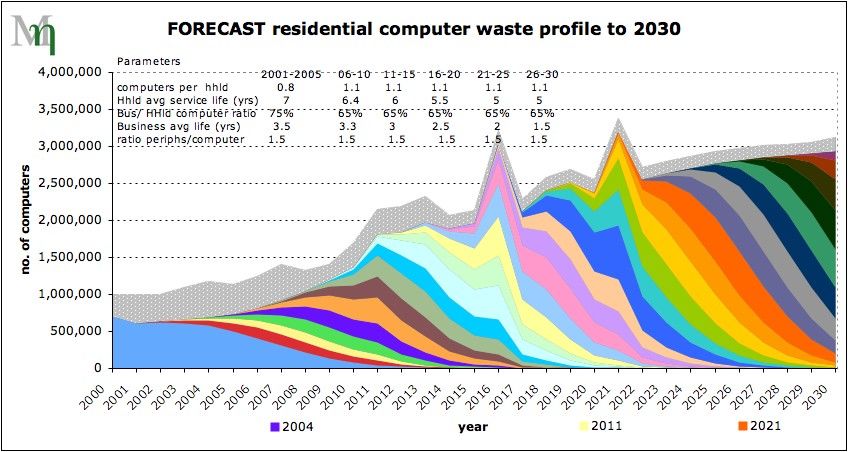
TV AND COMPUTER RECYCLING: TARGETS & SCHEME DESIGN

      Executive summary

      Australian governments have agreed to implement a national product
      stewardship scheme for televisions, computers and peripheral devices to achieve
      an 80 per cent recycling rate for these products by 2021. The key focus of this
      report is on options for calculating future recycling targets under the Scheme.
      Calculating recycling targets requires knowledge of the quantity of products that
      are being disposed of each year. Australian jurisdictions do not measure and
      report on the actual generation of waste television and computer products.
      Therefore a suitable methodology needs to be established for estimating the
      likely annual TV and computer waste stream, as well as a methodology for
      defining targets based on this estimate of waste generation so that the obligations
      and compliance of liable parties can be clearly specified and monitored.
      Modeling the waste stream
      Publicly available information on the population of residential and commercial
      users of TVs and computers, historical import data and ‘average age at disposal’
      estimates and forecasts obtained from the Televisions and Computers Decision
      Regulatory Impact Statement (released in October 2009) was used to develop a
      profile of the associated TV and computer waste stream to 2030 – the Meta
      Economics TVComp vintage model. The modelling was prepared to test and
      compare the performance of different proxies that could be used under the
      Scheme as the basis for accurately estimating waste generation.
      The modeling suggests a pattern of television and computer imports and waste
      — representing the retirement and replacement of TVs and computers bought up
      to 10-20 years earlier — as shown in Figures ES.1 and ES.2. These figures
      depict the pattern of import and disposal of televisions and computers over time,
      and the modeled relationship between annual levels of waste generation (with
      replacement) and annual growth in the population which add together to give an
      estimate of imports in an particular year.
      For example, Figure ES.1 shows that televisions purchased in 2010, which are
      on average assumed to have a lifespan of about 7 years, begin to enter the waste
      stream from the date of acquisition (in small numbers) and the number of these
      in service continues to decline over time. Assuming a commonly observed rate
      of statistical decay, the final remnants of TVs purchased in 2010 can be expected
      to be entering the waste stream well into the 2020s.
      Figure ES.1 also depicts the impact of accelerated obsolescence across the TV
      population due to old TVs being discarded earlier in favour of new and better
      technology (such as high definition or ‘smart’ TVs). This can result in a
      reduction in the average age of discarded TVs. This pattern of accelerated
      obsolescence produced abrupt increases in waste levels, and a more rapid
      process of decline and replacement of in-service equipment.

META ECONOMICS CONSULTING GROUP                   iv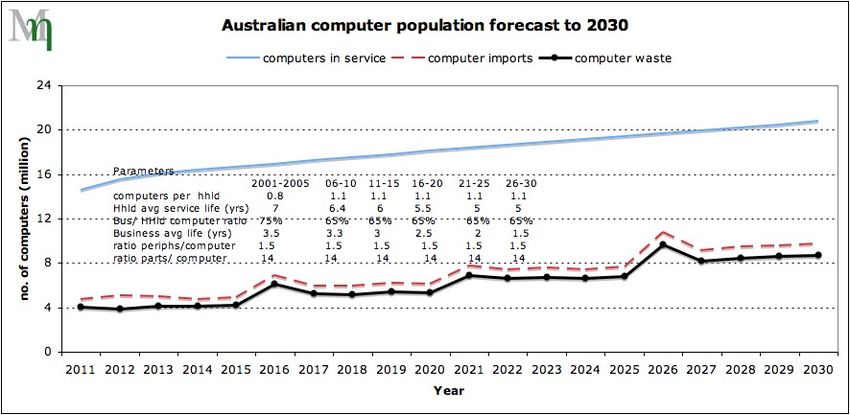
TV AND COMPUTER RECYCLING: TARGETS & SCHEME DESIGN

      Figure ES.1 Vintages of waste TVs and annual imports, 2000-30

      Source: Meta Economics TVComp model FORECAST

      Relevant patterns of computer imports and waste driven by demand growth and
      replacement in the residential and commercial sectors are shown in Figure ES.2.
      The shorter average life of computers, particularly those used by businesses, is
      readily discernable in the vintage structure of the associated waste stream.

      Figure ES.2 Vintages of waste computers and annual imports —
                  residential and business use, 2000-30

META ECONOMICS CONSULTING GROUP                      v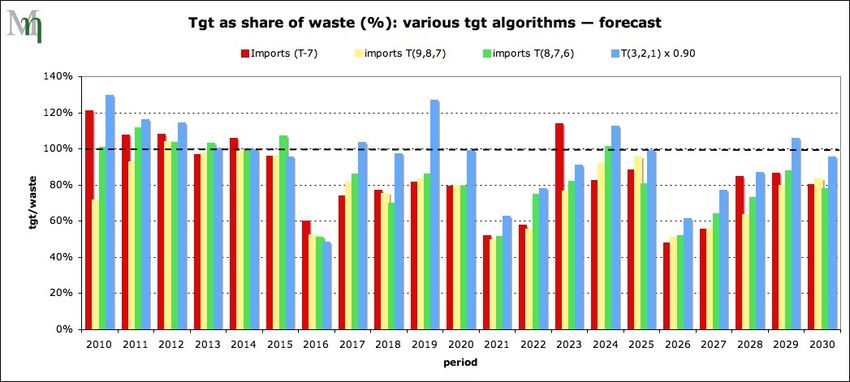
TV AND COMPUTER RECYCLING: TARGETS & SCHEME DESIGN

      Source: Meta Economics TVComp model FORECAST

      Estimating waste generation
      An analysis was conducted comparing Meta Economics TVComp vintage model
      waste estimates with proxies based on past import data, such as import data
      lagged by several years (reflecting the reported average lifespan of machines), or
      moving averages of import data over different three year periods.
      The results show that all proxies struggle to predict dynamic changes in the
      number of televisions and computers and their disposal rates. In an idealised
      ‘steady state’ situation, proxies can be scaled so that their results closely predict
      the amount of waste generated. However, in reality, proxies can be expected to
      periodically under and over-estimate annual waste levels and sometimes
      spectacularly so, due to ongoing volatility in product purchase and discard
      behaviour.
      Empirical comparison of the proxies, and consideration of the challenges of
      navigating ongoing volatility in product purchase and discard behaviour,
      suggests the desirability of an approach that:
         •   utilises an ‘averaging’ approach — with the aim of smoothing out highs
             and lows in annual import data; and
         •   relies on more recent data — which is more likely to capture the effect of
             emerging purchase trends (which in turn reflect market growth and
             replacement behaviour).
      Under this approach a scaling factor is needed to negate the ‘market growth’
      component of new imports (i.e. those products being imported that are not being
      used to replace existing products) and bring the import-based proxy into closer
      alignment with the ‘replacement’ component that drives the level of waste
      generation.
      Based on the analysis to date, an annual waste estimate based on a scaled
      moving average of the previous 3 years of import data emerges as a reasonable
      performer, for both TVs and computers.

META ECONOMICS CONSULTING GROUP                      vi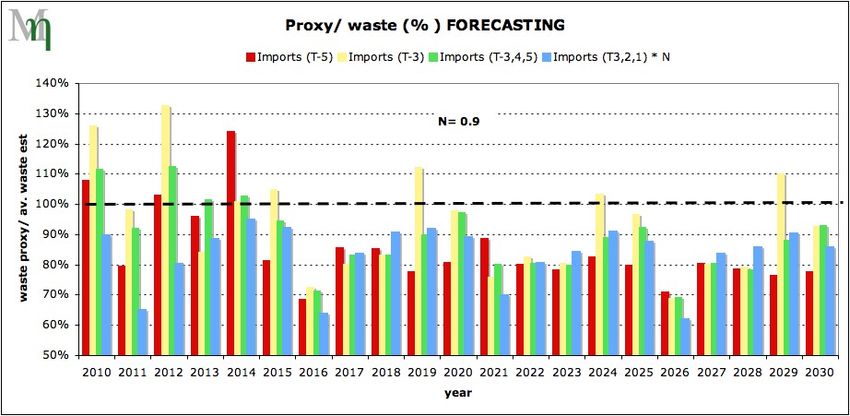
TV AND COMPUTER RECYCLING: TARGETS & SCHEME DESIGN

      Experimentation suggests that a scaling factor of 0.9 provides a reasonable
      match for TV and computer waste arising between 2012 and 2021.
      Policymakers have the option of differentiating the scaling factor according to
      the individual characteristics of the TV and computer population. The
      availability of flexibility arrangements within the Scheme is also a key
      consideration in selection of the scaling factor. Less flexibility suggests the need
      for a lower scaling factor in order to avoid excess costs. Updating the modeling
      and estimation methodology for data on import levels and the age profile of
      observed TV and computer waste will also be critically important.

      Target trajectories
      The proxy for estimating waste generation is proposed in conjunction with a
      target trajectory that takes account of current recycling levels and recycling
      infrastructure capacity and development, particularly in the early years of the
      Scheme. An incremental approach to targets is advised given the inherent
      uncertainties around estimating waste volumes. Review and recalibration of
      methodologies will also become increasingly important as target requirements
      tighten.
      Given these factors, the following target trajectory has been proposed for
      consideration:
            •   Compliance Year 1 (2012): Set separate targets for each product
                class equal to current recycling levels, plus an uplift factor (depending
                on product category and state of readiness) so that an achievable and
                meaningful expansion on current effort is required.

            •   Compliance Year 2 (2013): Increase the uplift factor for each product
                class, so that targets are equivalent to 60-70 per cent of current
                recycling infrastructure capacity (based on estimates contained in the
                2010 Wright/Rawtec e-waste recycling infrastructure capacity report).

            •   Compliance Years 3-5 (2014/15/16): Increase targets on a simple
                linear basis so that 40 per cent of the ‘waste generated’ estimate is
                required for collection and processing by year 5.

            •   Compliance Years 6-10 (207/18/19/20/21): Increase targets on a
                simple linear basis so that 80 per cent of the ‘waste generated’
                estimate is required for recycling by year 10 (this represents an
                increase of 8 per cent each year). A target of 80 per cent would be
                maintained thereafter.

      The proposed methodology for estimating waste generation and the proposed
      target trajectory will help support planning at the industry level. While it is
      impossible to provide complete certainty over future quantitative collection and
      recycling requirements because future waste levels and purchasing habits are
      unpredictable, the targets seek to provide a reasonable balance between certainty
      and the costs associated with being locked into an inaccurate waste estimate.
      With knowledge of aggregate imports and the share of the annual recycling
      target that they have been allocated each year, liable parties should be able to
      determine their individual annual compliance requirements.

META ECONOMICS CONSULTING GROUP                    vii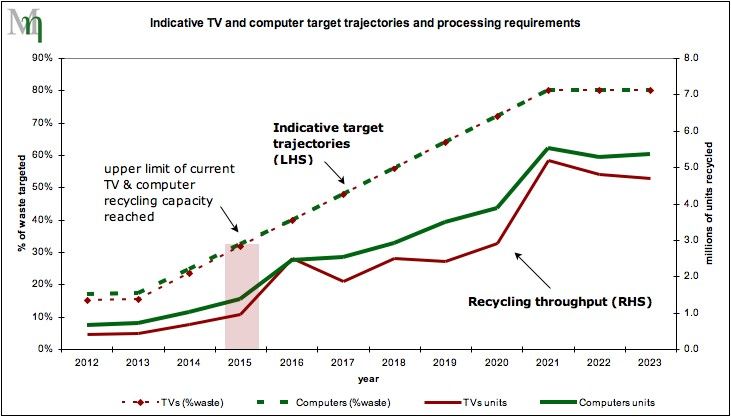
TV AND COMPUTER RECYCLING: TARGETS & SCHEME DESIGN

      Flexibility mechanisms
      Flexibility mechanisms are likely to be a useful addition to Scheme design and
      industry compliance structures. These can help spread and reduce overall
      compliance costs, smooth abrupt changes in the market and reduce the risk of
      perverse environmental outcomes.
      Given uncertainties and attendant costs, there is merit in building (and
      promoting the development of) a range of flexibility arrangements under the
      Scheme. Key recommendations for consideration include:
         •   a 3 year moving average waste estimator (as proposed in the waste proxy
             formulation above);
         •   carry-over provisions;
         •   grouped and third party compliance; and
         •   development of an industry-led contingency fund.

META ECONOMICS CONSULTING GROUP                viii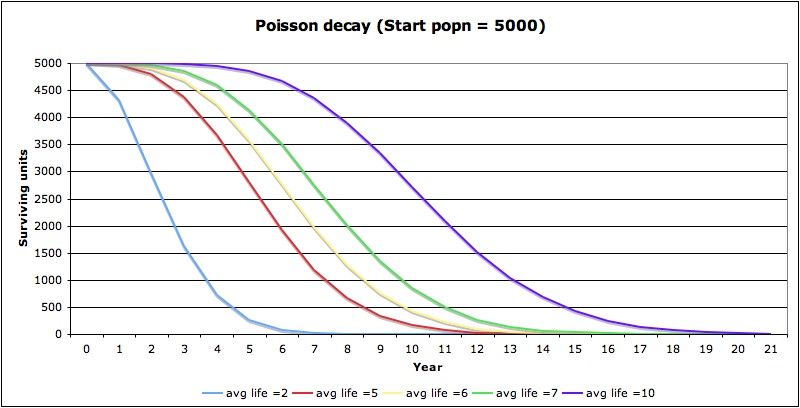
TV AND COMPUTER RECYCLING: TARGETS & SCHEME DESIGN

      Chapter 1

      Design issues for TV &
      computer stewardship
      Australian governments have agreed to implement a national product
      stewardship scheme to increase the rate of collection and recycling of
      televisions, computers and computer peripherals. The aim is to ensure that, by
      2021, at least 80 per cent of these products that would otherwise be part of the
      waste stream are diverted to recycling. The focus of this report is to assess
      methods for calculating future quantitative recycling targets under the Scheme
      and suggest practical design options that are most likely to deliver those targets
      in a cost effective manner.
      This chapter provides background information on the development of the
      Scheme. It also outlines the key considerations in estimating the television and
      computer waste stream and setting targets for the Scheme.

      1.1 Policy background
      In November 2009, all Australian governments, through the Environment
      Protection and Heritage Council, agreed to the National Waste Policy. The
      Australian Government made a commitment under the policy to develop
      national framework legislation to support voluntary, co-regulatory and
      mandatory product stewardship and extended producer responsibility schemes.
      The EPHC agreed that the first scheme to be covered under the legislation
      would be the National Television and Computer Product Stewardship Scheme,
      with a target of recycling 80 per cent of all TVs and computers entering the
      waste stream by 2021. 1 The Scheme will be implemented through regulations
      passed under the authority of the Product Stewardship Act, which was passed
      by the Federal Parliament on 22 June 2011. The main elements of the Scheme
      as currently agreed are:
      •           the Scheme will have a recycling target, that will ramp up over time to
                  reach 80% by 2021. The target will be based on a percentage of the
                  expected level of TV and computer waste generated each year;
      •           importers and domestic manufacturers (producers) of covered products
                  will be ‘liable parties’;
      •           covered products will include televisions, computers and computer
                  peripherals;

      1
          See http://www.productstewardship.asn.au/documents/MinisterGarrettReleaseMR_NationalWaste031109_001.pdf

META ECONOMICS CONSULTING GROUP                                    1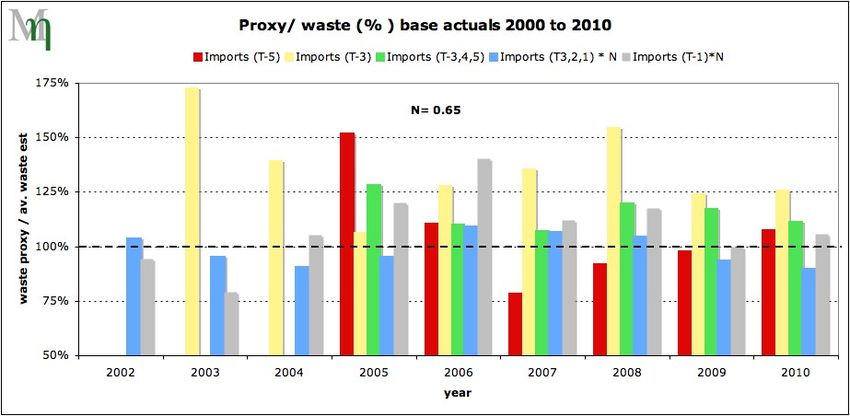
TV AND COMPUTER RECYCLING: TARGETS & SCHEME DESIGN

      •      liable parties will be required to be a member of an Approved
             Arrangement (AA), which they can do by joining a multi-member AA,
             or developing and implementing their own; and
      •      each AA will have an enforceable recycling target, which will be based
             on the market share of its members.
      The Regulations for the new Scheme are expected to be made in 2011.
      However, a range of details and decision points need to be worked through in
      order to set the specifics of the Scheme. These include:
      •      determining a statistical basis for estimating waste generation;
      •      whether to set targets for different product classes;
      •      the year 1 target;
      •      the 10 year target trajectory to reach 80% by 2021; and
      •      the method for determining an importer/producer’s annual obligation
             under the Scheme.
      Some key principles are relevant to this task.
      The first is to achieve the social and environmental objectives of the Scheme at
      least cost. The regulatory impact analysis conducted for the Scheme by
      PricewaterhouseCoopers and Hyder Consulting highlighted that the
      environmental risks associated with televisions and computers can differ, yet
      social choice modelling conducted by URS identified strong community
      support for recycling of these products. This analysis suggested that there is a
      strong desire within society for these goods (and perhaps, sophisticated
      electronics more generally) to be recycled, and the community recognises a
      benefit from this outcome. The existence of this social benefit, over and above
      the environmental benefit achieved through recycling, is a key part of the
      stream of benefits expected to flow from the Scheme.
      With a Ministerial decision to proceed with the Scheme now in place, the
      Scheme needs to be designed so that it achieves its objectives in a cost effective
      manner. A tenet of cost effective Scheme design is to allocate resources for
      maximum pay-off. That is, target the low hanging fruit first, look for synergies
      between objectives, prioritise, and tie requirements and incentives as closely as
      possible to desired outcomes.
      Secondly, good Scheme design (leading to consistent and efficient incentive
      structures) treats like goods and service providers in a similar manner. Closely
      substitutable goods (and competitors) should be treated the same — unless it is
      impractical or uneconomic to do so. In line with the first principle, the direct
      costs of inclusion can sometimes outweigh the direct benefits — but wider
      considerations such as competitive distortions and overall impacts on Scheme
      outcomes need to be taken into account. Cost shares should be in line with
      share of the problem or pay-off, or ability to pay.

META ECONOMICS CONSULTING GROUP                    2
TV AND COMPUTER RECYCLING: TARGETS & SCHEME DESIGN
Thirdly, it is important to be pragmatic in designing regulations and compliance
structures. Simple, straightforward and transparent goals and requirements
facilitate compliance and performance monitoring. It is important to apply pre-
existing and readily available information and organisational structures
wherever possible, and ground Scheme requirements in logic and fact. This is a
critical element of robust scheme design.
Finally, in cases where there are significant risks or uncertainties it is important
to build safeguards and flexibility into the system. Safeguards might include a
slow ramp up of requirements in order to test costs and supply-side capacity,
and design features that allow ‘under and overs’ to be spread for compliance
purposes. Flexibility provides for choice and innovation in areas that are non-
critical, and therefore do not need to be tightly prescribed.
Analysis and discussion of these elements in the context of target setting and
compliance requirements is provided in the following chapters.
META ECONOMICS CONSULTING GROUP 3TV AND COMPUTER RECYCLING: TARGETS & SCHEME DESIGN
Chapter 2
Calculating waste generation
Calculating recycling targets requires knowledge of the quantity of products
that are being disposed of each year. Australian jurisdictions do not measure
and report on the actual generation of waste television and computer products.
Therefore a suitable methodology needs to be established for estimating the
likely TV and computer waste stream before a target trajectory can be
established. This chapter presents modelling that has been prepared based on a
range of data sources to produce a forecast of TV and computer imports and
waste generation to 2030. The modelling is used to test and compare different
proxies that could be used under the Scheme to estimate the likely TV and
computer waste stream.
2.1 How much waste?
Computers and TVs have become ubiquitous within Australia, with nearly
every household owning one of these devices. The incidence of TV sets across
Australian households is estimated at over 99 per cent, with about 90 per cent
of households having more than one television on the premises.2 A range of
commercial and service operations such as hospitals, airports, shopping centres,
offices, retail outlets and business shopfronts and waiting rooms add to this list.
Similarly, computers and peripherals are an everyday item within many
households and an essential tool for most businesses and many employees.
Part of the total stock of TVs and computers within Australia are discarded
each year, and replaced. However, as the Australian economy and population
grows and these electronic and communication devices proliferate and reach
obsolescence over time, the number of these products that are — or will be —
discarded each year is changeable and uncertain.
Good data on imports and sales is critical to answering this question, though on
its own it is not enough. Historical sales and trade information tells us how
many units have entered the country, but as Australian jurisdictions do not
measure and report on the actual generation of waste television and computer
products, we can only estimate the rate at which these are being retired and
discarded. What’s more, this rate can change quickly in response to a change in
tastes, technology or economic circumstance, and demand for new and
replacement product can also be fluid.
2
Australian Communications and Media Authority (ACMA), 2007, Media and Communications in
Australian Families, December 2007, Canberra, p.48-49.
META ECONOMICS CONSULTING GROUP 4TV AND COMPUTER RECYCLING: TARGETS & SCHEME DESIGN
2.2 Televisions
At present, the supply of new televisions within Australia is wholly reliant on
imports – there is no manufacturing industry.
Knowledge of the average lifespan of a set (that is, the age at which it is
discarded — not the length of time it takes to burn out), and the level of
historical imports can generate a rough estimate of the level of discarded TVs
that might be expected in any one year. TV imports (TVI) can be thought to
comprise replacement TVs (TVR — from the existing TV population) plus new
TVs (TVN — linked to growth in the TV population):
TVI = TVR + TVN
In a static ‘no growth’ environment where the ‘average’ lifespan applies rigidly
to all TV sets and user habits are immutable, past imports will be an excellent
numerical guide to the number of discarded TVs in any particular year.
Replacement TVs (which equal the number of discarded TVs) will normally
swamp the number of TVs associated with growth in the population and this
effect will be more pronounced the shorter the life of the appliance.
However, in reality, turnover in the TV population is more complex than that.
Use of an ‘average’ lifespan can mask a potentially wide range of actual
lifespans – with some TVs kept longer by users with little interest in upgrading
to the latest technology and others being replaced quickly as bigger better sets
become available. Meanwhile, TV ‘deaths’ from old age, premature burn out
and accidents are occurring continuously in the background. With the
technology moving rapidly and last year’s cutting edge machine being this
year’s sale item, there is an increasing tendency for TVs to be considered a
consumable and discardable item.
This highlights a key point. The number of waste TVs in any one year can be
influenced by both the distribution of observed lifespans around the average
and structural changes to consumer tastes that affect the range and the average.
Income and population growth will also be fundamental drivers. Therefore the
stream of TV waste will be comprised of TVs of varying ages and will be
influenced by the availability of new or cheaper technologies and economic
conditions.
Furthermore, there can also be some degree of ‘storage’ of broken or redundant
equipment. This means that it may take some time for ‘end of life’ items to
actually enter the waste stream. It also implies a potential backlog that can
affect the ‘supply’ of waste televisions in a particular year. The implications of
this issue for the design of the Scheme are addressed in chapter 3.
Methodology for modeling TV inflow and retirement
Changes in tastes affecting TV service life and redundancy can introduce a key
source of volatility into target setting which is based on historical import data.
This is illustrated in the following modeling of the Australian TV population.
The modeling is based on ABS household data and projections, Customs
import data (obtained by SEWPAC) and behavioural information in the PwC
Computers and Televisions RIS.
META ECONOMICS CONSULTING GROUP 5TV AND COMPUTER RECYCLING: TARGETS & SCHEME DESIGN
PwC note that TV imports to Australia in 2007-08 totalled 3.1 million units,
and projected imports of 4.8 million units for 2027-28. Remarkably, more
recent data suggest that TV imports to Australia have risen by more than 10 per
cent over the last 18 months (these data were used to calibrate the TV
population model developed by Meta Economics for the purposes of this
study).
Key additional assumptions and drivers used in preparing the modelling (in line
with parameters provided in the PwC RIS) are:
1. use of ABS data (ABS 8146.0) to determine the number of households
in Australia for 2000 to 2009, and ABS mid range projections (ABS
3236.0) for 2010 to 2030;
2. 2007 survey outcomes for household ownership of TVs and computers
drawn from the Australian Communication and Media Authority
Australian Families survey;
3. use of a Poisson distribution to estimate the retirement profile of the
Australian television stock, based on an average TV lifespan trend
based on work in the PwC RIS;
4. assumption of a 4:1 TV ownership ratio between private households and
the business sector for 2000 to 2010
5. assumption that the ‘starting year’ TV stock in 2000 reflected a ‘steady
state’ and therefore leads to a vintage structure in the TV waste stream
consistent with an average expected life in 2000 (and the preceding
years) of 8 years. This being the case, virtually all TVs purchased pre-
2000 leave service by around 2012.
Further — and critically — annual TV import data for the period 2000-01 to
2010-11 were used to inform and calibrate the historical estimates for imports
and implied waste. Actual TV import data are a valuable check on assumptions
around the per-household incidence of TVs, the starting TV population and age
profile (at the time the model begins from 2000).
This data series represents a key foundation for the development of the study
because it provides an actual head-count of TVs that will eventually be retired.
The challenge in establishing targets for the Scheme is to deal with the
uncertainty around ‘when’ they will be retired, noting that technological change
will tend to shorten their life and economic downturn will tend to prolong it.
Parameter assumptions covering the 2000 to 2030 timeframe modeled are set
out in Table 2.1. The Customs import series that forms the basis for the
subsequent modelling for TVs — and for computers — appears in Table 2.2.
Table 2.1 TV population modelling parameters
20 0 1- 20 0 6- 20 1 1- 20 1 6- 20 2 1- 20 2 6-
05 10 15 20 25 30
tvs per hhld 1.9 2.0 2.1 2.1 2.1 2.1
average service life 8 7 7 5.5 4.5 3.5
Bus/ HHld TV ratio 25.0% 25.0% 27.0% 27.0% 27.0% 27.0%
META ECONOMICS CONSULTING GROUP 6TV AND COMPUTER RECYCLING: TARGETS & SCHEME DESIGN
An important outcome of the modelling is the strong vintage effect that is likely
to be present in the current population of TVs in Australia. The Poisson
distribution is favoured for the statistical investigation of discrete occurrences
in a population where the average or expected value is known, but the variation
around that average value is not. It is a well established and commonly used
statistical technique for modeling defects or failures within an equipment
population.
Table 2.2 TV and computer import data 2000 to 2010
FY (beginning 00- 01- 02- 03- 04- 05- 06- 07- 08- 09-
July 2000) 01 02 03 04 05 06 07 08 09 10
Imp orts (m illio ns of units)
na 0.66 1.46 2.73 2.64 2.84 2.70 3.09 2.89 3.74
TV s
Com p uters 2.06 1.73 1.45 2.01 2.51 3.38 3.20 3.97 3.94 5.13
(incl
mo therb oar ds)
MF D s & 5.1 3.8 4.4 5.2 5.8 5.6 4.3 2.6 2.3 2.5
printer s
Par ts & 10.5 33.5 58.0 57.2 60.3 60.3 47.3 35.8 26.1 27.9
perip her als
0 0.9 1.8 2.0 1.8 2.0 2.3 2.9 2.4 2.4
Mo nitors
Expor ts (m illio ns o f units)
0.02 0.02 0.03
TV s
Com p uters 0.62 0.50 0.53
(incl
mo therb oar ds)
MF D s & 0.32 0.53 0.50
printer s
Par ts & 3.80 2.98 2.29
perip her als
0.25 0.26 0.22
Mo nitors
Source: Australian Customs Service (provided to SEWPAC)
For example, the analysis shows that 5000 TV sets purchased in 2000, each
with an expected or average lifespan of 8 years (as per the modeling), could be
expected to follow the pattern of disposal described in Table 2.3. Of this group,
two TVs are expected to be discarded within their first 12 months, and the last
TV set would be expected to leave service in 2020.
META ECONOMICS CONSULTING GROUP 7TV AND COMPUTER RECYCLING: TARGETS & SCHEME DESIGN
Table 2.3 Poisson probability distribution (start popn = 5000, avg life = 8)
Ye ar
0 1 2 3 4 5 6 7 8 9 10 11 12 13 14 15
No.
2 13 54 143 286 458 611 698 698 620 496 361 241 148 85 45
discar ded
The pattern of exit or mortality associated with a Poisson decay statistical
model for a range of illustrative ‘average’ lifespans is shown in Figure 2.1.
Figure 2.1 Population decay under the Poisson distribution
Modeling results
The household and usage parameters described above generate an age profile
for the fleet of TVs leaving service over the period 2000 to 2030 as shown in
Figure 2.2. This depicts actuals data from 2000 to 2010 and RIS-based
forecasts of behavioural and technological change affecting average lifespans.
The more rapid decay of the TV population is a notable feature as the expected
lifespan drops from 8 years in 2000 to 7 years currently, to 3.5 years from
2026.
META ECONOMICS CONSULTING GROUP 8TV AND COMPUTER RECYCLING: TARGETS & SCHEME DESIGN
Figure 2.2 Vintage composition of retired TVs and annual growth
Source: Meta Economics TVComp model FORECAST
The ‘spikiness’ of waste TVs and imports in response to step changes in the
average life of TVs is noteworthy. This is primarily driven by the assumption
that TVs are discarded in the year that they are replaced, and a reduction in the
life of TVs automatically generates a pattern of accelerated obsolescence within
the surviving stock. While the model has the capability to smooth this effect, in
reality these kinds of step changes may in fact be likely. The availability of
cheap high definition flat screen TVs is likely to have a marked effect on the
value placed on TVs of older vintages, and their accelerated movement into the
waste stream. The phase out of analogue television services in the coming
months may also act to induce replacement TV purchases and an increase in the
number of waste TVs as different regions are ‘switched over’.
The relationship between the level of TV waste and imports is also telling. As
noted, with no local production, the level of annual imports is approximately
equal to the level of discarded TVs plus incremental growth.3 But casual
inspection of Figure 2.2 suggests that there is no strong functional relationship
between historical imports in any one year and scrappage rates in a future year.
The level of TV waste is a function of 10 to 15 years worth of past purchase
decisions, and future levels depend on changing tastes and income that can
result in accelerated obsolescence or a decision to persevere with an outdated
model.
Moreover, an economic slowdown is likely to have the effect of deferring TV
replacement and extending service life. In this situation past import data can
significantly exceed waste generation. Unfortunately no waste estimator that is
backwards looking deals well with this occurrence, and significantly lagged
estimators have little hope of reflecting recent behavioural trends or changes in
the economic cycle. It is only in a steady state, where TV numbers per
household and expected lifespans have stabilised, that waste and historical
imports tend to run in parallel.
3
Approximately, because it is reasonable to assume that the majority of end-of life TVs will be replaced
— and the bulk of these within the same year that they are discarded.
META ECONOMICS CONSULTING GROUP 9TV AND COMPUTER RECYCLING: TARGETS & SCHEME DESIGN
Historical imports capture a sample of the TV stock likely to be moving into
the ‘high obsolescence probability’ band, whereas more recent import data
captures the effect of more recent wastage rates, plus the accumulated impact of
population growth rates and changes in tastes.
Performance of TV waste proxies
A test run of proxies for annual TV waste within the model is shown in Figure
2.3. It reflects the following parameter values, and reports the value of the
waste proxy (based on import data) for each year divided by the waste
generation estimate for that year (generated by the Meta Economics TVComp
vintage model). When the values of the proxy and the waste generation
estimate are equal, the ratio equals 100 per cent. An over-estimate of waste
generation produces a percentage greater than 100 and when the proxy under-
estimates waste generation, the ratio is less than 100 per cent.
Proxies tested in Figure 2.3 are:
1. TV import data from 7 years prior to the current year (in RED)
2. a moving average of TV import data for years 9, 8 and 7 years prior
(YELLOW)
3. a moving average of TV import data for years 8, 7 and 6 years prior
(GREEN)
4. a moving average of TV import data for years 3, 2 and 1 years prior —
multiplied by a scaling factor of 0.9 (BLUE).
Figure 2.3 Performance of proxies for TV waste — 2010-2030
actuals plus RIS forecast changes
Source: Meta Economics TVComp model FORECAST
META ECONOMICS CONSULTING GROUP 10TV AND COMPUTER RECYCLING: TARGETS & SCHEME DESIGN
The pattern of unders and overs in figure 2.3 can be translated into a summary
measure of proxy performance. The summation of annual results both above
and below the line for the period 2010 to 2030 is shown in Table 2.4. The
numbers reflect the difference in the number of waste TVs predicted by the
relevant proxy and the number of waste TVs indicated by the model using
information on past imports, usage levels and average lifespan. In addition, an
indicative weighting of ‘ times 3’ is applied to over-estimated amounts to
highlight the potential costs associated with such an outcome.4
Table 2.4 Summary performance of TV waste proxies, 2010-30
G ap be twee n pro xy va lue a nd wa ste estim a te
(millio ns of T V units, 20 1 0- 30 )
Exc eed * Exc eed * —
Exc eed (x3) Under shoo t und ershoo t
Imports (T-7) 1.15 3.44 25.87 -22.43
Imports (T-9,8,7) 0 0.29 28.46 -28.18
Imports (T-8,7,6) 0.1 1.23 25.41 -24.18
Imports (T-3,2,1) x 0.9 2.55 7.64 14.82 -7.18
Proxies with a tendency to over-estimate waste generation are undesirable from
a compliance perspective because they can produce a situation where liable
parties under the Scheme have an incentive to pursue waste that has not yet
actually been generated (such as when the recycling target is high, e.g.
approaching the 80 per cent benchmark set for 2021). This could easily drive
up collection costs and even create a situation where operational TVs were
pulled out of service early in order to satisfy Scheme requirements (depending
on incentives created by flexibility arrangements and non-compliance
penalties). This would be a very poor outcome for the Scheme. On the other
hand, proxies that radically undershoot the waste generation estimate are
undesirable from a community perspective.
A desirable or high performing proxy is one that consistently produces an waste
generation estimate that is equal or close to the ‘actual’ level of waste
generation in a particular year, and errs on the side of under-estimating waste
generation — particularly as the recycling requirement moves closer to the 80
per cent target (to be achieved no later than 2021).
The pattern of waste in Figure 2.3, which encompasses step changes in
consumer tastes and associated obsolescence, suggests that historical waste
(averaged over a 3 year period) represents a more stable proxy for waste levels,
and errors tend to err on the side of under-estimating waste generation — with
the notable exception of a large over-estimation error expected in 2019, due to
the flow on impact of a predicted step change in obsolescence occurring in
2016. Importantly, a cyclic pattern can be observed for all the proxies,
4
Other, more elegant, non-linear weighting approaches could be conceived that ‘punish’ large
overruns more severely than modest ones. Better information on costs is desirable here.
META ECONOMICS CONSULTING GROUP 11TV AND COMPUTER RECYCLING: TARGETS & SCHEME DESIGN
suggesting the potential benefit of a carry over approach to ‘unders’ and ‘overs’
in the program design.
Notably, the revised European directive on Waste Electrical and Electronic
Equipment (WEEE) utilises a target mechanism defined in terms of prior year
import levels, instead of a per capita target (as applied when the Scheme first
came into force in February 2003). This is applied in conjunction with a scaling
factor, presumably to account for the population growth component (ie. TVs for
new households and businesses, plus extra TVs for pre-existing users) over and
above the structural waste component.
Details of changes announced at the end of 2008 for the EU’s WEEE directive
note the development of new targets that will need to be achieved annually
from 2016 and which entail:
ʻ… setting mandatory collection targets equal to 65% of the average weight of
electrical and electronic equipment placed on the market over the two previous years
in each Member State.ʼ
EC Press Release IP/08/1878, Environment: Commission proposes revised laws on recycling
and use of hazardous substances in electrical and electronic equipment, 3 December 2008
Key observations from this analysis and implications for TV waste estimation
include:
• rapid change in tastes, technology and associated product redundancy
can be difficult to capture via historical proxies based on observed
imports — particularly those that are linked to notions of the average or
expected life of a long lived product.
• while near term estimators (based on import volumes) can provide
closer ‘sampling’ of these changes, some scaling is required to ensure
that ‘waste generation’ is not over-estimated. Two factors can mitigate
the risk of an excessive burden being imposed:
o under the assumption that disposal and replacement will most
likely occur in the same year, Arrangement Administrators are
likely to observe demand ‘booms and busts’ in real time and
plan their collection activities accordingly (as long as some
allowance is made for spreading under and over-shooting of
targets in the compliance structure); and
o in reality, changes in demand and waste rates will not always be
as abrupt as depicted in the modeling (ie. step changes). This
will help moderate demand and waste ‘spikes’ in the series and
reduce risks of excessive burden.
• long lag import data (eg. T(9,8,7)) have a tendency to err on the side of
under-estimating waste rates under scenarios of background demand
growth and technological changes that accelerate obsolescence and
scrappage. The opposite is likely to be the case in a declining market,
which may prove onerous when recovery is slow. Long lag import data
also does not capture immediate changes in tastes and technology, or
intervening market growth rates. This makes for a less volatile series,
but can imply greater scope for waste estimation error.
META ECONOMICS CONSULTING GROUP 12TV AND COMPUTER RECYCLING: TARGETS & SCHEME DESIGN
• real time information (appropriately scaled) is generally to be preferred
to older information for the purposes of target setting, compliance and
dynamic control.
• waste over-estimation becomes a greater concern as recycling targets
push closer to the 80 per cent benchmark because of the greater risk that
target obligations might require participants to collect waste that, in
fact, has not yet been generated. This can have adverse implications for
costs and the Scheme’s environmental objectives.
• there is need to build flexibility in the system, avoid significant over-
estimation and regularly review and adjust estimation approaches based
on observed waste levels and collection information, including costs.
2.3 Computers
The vintage model developed by Meta Economics for TVs has also been
applied to computers and related items. However, computers are a more
complicated target group. The key reasons for this are:
• they are imported both as fully assembled systems and also in
component form (according to the PwC RIS, about 12 per cent of
computer sales in Australia are locally assembled ‘white box’
computers);
• the technology is moving rapidly, and penetration is increasing;
• there is (reportedly) a more active second hand market (though this does
not pose a major difficulty for this analysis because it focuses on newly
imported computers and end-of -life computers — that is, those that are
scrapped rather than re-used);
• there is a higher level of recycling already being achieved (estimated in
the Decision RIS at about 14 per cent of computer waste (by weight) in
2007-08);
• an unspecified (but presumably significant) number of low cost
computer parts and peripherals are likely to accumulate as a sales
inventory, and not enter service in the year of import (the PwC RIS
indicates that about 28.6 million pieces of computer hardware entered
Australia in 2007-08 — 37 per cent of this was ‘power cords’ (eg.
cables, etc), 12 per cent were keyboards and mice, and 13 per cent were
CPUs and hard drives;
• two distinct populations use computers and accessories — households
and business. Turnover rates differ between these groups due to
intensity of use and tax treatment;
• a range of peripheral devices are also being targeted. These range from
technically elaborate equipment such as printers and scanners to
typically low-tech devices such as speakers and keyboards.
META ECONOMICS CONSULTING GROUP 13TV AND COMPUTER RECYCLING: TARGETS & SCHEME DESIGN
Faced with these issues, the vintage model for computer equipment was
developed with a focus on computer numbers (desktops and laptops), and their
use by households and business. The usage of components and peripherals was
seen as ancillary to computer consumption, with due recognition of the share of
components that are assembled to produce generic computer models.
Methodology for modeling computer inflow and retirement
Like the TV model, household numbers and usage rates were used as the key
basis for determining residential computer demand. For business, the number of
computers in use was based on the number of people in particular user groups.
Specifically, the number of business use computers was approximated by the
number of people in Australia (including employees, employers and the self
employed, full and part time) classified by the ABS as managers, professionals
or administrative or clerical workers. Each of these people was attributed with
one computer for commercial use. Workers classified to other occupational
categories (eg. technical or tradespersons, sales or community services) were
attributed with zero computers in the workplace.
Relevant household and business user numbers for the period 2005 to 2010 are
shown in Table 2.5. For modelling purposes, ABS estimates for these series
dating back to 2000 were used, together with ABS forecasts for Australian
household numbers to the year 2030.
Table 2.5 ABS user group data — households and business, 2005
to 2010
Ye ar ‘05 -0 6 ‘06 -0 7 ’07 -0 8 ’08 -0 9 ’09 -1 0
Thousa nd s ( 0 00’ s)
No. of households 7,945 8,071 8,244 8,189 8,236
No. of business 4,708 4,951 5,024 5,280 5,326
computer users
Note: business users represent the sum of all workers classified to managerial, professional
and administrative / clerical occupations. Data for the February quarter of the relevant
financial year are shown.
Source: ABS 8146.0 (Household estimates), ABS 6291.0 (Status of employment, SuperTable E08_Aug96).
Population and usage parameters derived from the PWC RIS and which drive
the model’s usage and waste forecasts out to 2030 are shown below in Table
2.6. Near term estimates (ie. information on usage between 2000 and 2010) are
based on actual ABS, import and survey data where available. For computers,
export data reflect a mixture of re-export of new machines to other countries
and some export of refurbished machines, which represent ‘leakage’ from the
national waste stream. A reduction of around 8 per cent has been made in the
model to reflect this impact on the annual quantity of computer waste available
for recycling in Australia. Computer import and export information was
reported earlier in Table 2.2.
META ECONOMICS CONSULTING GROUP 14TV AND COMPUTER RECYCLING: TARGETS & SCHEME DESIGN
Table 2.6 Computer population model forecasting parameters
2001- 2006- 2011- 2016- 2021- 2026-
05 10 15 20 25 30
compu ters per hhl d 0.8 1 1.1 1.1 1.1 1.1
hhld av g service life (yrs ) 7 6.4 6 5.5 5 5
bus/ hhld com puter ratio 75.0% 65.0% 65.0% 65.0% 65.0% 65.0%
business avg life (yrs ) 3.5 3.3 3 2.5 2 1.5
ratio peripherals/co mpu ter 1.5 1.5 1.5 1.5 1.5 1.5
ratio parts / compu ter 14 14 14 14 14 14
These parameters (based on past data and lifespan and household projections)
generate the population and waste forecasts depicted in Figure 2.4.
Figure 2.4 Aggregated computer population, import and waste
forecasts, 2010 to 2030
Source: Meta Economics TVComp model FORECAST
Modeling results
Estimated vintage and waste profiles for business and residential computers are
shown in Figure 2.5. The influences of demand growth and technical change
leading to accelerated obsolescence are similar to those illustrated for TVs.
However, the shorter lifespan of these appliances, particularly for the business
sector, and stronger underlying market growth sees computer vintages dissipate
rapidly over a much shorter time frame.
META ECONOMICS CONSULTING GROUP 15TV AND COMPUTER RECYCLING: TARGETS & SCHEME DESIGN
Figure 2.5 Vintages of retiring computers, and associated
imports
Source: Meta Economics TVComp model FORECAST
Performance of computer waste proxies
Figure 2.6 shows the performance of proxies using both actual import data for
the decade to 2010, and forecast outcomes from 2010 to 2030.5 Proxies include:
1. computer import data from 5 years prior to the current year (in RED)
2. computer import data from 3 years prior to the current year (YELLOW)
3. a moving average of computer import data for years 5, 4 and 3 years
prior (GREEN)
5
Note that use of a T-5 proxy implies that post-2000 import data becomes relevant as a
predictor of waste from 2005 onward.
META ECONOMICS CONSULTING GROUP 16TV AND COMPUTER RECYCLING: TARGETS & SCHEME DESIGN
4. a moving average of computer import data for years 3, 2 and 1 years
prior, multiplied by a scaling factor (BLUE)
5. computer import data from 1 year prior to the current year, multiplied
by a scaling factor (GREY).
Figure 2.6 Performance of computer waste proxies, using 2002 to
2010 import actuals and 2011 to 2030 forecasts
Source: Meta Economics TVComp model FORECAST
The patterns of unders and overs have been have been translated into a
summary of proxy performance in Table 2.7 (developed as described
previously for TVs).
META ECONOMICS CONSULTING GROUP 17TV AND COMPUTER RECYCLING: TARGETS & SCHEME DESIGN
Table 2.7 Summary performance of computer waste proxies,
2010-30
G ap be twee n pro xy va lue a nd wa ste estim a te
(millio ns of T V units, 20 1 0- 30 )
Exc eed * Exc eed * —
Exc eed (x3) Under shoo t und ershoo t
Imports (T-5) 1.33 3.98 23.99 -20.01
Imports (T-3) 4.09 12.28 15.80 -3.52
Imports (T-3,4,5) 1.03 3.10 18.02 -14.91
Imports (T-3,2,1) x 0.9 0.00 0.00 22.34 -22.34
The results indicate that historical import data series do not mirror estimated
disposal rates particularly well in this rapid growth, faster turnover
environment. The large influx of imports observed in this period (significantly
in excess of model predictions based on estimates of the user population and
average life parameters) introduces significant volatility. A scaling factor of
0.65 is required to ‘fit’ these observations of actual imports to waste generation
estimates derived from the population and usage parameters.
Uncertainties over the composition of the pre-2000 computer population, and
the prospect that estimates of ‘average years to retirement’ might have been
inflated by a storage overhang of computers that affected data collection under
the Byteback collection program are likely contributors to this outcome.
In the more stable ‘forecast’ period, where actual import data is being applied
for the period 2000 to 2010, a scaling factor of 0.9 performs reasonably well (as
observed previously for TVs). Gross import data is used in deriving this
parameter, with adjustment to account for (new and refurbished) computer
export activity being loaded into the waste stream estimate. Given the relatively
short life of computers, this approach has a minimal impact on the aggregate
estimate of computer waste over the medium term. If it were possible to net out
re-export of new computers, this would be likely to increase the scaling factor
(because slightly fewer annual imports would be being used to ‘predict’ annual
available waste), but the impact would be small against the backdrop of
uncertainties present. For reasons of practicality this has not been pursued.
A weighted recent moving average approach is likely to reflect the waste
stream reasonably well, as do alternative moving average approaches with
slightly longer lags (such as T-3,4,5). Use of an unadjusted T-3 proxy tends to
overshoot the waste estimate due to the influence of the recent and pronounced
influx of computers, while T-5 tends to undershoot the waste generation
estimate although it too is clearly influenced by discrete annual import surges.
Overall, the results highlight the desirability of scaling and smoothing
adjustments (eg. multi-year averaging) aimed at ameliorating the potential for
compliance cost over-runs, and this objective becomes more pertinent as
Scheme requirements push liable parties closer to the ‘80 per cent of waste
generation’ recycling target.
META ECONOMICS CONSULTING GROUP 18TV AND COMPUTER RECYCLING: TARGETS & SCHEME DESIGN
The modeling reveals no clear winner, but does highlight the desirability of a
moving average approach to iron out abrupt changes in waste output and
imports. And, as noted previously in a real world setting, use of import data
from more recent years is likely to reduce the risk of a serious mismatch
between waste generation and the proxy estimate. This is because more recent
data reflect newer information on the consumption and technological trends
driving current waste levels. Changes in technology, and the influx of new
equipment via import channels, will invariably wash through the system from
time to time.
Appropriate treatment of peripherals and computer components is an added
complexity. These items amplify the number of computers and related parts
that are recorded as entering the country, and which will ultimately be
discarded. However, while they swell the number of parts, their influence on
import values and waste tonnages is not as great. Though they add considerably
to numbers (by a significant multiple), they are generally less valuable and
weigh less on a per item basis.
2.4 Stockpiling — incidence and implications
The existence of a stockpile of retired computers and TVs compounds the
difficulty of estimating the amount of waste generation that will be available to
the Scheme. Past years waste may be accumulating in storage spaces and
garages due to an aversion to sending advanced electronics to landfill, or self
interested economic behaviour. For instance, householders in the ACT face a
drop-off fee for computers and TVs which can deter some users from
depositing their products at waste management centres. Faced with a significant
disposal fee, cheaper alternatives, including storage, are used more frequently.
Promotion of cheap and environmentally attractive disposal options will
undoubtedly see a reduction in the incidence of stored end-of-life electronics by
households.
Meinhardt (2001), a report commissioned by Environment Australia, suggests a
high incidence of storage among users during the late 1990s. A survey of 100
South Australian households found that of replaced computers, about
34 per cent had been put into storage, while an additional 26 per cent had been
passed on for re-use (normally within the family). The report also cites a 1999
Florida study which indicates that over 71 per cent of obsolete computers in
that US state were put into storage awaiting disposal, 21 per cent were recycled
and 8 per cent were landfilled.6
Unfortunately, the duration of storage is not discussed and it is difficult to tell
from the available literature and survey work whether the ‘storage’ described is
a short or long term phenomenon (ie. a month or 2 awaiting the next trip to the
waste management centre, or several years). Similarly, while the experience of
recent computer recycling programs in South and Western Australia point to
strong pent up demand for such services, evidence is not available on the
average age of waste machines, or how many of these ‘years to disposal’ were
spent in a back shed or under the house.
6
Meinhardt Infrastructure & Environment Group (2001), Computer & Peripherals Material
Project, Prepared for the Department of Environment and Heritage, October 2001, pp.25-26.
META ECONOMICS CONSULTING GROUP 19TV AND COMPUTER RECYCLING: TARGETS & SCHEME DESIGN
The modeling work and estimates developed in the course of this project are
robust under a short to medium term storage scenario because they are built on
an assumption that waste computers enter the waste or recycling stream in the
year that they are retired. However, a high incidence of long term storage can
have a significant impact on the amount of waste generation that might come
forward for processing under the proposed Scheme.
Importantly both households and Waste Management Centres themselves may
be a source of stored end-of-life computers. Anecdotal evidence suggests that
landfill operators in some locations are collecting and storing waste computers
and TVs presented to them for disposal. This may be symptomatic of a
reluctance to send e-waste to landfill. It may also reflect an expectation that a
lower cost or even financially beneficial disposal option, such as the Scheme,
may become available in the future. ‘Saved’ computers and TVs will have been
diverted from landfill, and are likely to be a readily available source of supply
for the new Scheme. In fact, so long as the cost of sending waste computers and
TVs for recycling via the Scheme is less than or comparable to the cost of
sending them to landfill, this dynamic can be expected to continue.
It means that the Scheme is likely to be ‘over-subscribed’ in the early years,
and a buffer stock of waste TVs and computers is likely to be available to help
moderate collection costs linked to delivering on targets.
The interaction between the collection activities undertaken by Arrangement
Administrators, waste collection authorities and material recyclers can be
expected to evolve along commercial lines. Determining the extent and national
distribution of computer and TV storage, and how its volume and economics is
likely to interact with the proposed Scheme is beyond the scope and resources
of the current project.
2.5 Implications for target setting
In general, import data looks to be a reasonable basis for defining TV and
computer waste estimates in the early years of the Scheme. In a static situation
annual imports tend to be greater than annual waste because the former
comprises replacement plus market growth. However, in a situation where
tastes, replacement costs and technology are changeable there is no systematic
ratio or relationship that sees some fixed formulation of past imports move in
lockstep with future or current year waste generation levels.
What is clear is that estimates for waste generation need to be based on the
particular stock, growth, turnover and technological characteristics of the
product class. The TV population has different turnover characteristics to the
computer population, and this means the level of waste generation in any
particular year for these items can vary quite a bit. It is advisable to model each
of these populations separately and establish waste estimates accordingly,
based on their distinct characteristics.
Accumulation of reliable information on import levels, waste flows and current
TV and computer populations and growth trends will be critical to establishing
reliable waste projection baselines into the future.
META ECONOMICS CONSULTING GROUP 20You can also read