Navigating the labyrinth - Socio-economic background and career progression within the Civil Service - GOV.UK
←
→
Page content transcription
If your browser does not render page correctly, please read the page content below
Navigating
the labyrinth
Socio-economic
background and career
progression within
the Civil Service

Research report
May 2021

Navigating the labyrinth
Socio-economic background and career progression
within the Civil Service

                                                   May 2021
About the Commission

The Social Mobility Commission is an independent advisory non-departmental public body established under the
Life Chances Act 2010 as modified by the Welfare Reform and Work Act 2016. It has a duty to assess progress in
improving social mobility in the UK and to promote social mobility in England.

Interim Co-Chairs                         Pippa Dunn                                 Farrah Storr
Steven Cooper                             Co-Founder of Broody, helping              Editor-in-Chief of ELLE UK
Chair of Experian UK and incoming         entrepreneurs and start ups
                                                                                     Jody Walker
CEO of Aldermore Bank Plc                 Sam Friedman                               Director of retail company
Sandra Wallace                            Professor in Sociology at                  TJX Europe
Partner and Joint Managing Director       the London School of Economics
                                                                                     Liz Williams MBE
at law firm DLA Piper                     (from August 2021)
                                                                                     CEO of FutureDotNow,
                                          Harvey Matthewson                          a coalition focused on
Commissioners                             Aviation Activity Officer at Aerobility,   accelerating digital skills
Saeed Atcha MBE                           a charity for disabled people
                                                                                     Sammy Wright
Chief Executive of the charity
                                          Jessica Oghenegweke                        Vice-Principal of Southmoor
Youth Leads UK
                                          Director of Association of                 Academy in Sunderland
Alastair Da Costa                         Apprentices and student
Chair of Capital City College Group       at Brunel University

About the Author

                         Sam Friedman is a Commissioner at the Social Mobility Commission and Professor of
                         Sociology at the London School of Economics (from August 2021). He has published widely
                         on class, culture and social mobility, and recently co-authored ‘The class ceiling: why it pays
                         to be privileged’ (Policy, 2019). He is also the author of ‘Comedy and distinction: the cultural
                         currency of a‘good’ sense of humour’ (Routledge, 2014) and co-author of ‘Social class in the
                         21st century’ (Penguin, 2015). He is currently working on a new book (with Aaron Reeves)
                         looking at the historical development of the British elite, drawing on the entire 120-year
                         database of Who’s Who.

Acknowledgements

This report was written with contributions from Lindsay Turner Trammell, Sasha Morgan, Katherine Wingfield, Craig
Frangleton, Harry Anderson, Megan Dougall, Aaron Reeves, Civil Service People Survey team, Cabinet Office Analysis
and Insight team and Civil Service Inclusive Practice team.

Design work by Sabroso and illustrations by Federica Ciotti.

© Social Mobility Commission copyright 2021
This publication is licensed under the terms                    Any enquiries regarding this publication should
of the Open Government Licence v3.0 except where                be sent to us at
otherwise stated.
                                                                The Social Mobility Commission
Where we have identified any third party copyright              Sanctuary Buildings
information you will need to obtain permission from             20 Great Smith Street
the copyright holders concerned.                                London
                                                                SW1P 3BT.
This publication is available at
https://www.gov.uk/government/organisations/social-             Email
mobility-commission.                                            contact@socialmobilitycommission.org.uk
Navigating the labyrinth: Socio-economic background and career progression within the Civil Service        4

         Table of contents
         Foreword5
         A reflection from the Civil Service’s Social Mobility Champion                               8
         Executive summary                                                                           10
         Introduction                                                                                16
         Methodology21

         Understanding socio-economic diversity
1        in the Civil Service                                                                        27

         How socio-economically diverse is the Civil Service?                                        28

         Barriers to progression:
2        Unpicking the (hidden) rules of the game                                                    38

         2.1 ‘Accelerator roles’ and organisational guides                                           39

         2.2 Exploiting organisational ambiguity                                                     44

         2.3 The London vortex and the ‘Whitehall effect’                                            49

         2.4 Occupational specialisation – policy versus operational                                 53

         2.5 Dominant behavioural codes: studied neutrality
              and the ideal civil servant                                                            58

         2.6 Downplaying privilege                                                                   65

         Cumulative barriers:
3        Connecting socio-economic background to gender
         and ethnicity                                                                               70

         (Not) bringing your whole self to work:
         Women’s experience of social mobility                                                       72

         Experiencing class stereotypes of Blackness                                                 79

         Appendices                                                                                  84
Navigating the labyrinth: Socio-economic background and career progression within the Civil Service         5

Foreword

The Civil Service is both renowned and respected throughout the world, yet
few see inside its ivory towers. Its 445,480 strong workforce, based in towns
and cities across the UK, span everything from customs and benefit officers
to policy chiefs and permanent secretaries. What it takes to ‘make it’ in the
                                                                                                      19%
Civil Service however has, for many years, been unclear.

As one of the largest employers in the country, the Civil Service is a role                     of the SCS
model for fair recruitment and diversity initiatives. Its model practices set                    from low
a benchmark for all employers. The organisation is already recognised for                     socio-economic
its transparency in publishing annual workforce statistics on gender, race                     backgrounds
and disability. But its record on socio-economic diversity has rarely been                        in 1967
scrutinised and not for several decades.

Our report, the first independent data-driven analysis of social background
and career progression in the Civil Service, and a complement to our work on
progression out of low pay, contains some difficult home truths. It shows civil
servants from disadvantaged backgrounds are significantly under-represented
                                                                                                      18%
in the organisation and even if they do “get in” they struggle to “get on”.

Only 18% of senior civil servants are from working-class or low                                 of the SCS
socio-economic backgrounds while the figure is 43% among the most junior                         from low
grades. Strikingly the composition of the Senior Civil Service has barely                     socio-economic
changed since 1967, the last time this data was collected.                                     backgrounds
Those from advantaged backgrounds are also more likely to work in the                             in 2019
Treasury or the Foreign Office, hold policy rather than operational jobs
and work in London, near the centre of political power.
Navigating the labyrinth: Socio-economic background and career progression within the Civil Service                 6

This study is based on data from an internal Civil Service survey which had
                                                                                                 300,000+
around 300,000 respondents. But we have also conducted over 100 hour-long
                                                                                                 respondents
interviews which give deep insights into how people progress in the
Civil Service, how they get to the top and how they subtly use existing                           to the internal
networks. The right accent and a ‘studied neutrality’ seem to win through at                       Civil Service
every stage of their career. Even at the lower end of the profession, progress                    People Survey
is thwarted for those who don’t know the rules.

Emotional detachment and understated self-presentation are seen as the                                over
behavioural hallmarks of senior civil servants, perhaps in contrast to their                          100
political leaders. But this ‘neutral’ behaviour can be both alienating and                          hour-long
intimidating for those from working class backgrounds.                                              interviews
Those working in Ministers’ private offices or who have led during a national
crisis, for example, tend to get promoted, often helped by senior colleagues
with similar cultural and socio-economic backgrounds. Those left behind tend
to be in operational roles – where bottlenecks occur and progress is slower
or non-existent. The barriers to advancement are there from the start.

The Civil Service is acutely aware that it needs to do better. It has made
progress on socio-economic diversity and inclusion and has introduced
blind recruitment techniques to ensure fair competition. However, as the
study shows, getting in is not enough and more action is needed to nurture

                                                                                                 “
career progression.

We set out a bold action plan including getting better data on the Senior                        This report
Civil Service, ensuring equal access to sought after jobs, setting good practice                 should act as
guidance on promotion and providing more access to policy experience.1                           a catalyst for
We propose too an information campaign to break the taboo around talking                         all employers
about social class in the Civil Service.                                                         to shift their
                                                                                                 thinking…

                                                                                                 ”
Ultimately the Social Mobility Commission also believes that socio-economic
background should be enshrined in law as a protected characteristic.

The cross-departmental plan, which would have to be coordinated by the
Cabinet Office, should set targets for the number of Senior Civil Service,
private office and policy roles moved out of London, to help career progression
in the regions.

The barriers to progression identified here extend far beyond the Civil Service.
This report should act as a catalyst for all employers to shift their thinking on
socio-economic inclusion from who ‘gets in’ to who ‘gets on’. And we strongly

1 Please see the accompanying Action plan on socio-economic progression for the Civil Service.
Navigating the labyrinth: Socio-economic background and career progression within the Civil Service   7

believe that the recommendations outlined in our action plan can drive positive
change in a range of different professions.

This isn’t just the ‘right’ thing to do; it’s not just about challenging inequality
of opportunity, wasted talent, continuing class privilege or helping a small
group get to the top. It’s also about building more effective workforces for
everyone. Evidence shows that organisations work better, and are more
creative, when they have people from different backgrounds, offering different
perspectives. This is even more imperative when one’s role, as in the
Civil Service, is to shape what Britain looks like.

These findings make clear that while the Civil Service leads in many ways on
socio-economic diversity and inclusion, more work is urgently needed. The
Commissioners hope the Cabinet Secretary and Chief People Officer will now
endorse our action plan to ensure that the Civil Service leads by example on
diversity and inclusion, encouraging other employers to follow suit. Only then
can we start realising a Britain which truly showcases the skills and talents of
everyone, irrespective of their background.

Steven Cooper and Sandra Wallace
Interim Co-Chairs

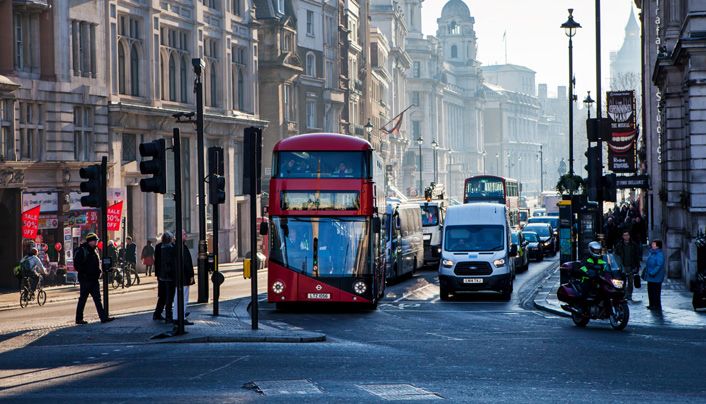
Navigating the labyrinth: Socio-economic background and career progression within the Civil Service   8

A reflection
from the Civil
Service’s
Social Mobility
Champion

Whitehall Street, London

This report from the Social Mobility Commission acknowledges that the
Civil Service has provided strong leadership on improving diversity and
inclusion. In Government, we have a responsibility to reflect the people we
serve, and to harness the broadest range of diverse talent to help us solve
complex problems, innovate and deliver the very best public services.

But there are many areas in which we need to make more progress, and
increasing our socio-economic diversity is one of them.

As Social Mobility Champion, I know that a lot of great work is being done
across the Civil Service to improve socio-economic diversity. We have
overhauled our graduate recruitment programme; extended our outreach and
internship programmes; and begun to introduce mentoring and sponsorship
schemes in many Departments to support people from lower socio-economic
backgrounds. Our social mobility staff networks provide energy and inspiration
for this work. Civil Service organisations feature strongly in the Social Mobility
Foundation’s Social Mobility Employer Index Top 75.

Yet there is clearly more work to do for us to mainstream best practice across
the wider Civil Service. One of the most important steps we have taken is to
strengthen our data and insight on socio-economic diversity. We have worked
Navigating the labyrinth: Socio-economic background and career progression within the Civil Service   9

with the Office for National Statistics, academics, private sector employers and
the SMC to create a set of measures for employers to use to collect data on
the socio-economic background (SEB) of their workforce. In 2019 we included
these measures in our annual Civil Service People Survey, and that allowed
us the unique opportunity to collect what is probably the world’s largest
dataset on workforce socio-economic diversity.

This report offers some important insights. Some of the themes it explores are
ones I have also heard talking to colleagues right across the Civil Service, and
at all grades, about social mobility. The sense that there is a route to the top
that those from more privileged backgrounds find easier to navigate; the more
limited opportunities for advancement for staff in operational roles or who live
outside London; the cumulative barriers experienced by people from working
class backgrounds who are also women or from ethnic minority communities.

We are strongly committed to driving progress on socio-economic diversity in
the Civil Service. No-one should be held back from achieving their full potential
because they come from a less privileged background. We are already acting
on many of the findings and recommendations in this report – for example we
are extending apprenticeships and moving hundreds of Senior Civil Service
jobs out of London. I hope it will help us to focus our efforts on the actions that
will have the most impact.

On behalf of the Civil Service leadership team I’d like to thank the Social
Mobility Commission and Dr Sam Friedman for leading this work.

Bernadette Kelly
Civil Service Social Mobility Champion
Permanent Secretary, Department for Transport
Navigating the labyrinth: Socio-economic background and career progression within the Civil Service   10

Executive summary
Navigating the labyrinth
Navigating the labyrinth: Socio-economic background and career progression within the Civil Service                      11

The Civil Service is one of the country’s largest employers, employing 445,480                            People from
people across the United Kingdom.2 It is a trailblazer for diversity efforts and                         low SEBs in:
aims to be the UK’s most inclusive employer, setting the direction for others
to follow.3 This report, the first ever independent, data-driven investigation                                policy
of how socio-economic background shapes career progression in the
Civil Service is the next chapter in this pioneering approach. It demonstrates
the urgent need to put class and socio-economic inclusivity at the centre
of this drive toward inclusion and fairness. Specifically, we examine the                                    19%
UK’s largest workforce dataset on socio-economic diversity, alongside
over 100 in-depth interviews.

What we found                                                                                              operations

•   Civil servants from disadvantaged backgrounds are significantly
    under-represented in the Civil Service, and even when they ‘get in’
    they struggle to ‘get on’.                                                                               40%
•   Only 18% of senior civil servants are from working class or low
    socio-economic backgrounds.
•   The proportion of senior civil servants from high socio-economic
    backgrounds is higher today than in 1967 (although this partially reflects
    the widespread expansion of professional and managerial jobs since
    the 1960s).4

The evidence shows that those from low socio-economic backgrounds (SEBs)
are less likely to work in areas of the Civil Service that accelerate progression,
notably departments including Her Majesty’s Treasury, professions like policy,
and the roles which give exposure to the political epicentre of Whitehall.

For example:

•   Only 12% of those working at the Treasury are from a low SEB versus 45%
    at the Department for Work and Pensions.
•   Only 19% of those working in policy are from low SEBs versus 40% in
    operational roles (for example, running front-line services).

There are strong regional divides too:

•   Only 22% of London-based civil servants are from working class or low SEBs.
•   This compares to 48% in the north-east.

2 Cabinet Office, Civil Service statistics 2019, 2019. The latest 2020 figures indicate the Civil Service has grown to
456,410 but we use 2019 figures in this report as our analysis draws on the 2019 Civil Service People Survey.
3 Cabinet Office, A brilliant Civil Service, 2017.
4 See Halsey, A. H., Crewe, I. M., Social survey of the Civil Service, The Civil Service 3(1), 1969. Please read the
Introduction for a detailed explanation on how Halsey and Crewe’s methodology differed from ours and why this should
not be considered as a direct comparison.
Navigating the labyrinth: Socio-economic background and career progression within the Civil Service 12
Inside the Banqueting House, Whitehall, with ceiling painted by Peter Paul Rubens
From ceiling to labyrinth
There is a strong ‘progression gap’ within the Civil Service, so that the higher
you progress, the less likely you are to find people from low SEBs. However
there does not appear to be a ‘class ceiling’. Instead, our analysis suggests In this report
that a more apt metaphor is the idea of the Civil Service as a ‘labyrinth’. we use ‘socio-
economic
This reflects both the size and complexity of the Civil Service and the fact that progression gap’
progression is rarely simple or direct. While there is a viable route to the centre to convey that
for everyone, this route is largely hidden; there is a formal set of guidelines the higher you
around progression and an informal set of rules and norms. And while formal progress in the
processes around progression are often highly sensitive to issues of diversity Civil Service,
and inclusion, our interviewees explain that it is mastery of the unwritten rules the less likely
that provide the most effective roadmap through the labyrinth. Moreover, it is you are to find
in unpicking these hidden rules where those from low SEBs face the strongest people from
barriers and those from high SEBs have the greatest advantages. low SEBs;
they become
further under-
The unwritten rules of progression represented at
The first of these unwritten rules is that securing certain high profile jobs every grade of
leads to fast-tracked progression. These roles give exposure to Ministers and seniority.
senior officials – notably in private office, the ‘central’ departments, running
a bill team, securing a leading role during a national crisis, or as a Minister’s
private secretary. Yet knowledge of these so-called ‘accelerator roles’ is
often contingent on access to ‘organisational guides’: senior colleagues
who help navigate the hidden rules of the labyrinth. We find that these guide
relationships are often forged on the basis of cultural similarity and, as senior
staff are disproportionately from advantaged backgrounds, this tends to benefit
those from high SEBs.Navigating the labyrinth: Socio-economic background and career progression within the Civil Service 13 Peace Gardens and Town Hall in Sheffield, Yorkshire Second, in negotiating progression opportunities, civil servants routinely face situations where formal career guidance is unclear. These ‘grey areas’ include interactions with hiring managers, requests for promotion, threats to leave, and embellishing job applications. While those from higher SEBs tend to exploit the ambiguity of these ‘interpretative moments’ and cultivate opportunities, those from lower SEBs often report confusion or ethical discomfort. But the hidden rules do not just revolve around who you know and how you deal with uncertainty but also where you work. Physical proximity to Ministers via the Civil Service’s Whitehall offices remains critical for building ‘visibility’ and top-grade posts are still disproportionately located in central London. However, the ability to access a London ‘career track’ is stratified by socio-economic background; those from low SEBs who grow up outside of London and the south-east tend to ‘sort’ into regional positions because they lack the economic resources to migrate to the capital and often have cultural and familial reasons for wanting to stay where they grew up. Fourth, we find that those from low SEBs often opt into operational career tracks which have clear bottlenecks and therefore limit progression. Some join at lower operational grades and become locked into operational tracks, while others join at higher grades but still sort into operational roles as they see the skillset as more transparent, tangible and meritocratic. Another key reason for this occupational sorting is that many from low SEBs see policy work as dependent on mastering a behavioural code – what we call ‘studied neutrality’ – that tilts in favour of those from advantaged backgrounds.
Navigating the labyrinth: Socio-economic background and career progression within the Civil Service                   14

Studied neutrality has three key dimensions:

1 a particular received pronunciation (RP) accent and style of speech

2 emotionally detached and understated self-presentation

3 an intellectual approach to culture and politics that prizes the display
  of in-depth knowledge for its own sake (and not directly related to work)

Those from low SEBs find this code alienating and intimidating but one
which they must assimilate in order to succeed.

We also find evidence that those from advantaged backgrounds often
downplay or deflect their socio-economic privilege. Specifically, we show that 1
in 4 of those who self-assess as coming from low SEBs have actually had                                    1 in 4
advantaged upbringings. Interviews reveal that this is rooted in ‘origin stories’                          of those who
where people reach back beyond their own upbringing to locate their                                       self-assess as
background in extended family histories of working class struggle or upward                                coming from
mobility. Yet this often blinds them from considering the socio-economic                                 low SEBs have
advantages they have enjoyed, or the role their actions may play in erecting                               actually had
socio-economic barriers to progression.                                                                    advantaged
Finally, we also identify specific barriers to progression for women and Black                             upbringings
(African/African Caribbean) civil servants from low SEBs. While White men
from low SEBs often consciously draw on their working class background in
developing their personal ‘brand’, women from low SEBs are much more likely
to conceal their backgrounds at work, reporting that ‘bringing their whole self
to work’ only leaves them vulnerable to negative judgement from colleagues.
In addition, Black civil servants report routinely battling classed stereotypes
of Blackness that are both offensive and bear no resemblance to their actual
lives and experiences.

The action plan               See the full plan

These findings make clear that while the Civil Service continues to lead
in many ways, when it comes to socio-economic diversity and inclusion,
more work is needed. We have drawn from our wider work on progression,
including our work on progression out of low pay, and our experience helping
employers address progression, as well as consultations with key Civil Service
stakeholders, to create an action plan for the Civil Service.5, 6, 7

5 Social Mobility Commission, Learning ladders: adult training and progression out of low pay, 2020.
6 Social Mobility Commission, Increasing in-work training and progression for frontline workers, 2020.
7 View our resources for employers on progression here: https://socialmobilityworks.org/toolkit/progression/.
Navigating the labyrinth: Socio-economic background and career progression within the Civil Service          15

To achieve change, we have identified 14 actions that we believe should form
                                                                                                      14
the basis of a Civil Service action plan and associated programme of work to                      actions
tackle disparities in progression. The recommended action plan is published
                                                                                                 should form
as an accompanying document to this report.
                                                                                                the basis of a
The cross-departmental plan will need the endorsement of the Cabinet                             Civil Service
Secretary and the Chief People Officer and effective coordination by Cabinet                     action plan
Office. The programme will need resources and authority to drive change and
hold individual departments to account.

The key components of the plan are:

•   improving data to better understand how socio-economic background
    shapes progression pathways and the composition of the Senior Civil
    Service (SCS)

•   equalising access to information about accelerator roles; providing specific
    guidance on good practice in the ‘grey areas’ that surround promotions

•   demystifying policy work and providing opportunities for lower grade
    operational staff to get policy experience

•   adapting and evolving the Places for Growth initiative to reduce the
    possibility that it limits opportunities for lower SEB staff already in London

•   using an information and communications campaign to break the taboo
    around talking about social class within the Civil Service

•   tackling culture and behavioural codes that can favour polish over
    performance, particularly in development schemes

Where next?
The Commission will remain interested and engaged in the Civil Service’s
response to our findings. The conclusion of our work acknowledges
powerful inter-linking issues. Certain aspects of Civil Service improvement
may necessitate the evolution of the UK’s current parliamentary practices.
We hope to engage Parliamentary authorities to conduct a complementary
report on Parliament’s wider workforce, to ensure that our nation’s political
epicentre is also actively promoting socio-economic diversity and inclusion.
Navigating the labyrinth: Socio-economic background and career progression within the Civil Service 16 Introduction In contemporary Britain it quite literally pays to be privileged. Even when those from low socio-economic backgrounds (SEBs) gain access to professional occupations, they go on to earn on average 17% less than colleagues from 17% more advantaged backgrounds – a ‘class pay gap’ that persists even when less they have same education, training and experience.8 But what does this class pay gap mean for employers? Are staff from working average ‘class class backgrounds unfairly held back in their careers? Do they face a ‘class pay gap’ of ceiling?’ And, if so, how should employers respond? people from The Civil Service is uniquely placed to address these questions. While reaching low SEBs the top of the Civil Service was historically tied to socio-economic background, a series of reforms introduced after World War 2 explicitly aimed to open up the route to the top.9, 10, 11 These reforms were partially successful; in 1929 only 8 The Social Mobility Commission State of the nation, 2019; The Social Mobility Commission, The Class Pay Gap and Intergenerational Worklessness, 2017; Friedman, S. and Laurison, D. The Class Ceiling, 2019. 9 The most prominent of these was the establishment of the Civil Service Selection Board (CSSB) in 1945 which aimed to provide a meritocratic process for selecting senior administrators to the Civil Service Fast Stream. It was further reformed in 1982 after Sir Alec Atkinson recommended that there should be greater emphasis on attracting candidates from a wider social pool (Hennessy, P. Whitehall, 1981: 512–520). 10 Several studies document how the higher Civil Service was dominated by those from private schools and professional and managerial backgrounds in the 1920s, 1930s, 1940s and 1950s (Kelsall, R. Recruitment to the higher Civil Service: how has the pattern changed, 1974; Guttsman, W. L. The British political elite and the class structure, 1974; Boyd, D. Elites and their education, 1973; Heath, A. Social mobility, 1980). 11 Boyd also finds a slight increase over time in the openness of the higher Civil Service between 1939–1970 (Boyd, D. Elites and their education, 1973).
Navigating the labyrinth: Socio-economic background and career progression within the Civil Service                    17

7% of senior civil servants came from low SEBs, this rose to 19% by 1967.12
However, the very top echelons of the Senior Civil Service remain dominated by
those from extremely privileged backgrounds. For example, our joint work with
the Sutton Trust, Elitist Britain, showed as recently as 2019 that 59% of serving
permanent secretaries had attended an independent school.13

Yet we know little about how these trends connect to the wider Civil Service
workforce. In addition the last time data was collected on the class
backgrounds of all senior civil servants was 1967.

Certainly, a strong commitment to increasing social mobility has
                                                                                                             15
continued in recent years.14 Not only has the Civil Service consistently placed
                                                                                                       government
multiple government departments within the top 75 of the Social Mobility
                                                                                                       departments
Employer Index (15 in 2020), it has also made pioneering changes to improve
                                                                                                       placed within
socio-economic diversity within its flagship graduate development
                                                                                                     the top 75 of the
programme – the Civil Service Fast Stream. It has developed a set of
                                                                                                      Social Mobility
questions that all employers can use to identify socio-economic
                                                                                                       Foundation’s
background, and the Social Mobility Commission has further advanced
                                                                                                      Social Mobility
the guidance.15, 16, 17, 18, 19
                                                                                                      Employer Index
From access to progression                                                                                in 2020

The Civil Service has devoted considerable energy to address these issues.
So far these interventions have especially focused on outreach,attraction and
hiring. Indeed, Civil Service recruitment is built on fair and open competition,
made on merit, and have extensive processes designed to achieve this. This
is not surprising. Most politicians, academics, policymakers and employers
currently tend to conceptualise social mobility as an issue of who ‘gets in’.

 12 Halsey and Crewe look here at civil servants’ fathers’ occupations and compare the proportion of those with fathers
 in ‘professional, managerial and technical occupations’, ‘skilled non-manual occupations’ and ‘skilled, semi-skilled and
 unskilled manual occupations’. It should be acknowledged that although the socio-economic composition of the SCS
 remains broadly the same as in 1967, the occupational structure of the UK has changed significantly in the last 50 years.
This means that the socio-economic origins of those in the UK population in 1967, what might be termed the recruiting
‘pool’ for the SCS, included a much higher percentage of those from working-class origins (Halsey, A. H. and Crewe, I. M.,
 Social survey of the Civil Service, The Civil Service 3(1), 1969).
13 Social Mobility Commission and the Sutton Trust, Elitist Britain, 2019.
14 https://www.gov.uk/government/speeches/improving-social-mobility-in-the-uk-civil-service-and-beyond.
15 Cabinet Office, Measuring socio-economic background in your workforce: recommended measures for use by
employers, 2018.
16 Cabinet Office, Socio-economic diversity in the Fast Stream: the Bridge report, 2016.
17 The Social Mobility Foundation, Social Mobility Employer Index, 2020.
18 The Civil Service has also pioneered internal changes such as creating board-level champions, creating departmental
social mobility networks and building a cross-government social mobility action plan.
19 See https://socialmobilityworks.org/toolkit/measurement/.
Navigating the labyrinth: Socio-economic background and career progression within the Civil Service 18
Yet there is a danger of reducing social mobility to the issue of access. It
assumes that the impact of socio-economic background finishes when a
person enters an organisation or career. We believe it is imperative that
employers start to challenge this assumption; to interrogate socio-economic
diversity within organisations and how socio-economic background shapes Employers
career progression.20, 21 should shift
the socio-
With this project, we take a significant stride toward filling this gap; shifting economic focus
the socio-economic focus from access to progression; from who ‘gets in’ to from access to
the Civil Service to who ‘gets on’. progression
And to conduct this analysis, we used the Civil Service’s 2019 Civil Service
People Survey (CSPS). This dataset was the first that incorporated socio-
economic background questions and furnished us with the ability to provide
a wide-ranging socio-economic analysis of over 300,000 civil servants.
We first show that those from higher socio-economic backgrounds are not
only over-represented in the Civil Service as a whole, but that this skew is
particularly acute in certain work locations such as London, departments like
Treasury or DCMS, and in professions like policy.
20 This gap was identified by the APPG on Social Mobility who recommended in 2019 that the Civil Service should ‘look
specifically at progression, performance, and pay, to lead by example for other professions’.
21 See the Social Mobility Commission’s 2020 Financial and professional services toolkit as one example of this effect
outside of the Civil Service.Navigating the labyrinth: Socio-economic background and career progression within the Civil Service 19
We also find that those from advantaged backgrounds dominate the
Senior Civil Service; 72% are from higher socio-economic backgrounds.
Tellingly, this is higher than in 1967, the last time such data was collected.22
This contrasts strongly with gender and ethnic-minority representation, where
72%
the Civil Service has become significantly more representative over time.
The percentage of senior civil servants who are women, for example, has
grown steadily from 17% in 1996 to 45% in 2019 (and to 46% in 2020), in the SCS
and the representation of Black and minority ethnic senior civil servants has from higher
grown from 4% to 8% from 2006 to 2019 (and to 9% in 2020).23 socio-economic
backgrounds
Second, the report draws on over 100 in-depth interviews to explore the
drivers of the socio-economic progression gap. Here our analysis suggests
seven unwritten rules of progression that act as barriers for those from low
SEBs and enablers for those from high SEBs:
1 access to informal guides and accelerator career tracks
2 negotiated opportunities in moments of organisational ambiguity
3 the ‘Whitehall effect’
4 bottlenecks in operational career tracks
5 dominant behavioural codes
6 downplaying of socio-economic privilege
7 cumulative barriers (for women and Black civil servants from working
class backgrounds)
A note on comparing change over time
It should be acknowledged that the 1967 analysis of the Senior Civil
Service we report on here differs from our analysis in three ways; first,
they looked at only civil servants’ fathers’ occupations rather than the
occupation of the main breadwinner when the respondent was 14 as we
do here (although Labour Force Survey analysis suggests that in 80%
of cases this is still the father – see footnote 30); second, they used an
occupational schema, The Registrar General’s Social Class (RGSC),
that was replaced by the NS-SEC schema in 2001. The formulation of
22 This analysis was undertaken at the request of the Fulton Committee by Halsey and Crewe and makes up
Volume 3(1) of the Fulton Report. It is based on a representative sample survey sent to 5,187 civil servants, which yielded
a 96% response rate (Halsey, A. H. and Crewe, I. M., Social survey of the Civil Service, The Civil Service 3(1), 1969).
23 Institute for Government, Gender balance in the Civil Service, 2020; Institute for Government, Ethnicity in the
Civil Service, 2020; Cabinet Office, Civil Service Statistics 2019, 2019; Cabinet Office, Civil Service Statistics 2020, 2020.Navigating the labyrinth: Socio-economic background and career progression within the Civil Service 20 the socio-economic classes in these schemes are based on different theoretical assumptions (see footnote 33) but are broadly similar when collapsed to a three-class schema. Analysts have estimated a continuity level of 87% across the two occupational schemas. Third, and most significantly, the occupational structure of the UK has changed significantly in the last 50 years; in particular there has been a widespread expansion of professional and managerial jobs and a contraction of manual working-class jobs. This means that the socio- economic origins of those in the UK population in 1967, what might be termed the recruiting ‘pool’ for the SCS, included a much higher percentage of those from working-class origins. Indeed, if we estimate the relative rates of mobility into the SCS using occupational class data collected 15–20 years before the Kelsall data (1951) and our data (2002) then it seems that the odds ratio of reaching the SCS from professional/ managerial backgrounds as opposed to non-professional/managerial backgrounds has fallen by ~50%, suggesting that the chances of reaching the SCS for a child born into a non-professional family have increased. This could also be evidenced by another measure of privilege, the percentage of SCS who are privately educated, which has decreased over time. In 1967, for example, 37% of the SCS were privately educated compared to 25% today. Over that period, the proportion of the population who were privately educated stayed stable at around 7%, although other changes to schooling – notably the prominence of grammar schools – have occurred. It is important to remember here, however, that it is difficult to compare these different measures and this means any direct comparisons should be approached with caution. Nonetheless, we do think Halsey and Crewe’s analysis indicates that the overall socio-economic composition of the SCS has remained broadly stable over time, even if this does not necessarily mean it is as closed or exclusive in terms of recruitment.24 24 See Halsey, A. H. and Crewe, I. M., Social survey of the Civil Service, The Civil Service 3(1), 1969; Kelsall, R., Recruitment to the higher Civil Service: how has the pattern changed, 1974 and Kelsall, R., Higher civil servants in Britain, 1955; for more on changes in the occupational structure see Bukodi, E. and Goldthorpe, J., Social mobility and education in Britain: Research, politics and policy, 2018; for more on differences between RGSC and NS-SEC classifications see Pevalin, D. and Rose, D., ‘The National Statistics Socio-economic Classification: unifying of social and sociological approaches to the conceptualisation and measurement of social class in the United Kingdom, 2002.
Navigating the labyrinth: Socio-economic background and career progression within the Civil Service                        21

Methodology

This research took place in two stages. First, we analyse social mobility
into, and within, the Civil Service.25 This data includes 308,556 respondents
(approx. 67% of all civil servants). It thus allows us to quantitatively analyse
not only the socio-economic composition of the Civil Service as a whole,
                                                                                                            67%
but to provide a more granular lens on how this composition varies by gender,
ethnicity, region, department, profession and grade.26
                                                                                                            of all civil
The CSPS measures the socio-economic background of civil servants                                           servants
in four ways:                                                                                             took part in

•   type of school attended                                                                                the CSPS

•   parental educational attainment
•   self-assessment of socio-economic background
•   parental occupation

In this report we focus on parental occupation. We do this for several reasons;
it provides a symmetrical view of civil servants’ social mobility (comparing their
own occupation to that of their parents), it allows us to analyse those who
have disadvantaged and advantaged socio-economic backgrounds, it allows
us to benchmark against wider labour force and historical Civil Service data,
and it is the ‘key question’ that the Social Mobility Commission recommends

25 While we requested the analyses detailed in this report, the CSPS data was analysed by the CSPS survey team due
to privacy and operational concerns.
26 Completion of the CSPS is not compulsory for civil servants but the response rate is high at 67% (308,556/462,963).
Note, these figures do not reconcile with Official Statistics about the size of the Civil Service due to different decisions
about who is invited to participate in the People Survey and who is counted in Official Statistics. See https://assets.
publishing.service.gov.uk/government/uploads/system/uploads/attachment_data/file/867302/Civil-Service-People-Survey-
2019-Technical-Guide.pdf.
Navigating the labyrinth: Socio-economic background and career progression within the Civil Service 22 employers adopt when measuring socio-economic background.27, 28 We include supplementary analyses using the other socio-economic background measures in the Appendix. What is the Civil Service? The Civil Service is co-ordinated and managed by the Prime Minister, and accountable to the public. As an organisation, it’s politically impartial and independent of government. Civil servants work in central government departments, agencies, and non-departmental public bodies (NDPBs). 29 The Civil Service provides services directly to people all over the country, including: • paying benefits and pensions • running employment services • running prisons • issuing driving licences • staff also work on policy development and implementation The Civil Service does not include government Ministers (who are politically appointed), members of the British Armed Forces, the police, officers of local government or NDPBs of the Houses of Parliament, employees of the National Health Service (NHS), or staff of the Royal Household. To measure parental occupation we refer to the CSPS question asking the occupation of the respondent’s main income-earning parent when they were 14.30 95% of respondents answered this question and 70% disclosed a characteristic.31 Based on answers to this question we then group civil servants’ parental occupation into the simplified three-class schema of the National Statistics Socio-economic Classification (NS-SEC) devised by the Office for National Statistics (ONS). Table 1 highlights example occupations in each of these three NS-SEC classes. 27 In contrast, measures such as school type (where focus is on private school attendance) and FSM eligibility tap only fairly extreme advantage or disadvantage. 28 See https://socialmobilityworks.org/toolkit/measurement/. 29 Civil Service, About us, Accessed March 2020. 30 According to LFS data in over 80% of cases this is the occupation of the father – see Friedman and Laurison, The class ceiling , 2020. 31 ‘Disclosing a characteristic’ means those selecting a response other than ‘prefer not to say’ or ‘don’t know’.
Navigating the labyrinth: Socio-economic background and career progression within the Civil Service                      23

York, North Yorkshire

In the report we refer to those whose parents did ‘professional or managerial’
occupations as coming from ‘high’, ‘privileged’ or ‘advantaged’ socio-economic
or class backgrounds. Those whose parents did ‘intermediate’ occupations
we refer to as ‘short-range socially mobile’. Finally, we refer to those
whose parents did ‘routine, semi-routine, lower supervisory and technical’
occupations, or whose parents ‘never worked’, as coming from ‘low’, ‘working
class’ or ‘disadvantaged’ socio-economic backgrounds.32, 33

We use the terms low SEB and working class background interchangeably
because while ‘socio-economic background’ is the dominant term used
within the Civil Service and in many organisations, this term often does not
resonate with people’s own experience of their background. In contrast, the
term working class remains popular and, for many, an important source of
identity and pride. Moreover, the term working class background is often used
in Social Mobility Commission and other academic research that draws on
NS-SEC categories.

32 We acknowledge that there is some conceptual ambiguity surrounding the meaning of these terms. However, we think
these terms are useful in clarifying the relational distinction between the three origin groups we examine here, and are all
widely used in academic literature on social mobility.
33 The NS-SEC aims to differentiate positions within labour markets in terms of both their income, economic security
and prospects of economic advancement, and their ‘work situation’. Work situation refers primarily to location in systems
of authority and control at work, although degree of autonomy at work is a secondary aspect. It distinguishes three
forms of employment regulation: service relationship (where the employee renders service to the employer in return for
compensation, which can be both immediate rewards (for example, salary) and long-term or prospective benefits (for
example, assurances of security and career opportunities); labour contract (where the employee gives discrete amounts
of labour in return for a wage calculated on the amount of work done or time worked; and intermediate (where forms of
employment regulation combine aspects from both the service relationship and labour contract).
Navigating the labyrinth: Socio-economic background and career progression within the Civil Service                  24

Table 1 What occupations are in each category? (ONS National Statistics
Socio-economic Classification example occupations)

  Classification                             Example occupations

   Professional/managerial                   accountant, solicitor, medical practitioner, scientist, civil/
   SEB; those whose parents                  mechanical engineer, finance manager, chief executive,
   were in this category are                 large business owner, teacher, nurse, physiotherapist,
   referred to as ‘advantaged’,              social worker, musician, police officer (sergeant or above),
  ‘privileged’ or ‘high                      software designer, bank manager
   socio-economic background’

  Intermediate SEB                           secretary, personal assistant, call centre agent, clerical
                                             worker, nursery nurse, small business owner (who
                                             employed less than 25 people such as: corner shop
                                             owner, small plumbing company, retail shop owner, single
                                             restaurant or cafe owner, taxi owner, garage owner)

  Working class SEB; those                   postal worker, machine operative, security guard, caretaker,
  whose parents were in this                 farm worker, catering assistant, sales assistant, HGV driver,
  category are referred to                   cleaner, porter, packer, labourer, waiter/waitress, bar staff,
  as ‘working class’ or ‘low                 motor mechanic, plumber, printer, electrician, gardener,
  socio-economic background’                 train driver

The second stage of the project aimed to explore civil servants’ experience
of career progression and understand what barriers or enablers those from
different backgrounds faced in pursuing their careers. To examine these issues
we first conducted 12 preliminary interviews with social mobility stakeholders
within the Civil Service before moving on to undertake 104 in-depth interviews
with civil servants at Grade 7 and above in four departments – HM Treasury
(HMT), HM Revenues and Customs (HMRC), Cabinet Office (CO) and
Department for Transport (DfT). Departments were chosen to reflect variations
in the socio-economic diversity, grade makeup and occupational specialisation
across the Civil Service.34

34 As Figure 3 shows, HMT is the most socio-economically exclusive department, HMRC is one of the most
socio-economically diverse departments, and DfT and CO are ‘average’ performers, sitting in the middle of the
Civil Service departments. HMT is also dominated by higher-grade civil servants and has a strong policy focus, as does
CO, whereas HMRC and DfT have a strong operational focus, and HMRC employs a large percentage of civil servants
at junior grades.
Navigating the labyrinth: Socio-economic background and career progression within the Civil Service 25
Table 2 The grade structure of the Civil Service
Senior Civil Service (SCS)
the highest grades that make up the senior
management team. There are four grades
within the SCS. Generally, deputy
directors (DD) report to directors, who are
SCS
responsible for the work of their team.
Director generals oversee the directors
and work closely with the department’s
Grades 6 and 7 Ministers. Each department also has a
experienced officials permanent secretary as part of the SCS
with significant who supports the Minister at the head of
responsibilities. the department, acts as the accounting
officer and is responsible for the day-to-day
running of the department.
Senior executive officer / higher
executive officer (SEO / HEO)
includes policy officers and officials
with specific responsibilities.
Executive officer (EO)
this grade offers business and policy support
(e.g. executive assistants, finance, HR, IT
and communications specialists).
Administrative officer / administrative assistant (AO / AA)
the most junior Civil Service grade (e.g. administrative support
and operational delivery roles, such as prison officers and caterers).
As Table 2 illustrates, we grouped grades into five broad Civil Service
categories. We chose to concentrate interviews on Grade 7 and above to keep
a focus on progression into and within the Senior Civil Service, and to keep
the scope of the study manageable.35
To recruit interviewees, articles asking for volunteers were placed on each of
the four participating departments’ intranet page. 659 civil servants from Grade
7 and above volunteered to be interviewed and from this an interview sample
was constructed that was broadly representative of each department in terms
of gender, ethnicity, age and region of origin. The demographic contours of the
interview sample is included in the Appendix.
35 This is not to say that there may not be important socio-economic barriers to progression at more junior grades and,
to this end, we would welcome future work examining such questions.Navigating the labyrinth: Socio-economic background and career progression within the Civil Service 26
Interviews were conducted online between June and October 2020.
81 of the interviews were conducted by Dr Sam Friedman and 23 of them
were conducted by a team of four social researchers from HMRC. The
interview topic guide (see the Appendices) was structured over four sections:
• We began with a set of questions that probed interviewees’ socio-economic
background (using all four of the questions included in the CSPS –
see Methodology).
• Second, we asked interviewees to describe their career trajectories
to date, allowing them to narrate the key moments and crucial junctures
in their own words.
• Third, we asked a number of more specific questions about their career,
about the culture of the Civil Service and the Senior Civil Service, and
whether they feel their career has been held back in any way.
• Finally, we ended each interview by briefly explaining the progression
gap in the Civil Service (Figures 4 and 5), which show that the higher
you progress, the less likely you are to find people from low SEBs,
and we asked for their reactions and reflections on this finding.
All interviewees have been anonymised in this report and names replaced
with pseudonyms.SECTION 1 Understanding socio-economic diversity in the Civil Service
Section 1   Understanding socio-economic diversity in the Civil Service   28

How socio-
economically
diverse is the
Civil Service?

The Cabinet Office

Key findings

• People from high SEBs are significantly over-represented in
  the Civil Service; 54% are from high SEBs compared to 37%
  in the UK workforce.

• The London-based workforce is significantly less socio-economically
  diverse; 66% are from high SEBs compared to 41% in the
  north-east.

• Those from low SEBs are particularly under-represented
  in departments such as Treasury and DCMS, and within
  the policy profession.

• Even when those from lower socio-economic backgrounds ‘get in’
  they struggle to ‘get on’; the Civil Service becomes more socially
  exclusive at every grade.
Section 1   Understanding socio-economic diversity in the Civil Service                                       29

Figure 1 shows that over half of Civil Service staff are from advantaged
professional or managerial backgrounds, while a third are from working class
backgrounds. To place this in a comparative context, Figure 1 also shows
the socio-economic makeup of the UK workforce, the public sector and those
working in other professional and managerial occupations – drawing on data
from the ONS Labour Force Survey.

Figure 1 Parental occupation of civil servants, UK workforce,                              The Civil Service
professional/managerial occupations and public sector                                      is more socio-
                                                                                           economically
   Civil Service                                                                           advantaged
                           34%              12%                        54%
     workforce
                                                                                           than the UK
UK professional                                                                            workforce
 or managerial          28%                 23%                           49%
     workforce

  Public sector
                           34%                    24%                        42%
    workforce

 UK workforce36              39%                      24%                       37%

                   Low SEB         Intermediate SEB         High SEB

This shows that the Civil Service has significantly more staff from high SEBs
than any of these comparison groups. For example, 54% of civil servants are
from advantaged professional/managerial backgrounds compared to 37% in
the national workforce. The proportion of civil servants from working class
backgrounds is also significantly lower than in the UK workforce.

Considering the size and complexity of the Civil Service it is important to look
at how its socio-economic composition varies according to region, department,
profession and grade. This more fine-grained analysis is telling. Figure 2
shows, for example, that civil servants from disadvantaged backgrounds are
particularly under-represented in London; only 22% are from working class
backgrounds compared to 48% in the north-east. There is also a ‘north-south
divide’ here, with the three most socio-economically exclusive work regions
located in the south of England and two of the three most socio-economically
open areas located in the north of England.

36 Social Mobility Commission, Simplifying how employers measure socio-economic background: An accompanying
report to new guidance, 2020 (updated 2021).
Section 1 Understanding socio-economic diversity in the Civil Service 30
Figure 2 Work location of civil servants by parental occupation London-based
civil servants
London 22% 12% 66%
are significantly
South-West England 31% 12% 57% more socio-
South-East England 33% 12% 55% economically
East of England
advantaged
37% 12% 51%
Scotland 39% 11% 51%
Yorkshire and
40% 12% 48%
the Humber
Northern Ireland 39% 15% 47%
Wales 41% 12% 47%
East Midlands 40% 12% 47%
North-West England 42% 13% 46%
West Midlands 43% 12% 45%
North-East England 48% 11% 41%
Low SEB Intermediate SEB High SEB
Next we look at variation by department. Figure 3 shows that socio-economic
variation is even more marked here; HM Treasury, the Department for
Exiting the European Union and the Department for Digital, Culture, Media
& Sport have a very low representation of staff from low SEBs – around
1 in 10 – whereas in HM Revenue & Customs and the Department for
Work and Pensions their representation is similar to those from advantaged
backgrounds.37 This differential holds even within departments’ SCS,
though we note that no departments’ SCS makeup is representative
of the national population.38
Looking at the type of school attended also shows strong departmental
differences. As Appendix Figure 2 shows, 26% of Treasury staff and 22% of
Foreign & Commonwealth Office staff (rising to 48% among FCO SCS) were
privately educated versus just 5% in HM Revenue & Customs and 4% in the
Department for Work and Pensions.
37 It is important to note that since the data was collected some departments, such as DEXEU, have disbanded and
others, such as FCO and DFID, have merged.
38 At Treasury those from high SEBs rises at SCS level to 82%.Section 1 Understanding socio-economic diversity in the Civil Service 31
Finally, we also see strong socio-economic variation according to whether
civil servants work in policy or operational roles.39 The policy profession
(which represents the work area of 8% of those in the CSPS) is notably less
socio-economically diverse, with 70% of staff from professional/managerial
backgrounds and only 19% from working class backgrounds. In contrast, only
47% of those in operational roles (who make up 54% of the CSPS) are from
high socio-economic backgrounds and 40% are from low socio-economic
backgrounds. It is worth noting here that the CSPS survey team were unable
to provide data on the socio-economic composition of other professions and
functions due to problems in coding and self-reporting.
Figure 3 Civil service departments by parental occupation40 The Treasury is
the most socio-
HM Treasury 12% 10% 77%
economically
Department for Exiting the European Union 10% 11% 77% exclusive
Department for Digital, Culture, Media and Sport 13% 10% 76% department
Department for Business, Energy
17% 12% 71%
and Industrial Strategy
Department for International Trade 16% 14% 69%
Foreign & Commonwealth Office 19% 11% 69%
Department for Transport 19% 11% 68%
Department for International Development 22% 12% 67%
Cabinet Office 22% 12% 67%
Department of Health and Social Care 21% 11% 66%
Ministry of Housing, Communities
23% 12% 66%
& Local Government
Department for Environment,
22% 13% 65%
Food and Rural Affairs
Department for Education 29% 13% 59%
Ministry of Defence 35% 11% 54%
Home Office 34% 12% 54%
Ministry of Justice 37% 13% 50%
HM Revenue & Customs 42% 12% 46%
Department for Work and Pensions 45% 12% 43%
Low SEB Intermediate SEB High SEB
39 Due to problems coding which professions and functions civil servants belong to, we were unable to identify the
socio-economic composition of other professions. We make recommendations on this in our accompanying Action plan
on socio-economic progression for the Civil Service.
40 It is important to note that since the data was collected some departments, such as DEXEU, have disbanded and
others, such as FCO and DFID, have merged.You can also read