Navigating transfer pricing risk in the oil and gas sector
←
→
Page content transcription
If your browser does not render page correctly, please read the page content below
ISSN 1728-5445

 SERIES

STUDIES AND PERSPECTIVES 101

 ECLAC SUBREGIONAL
 HEADQUARTERS
 FOR THE CARIBBEAN

 Navigating
 transfer pricing
 risk in the oil
 and gas sector
 Essential elements
 of a policy framework
 for Trinidad and Tobago
 and Guyana

 Sheldon McLean
 Don Charles
 Antonio Rajkumar
Thank you for your interest in
 this ECLAC publication

 ECLAC
 Publications

 Please register if you would like to receive information on our editorial
products and activities. When you register, you may specify your particular
areas of interest and you will gain access to our products in other formats.

 Register

 www.cepal.org/en/publications

 facebook.com/publicacionesdelacepal

 Publicaciones
 www.cepal.org/apps
101

 Navigating transfer pricing
risk in the oil and gas sector
 Essential elements of a policy
framework for Trinidad and Tobago
 and Guyana
 Sheldon McLean
 Don Charles
 Antonio Rajkumar
This document has been prepared by Sheldon McLean, Coordinator of the Economic Development Unit of the
Economic Commission for Latin America and the Caribbean (ECLAC) subregional headquarters for the Caribbean,
and Don Charles, energy consultant, with assistance from Antonio Rajkumar, individual contractor at the ECLAC
subregional headquarters for the Caribbean.
The views expressed in this document, which has been reproduced without formal editing, are those of the authors
and do not necessarily reflect the views of the Organization.

United Nations publication
ISSN: 1728-5445 (electronic version)
ISSN: 1727-9917 (print version)
LC/TS.2021/10/Rev.1
LC/CAR/TS.2021/3/Rev.1
Distribution: L
Copyright © United Nations, 2021
All rights reserved
Printed at United Nations, Santiago
S.21-00247

This publication should be cited as: S. McLean, D. Charles and A. Rajkumar, “Navigating transfer pricing risk in the oil and gas
sector: essential elements of a policy framework for Trinidad and Tobago and Guyana”, Studies and Perspectives series-ECLAC
Subregional Headquarters for the Caribbean, No. 101 (LC/TS.2021/10/Rev.1-LC/CAR/TS.2021/3/Rev.1), Santiago, Economic
Commission for Latin America and the Caribbean (ECLAC), 2021.

Applications for authorization to reproduce this work in whole or in part should be sent to the Economic Commission for
Latin America and the Caribbean (ECLAC), Documents and Publications Division, publicaciones.cepal@un.org. Member States
and their governmental institutions may reproduce this work without prior authorization, but are requested to mention the
source and to inform ECLAC of such reproduction.
ECLAC - Studies and Perspectives series-The Caribbean No. 101 Navigating transfer pricing risk... 3

Contents

Abstract................................................................................................................................................ 7
Introduction ........................................................................................................................................ 9
I. Hydrocarbon industry in Trinidad and Tobago and Guyana................................................... 13
 A. Hydrocarbon industry in Trinidad and Tobago................................................................... 13
 B. Hydrocarbon industry in Guyana ....................................................................................... 15
 C. The transfer pricing problem ............................................................................................. 16
II. Oil and gas global value chain ................................................................................................. 17
 A. Crude oil global value chain ............................................................................................... 17
 B. Natural gas global value chain ...........................................................................................20
III. Oil vs gas markets and pricing ................................................................................................. 23
 A. Oil markets and pricing ..................................................................................................... 23
 B. Natural gas regional markets and pricing ..........................................................................24
 1. Indexation/cost plus pricing ....................................................................................... 25
 2. Gas-on-gas competition ............................................................................................26
IV. Taxation modalities: oil and gas industries ............................................................................ 27
 A. Licenses ............................................................................................................................ 27
 1. Concessionary system ............................................................................................... 27
 2. Production sharing contracts ..................................................................................... 27
 3. Service contracts .......................................................................................................28
 B. Taxes.................................................................................................................................28
 1. Royalties....................................................................................................................28
 2. Income tax .................................................................................................................28
 3. Windfall taxes ............................................................................................................28
 4. Tax incentives ............................................................................................................29
 C. Fiscal regime in Guyana..................................................................................................... 30
ECLAC - Studies and Perspectives series-The Caribbean No. 101 Navigating transfer pricing risk... 4

 D. Fiscal regime for oil and gas in Trinidad and Tobago......................................................... 31
 E. Tax incentives in oil and gas sector in Trinidad and Tobago ............................................... 32
V. Transfer pricing, base erosion and profit shifting ................................................................... 33
 A. How the hydrocarbon industry creates opportunities for transfer pricing risk .................... 34
 B. The OECD approach to addressing transfer pricing risk ..................................................... 37
 C. Addressing transfer pricing ............................................................................................... 37
 1. Australia .................................................................................................................... 37
 2. Colombia ................................................................................................................... 38
 3. Ghana ........................................................................................................................ 39
 4. Greenland.................................................................................................................. 39
 5. India .......................................................................................................................... 39
 6. Administrative pricing in Norway, Angola, and Indonesia .......................................... 39
VI. Estimated revenue loss for Trinidad and Tobago ................................................................... 41
 A. Estimated revenue loss in the natural gas industry ............................................................ 41
 B. Relationship between the GORTT’s energy revenue and the GDP
 of Trinidad and Tobago ..................................................................................................... 43
VII. Policy recommendations ......................................................................................................... 45
 A. Recommended framework ................................................................................................ 45
 1. Designate a revenue authority to set a fair price for the hydrocarbons ......................46
 2. Implementing advanced pricing agreements .............................................................46
 3. Establishing a reporting and monitoring framework ..................................................46
 4. Addressing the natural gas netback prices ................................................................. 47
VIII. Conclusion................................................................................................................................49
Bibliography ....................................................................................................................................... 51

Annexes
Annex 1 .................................................................................................................................. 58
Annex 2 .................................................................................................................................. 59
Annex 3 .................................................................................................................................. 67
Studies and Perspectives-The Caribbean Series: issues published. ......................................................68

Tables
Table 1 Estimation of effective tax rate for Guyana
 under current production sharing contract ................................................................ 16
Table 2 Top oil exploration companies by revenue stream in 2018 ......................................... 18
Table 3 Top oil exporting countries ........................................................................................ 18
Table 4 Taxation of oil and gas production .............................................................................29
Table 5 Trinidad and Tobago LNG exports to destination markets (BCM) .............................. 36
Table A1 Summary of the OECD’s BEPS action plan ................................................................ 58
Table A2 Descriptive statistics ..................................................................................................62
Table A3 Stationary tests ......................................................................................................... 63
Table A4 Structural break test for GDP..................................................................................... 63
Table A5 Structural break test for GORTT energy revenue .......................................................64
Table A6 Dependence between the energy revenue and the GDP at the decompositions ....... 66
Table A7 Granger causality results .......................................................................................... 66
Table A8 Estimated tax revenue ............................................................................................... 67
ECLAC - Studies and Perspectives series-The Caribbean No. 101 Navigating transfer pricing risk... 5

Figures
Figure 1 Trinidad and Tobago Crude oil and natural gas production, 1999-2019...................... 14
Figure 2 Natural gas prices in regional markets ....................................................................... 35
Figure 3 Estimated tax revenues under the 3 scenarios, 1999-2018 .........................................42
Figure 4 Trinidad and Tobago central government energy revenue ........................................ 43
Figure A1 Wavelet decomposition for the energy revenue (Daubechies 3 levels of detail) ......... 65
Figure A2 Wavelet decomposition for the GDP (Daubechies 3 levels of detail) .......................... 65

Diagrams
Diagram 1 Oil and gas global value chain .................................................................................... 19
Diagram 2 Indexation demand and supply curves for natural gas................................................ 25
ECLAC - Studies and Perspectives series-The Caribbean No. 101 Navigating transfer pricing risk... 7

Abstract

Caribbean economies are increasingly grappling with the need to increase revenue generation in order
to create the necessary fiscal space for financing economic recovery during the post-COVID-19 era. For
energy exporting economies, optimizing natural resource rents has re-emerged as a leading policy
objective with transfer pricing risk mitigation being a key modality for achieving this policy goal.
 Multinational energy companies (MECs) invariably possess relatively greater institutional
capacity than developing country governments and can, therefore, reduce their tax liability through the
use of transfer pricing. Transfer pricing is an accounting procedure that records the financial
transactions between a company and its subsidiaries and divisions and can be applied for services,
intellectual property, financing, interest, and the exchange of goods. Transfer pricing risk is the chance
that the transfer prices do not reflect true market prices, i.e. resulting in the shifting of a company’s
profit from one jurisdiction to another thereby eroding the local tax base. Guyana and Trinidad and
Tobago are among the Caribbean countries with commercial reserves of hydrocarbons, where transfer
pricing risk has the potential to result in considerable revenue leakage.
 This study explores the oil and gas value chain by first examining the oil and gas taxation
framework and assessing the mechanics of the industry’s natural creation of opportunities for transfer
pricing. The results of the analysis are then used to identify the most appropriate regime with which to
address transfer pricing and provide sound policy recommendations for its implementation.
Consequently, the study posits that inherent pricing risk can be mitigated by developing an appropriate
fiscal and legislative framework complemented by the designation of a competent revenue authority to
ensure that multinationals set fair hydrocarbon prices. Further research possibilities however remain,
particularly by expanding the focus of the analysis to include Latin American economies and employing
a game theory framework.
ECLAC - Studies and Perspectives series-The Caribbean No. 101 Navigating transfer pricing risk... 9

Introduction

Many small developing economies are fortunate to be endowed with mineral natural resources.
However, more often than not these countries lack the capacity to monetize their natural resources and
therefore often engage multinational companies. Fiscal incentives are frequently used as the primary
tool to attract foreign direct investment in these mineral natural resource-based, particularly
hydrocarbon-based, economies. Small developing economies often compete with each other for this
foreign investment by offering deeper and broader incentives, which more often than not place the host
country in a disadvantageous position. This scenario is often referred to as the “race-to-the-bottom”
(Razin and Sadka 2012; Readhead 2018). The intuition is that when developing countries offer low taxes
on their natural resources, they forego potentially significant fiscal revenue.
 Multinational companies operating in the hydrocarbon industry are usually cognizant of the tax
regimes prevailing in different countries. Multinational energy companies (MECs) have complex,
international supply chains that contract a host of specialist companies in the process of bringing vital
commodities from its source to the final market. The MECs conduct business with their subsidiaries,
paying them for services, and subsequently transferring value. The process in which value is exchanged
in these related party transactions is referred to as transfer pricing.
 Essentially, transfer pricing is a practice where one division or affiliate of a firm may charge
another division of a firm for goods and services that it may provide (Seth 2019). This is a standard
practice as several firms may conduct business with their affiliates (Amidu et al. 2019). Transfer pricing
risk refers to the practice where some firms have the potential to shift income to other jurisdictions and
erode the local tax base. This can result from an organization engaging in multiple transactions with its
affiliates, but not at an arm’s length basis. Therefore, cost is shifted from one affiliate to another,
resulting in the shifting of profits and the reduction of the tax liability in the local jurisdiction
(OECD 2013).
 MECs have the capacity to shift value along their global value chain, which in turn can reduce their
tax liability through base erosion and profit shifting (BEPS). This can result in hydrocarbon-rich countries
earning less than their fair share of hydrocarbon revenues.
ECLAC - Studies and Perspectives series-The Caribbean No. 101 Navigating transfer pricing risk... 10

 Shifting to a brief consideration of the magnitude of the commercial hydrocarbon reserves of
two (2) subregional economies, it is noteworthy that in 2015, a well which was drilled by ExxonMobil
affiliate, Esso Exploration and Production Guyana Ltd., made a commercial find of more than 295 feet
(90 meters) of high-quality oil-bearing sandstone reservoirs. The well, Lisa-1, was drilled in the Stabroek
Block, 190 kilometers (120 miles) off the Guyana coast(OET 2016). Following that find, ExxonMobil has
made additional discoveries (OGJ 2018). ExxonMobil estimates that the Lisa wells alone could hold
more than 1.4 billion recoverable barrels (bbl.) of crude oil (Krauss 2016).
 Such commercial finds create prospects for Guyana to emerge as a large producer and exporter
of crude oil. Even at the low price of US $50/ bbl., commercialization of the crude oil from only the Lisa
fields could result in at least US $70 billion.1 This dwarfs Guyana’s current GDP which was only
US$ 3.5 billion in 2016 (World Bank 2017).
 Trinidad and Tobago also has commercial reserves of hydrocarbons. The Ryder Scott Audit 2018
revealed that in 2017, the country proven natural gas reserves were estimated at 300 billion cubic meters
(bcm) (10.6 trillion cubic feet (tcf)), and produced 33.8 bcm (1.19 tcf) of gas.2 Oil reserves were estimated at
200 million barrels, and oil production averaged 87,000 barrels per day (bpd) in 2018 (The Energy Year 2019).
 Both Guyana and Trinidad and Tobago have multinational energy companies operating in their
hydrocarbon industry. The rents accrued from the oil and natural gas sector are central to modernizing
economic and developmental infrastructure, such as roads, schools, hospitals, ICT etc. Both countries
are eager to attract foreign direct investment to monetize their hydrocarbons, thereby generating much
needed energy rents.
 Ideally, both countries should seek to capture their fair share of the generated natural resource
rents. However, multinational energy companies (MECs) have greater institutional capacity than several
developing country governments, and are able to reduce their tax liability through the use of transfer
pricing. The prevailing problématique is whether or not (i) oil and natural gas revenue has contributed
to the economic growth of resource-rich Caribbean countries; and (ii) whether energy-rich Caribbean
economies are vulnerable to transfer pricing risk, i.e. have incurred significant revenue leakage due to
transfer pricing by MECs.
 Accordingly, the objectives of the study are to:
 • explore the oil and gas value chain;
 • examine the oil and gas taxation framework;
 • examine the mechanics of the industry’s natural creation of opportunities for transfer pricing;
 • quantify where possible potential revenue losses due to transfer pricing; and
 • provide policy recommendations for an appropriate regime to address transfer pricing which
 may be useful to Guyana, and Trinidad and Tobago.
 The rest of the study is structured as follows. Section 2 reviews the energy economies of Trinidad
and Tobago and Guyana as both countries are presently at different stages of their industry life cycle.
Despite this, both countries are reliant upon multinational energy corporations for the development of

1 Note, if the Government of Guyana allows international oil companies to produce and export crude oil, the government earn
 revenue from taxation. Such tax revenues would be less than the total export revenues. However, the US $70 billion represents the
 total export revenue if 1.4 billion barrels are exported at US $50/bbl. Additionally, in the production of oil from any well, 100% of the
 original oil in place (OOIP) will never be recovered. Primary, secondary and tertiary recovery methods may allow for the recovery of
 up to 80% of the OOIP. Energy companies typically abandon wells when it is not economical to recover the residual oil. However,
 for the purposes of analysis, 1.4 billion barrels is still assumed since it is expected that Guyana would be able to produce more than
 1.4 billion barrels.
2 This would result in a reserves-to-production ratio of 8.9 years.
ECLAC - Studies and Perspectives series-The Caribbean No. 101 Navigating transfer pricing risk... 11

the energy sector. Neither country currently has in place a robust framework to address transfer pricing
and/or reduce its associated risk. Section 3 reviews the crude oil and natural gas global value chain. It is
necessary to explore the oil and gas global value chain since the transfer pricing conundrum arises out
of the global value chain for the hydrocarbons being controlled by the multinationals, and the
governments of the host countries acting as observers rather than active players. Section 4 explains
how oil and gas are priced in different markets. Section 5 explores how oil and gas are taxed. Section 6
reviews the base erosion and profit shifting. Section 7 estimates the revenue loss in the natural gas
sector for Trinidad and Tobago. Section 8 provides policy recommendation to address potential transfer
pricing threats and section 9 concludes the study.
ECLAC - Studies and Perspectives series-The Caribbean No. 101 Navigating transfer pricing risk... 13

I. Hydrocarbon industry in Trinidad and Tobago
 and Guyana

Trinidad and Tobago and Guyana are at different stages in the life-cycle of their hydrocarbon industries.
Trinidad and Tobago has over 100 years of experience in the oil industry, and over 20 years of experience
in the export of LNG. By comparison, commercial discoveries of oil were made offshore Guyana in 2015,
and the country commenced the export of crude oil in 2020. Therefore, the Guyana hydrocarbon
industry is still in its nascent stage, while that of Trinidad and Tobago’s is mature.

A. Hydrocarbon industry in Trinidad and Tobago
Trinidad and Tobago gained its independence from the UK in 1962 and the country became a republic
in 1976. The Government of the Republic of Trinidad and Tobago (GORTT) came to rely on the export
taxes from the oil industry for revenue for public finance. This was highly advantageous as there were
spikes in the oil price in 1973 and 1979, resulting in a boom in the 1970s (Campbell 2009).However, the
oil price crash of the 1980s precipitated economic recession, resulting in a mass exodus of foreign energy
companies3 from Trinidad and Tobago during that period (Pantin 1988; Boopsingh and McGuire 2014).
 Recognizing this challenge, the GORTT sought to diversify into downstream natural gas industry
to supplement revenue while building economic resilience. Until that time, natural gas had been flared
off; considered a useless bi-product of oil. The government now sought to attract private sector interest
in natural gas production. Notwithstanding the practical, if limited uses of natural gas in the economy
at that time,4 private sector interest in developing the natural gas industry was anaemic. This motivated

3 Some of these companies provided supporting services.
4 In 1953, the Trinidad and Tobago Electricity Commission (T&TEC) started to use gas for electricity generation at its Penal Power
 Station. Natural gas was also used for cement manufacturing by Trinidad Cement Limited (TCL), and fertilizer production by
 Federation Chemical Limited (Fedchem) (Jobity and Pantor 1995; Punnett and John-Toney 2001).
ECLAC - Studies and Perspectives series-The Caribbean No. 101 Navigating transfer pricing risk... 14

the GORTT to take the lead in developing the sector, the attempt at diversification into the downstream
natural gas industry seen as ‘questionable’ at the time.5
 Instead, the GORTT’s thrust into the downstream natural gas sector proved to be an excellent
shift in policy direction towards effective economic and export diversification. Currently, Trinidad and
Tobago’s downstream natural gas sector investment comprises 1 natural gas liquids processing facility,
4 LNG trains, 11 ammonia plants, 1 urea plant, 7 methanol plants, 1 methanol to power facility, 4 iron
and steel mills, 6 power generation sites, 1 AUM complex, and over 100 natural gas intensive light
manufacturing firms, including cement production (GORTT MEEI 2020). Moreover, Trinidad and
Tobago has developed considerable infrastructure, labour skillset, and local companies in the energy
industry over the years.
 Nevertheless, the Trinidad and Tobago energy industry currently faces several structural
challenges. Its oil industry is mature - all the easy discoveries have been made, both on-land and
offshore, and production is declining. Therefore, in order to make new commercial discoveries,
exploration companies must drill in deeper waters in the offshore blocks. As regards production, many
wells have already passed the maximum production rate from primary recovery methods. Therefore, in
order to maintain production levels, secondary and tertiary methods must now increasingly be
employed. In fact, Trinidad and Tobago’s oil production peaked in 2006 and has been on the decline
since then.
 Figure 1
 Trinidad and Tobago Crude oil and natural gas production, 1999-2019
 200 4.5
 180 4.0
 160

 billion cubic feet natural gas per day
 3.5
 140
 3.0
 barrels per day

 120
 2.5
 100
 2.0
 80
 1.5
 60
 40 1.0

 20 0.5
 0 0.0
 2002

 2010

 2018
 1999

 2000

 2001

 2003

 2004

 2005

 2006

 2007

 2008

 2009

 2011

 2012

 2013

 2014

 2015

 2016

 2017

 2019

 Oil Gas

Source: British Petroleum (2020), “Statistical Review of World Energy.” Accessed November 2, 2020.

 Natural gas production was also briefly in decline in Trinidad and Tobago. It peaked at 3.9 Bcf/d
in 2010, and then went into decline until 2016. The curtailments in the natural gas industry were due to
maintenance activity conducted upstream, and to delays in the renewal of upstream gas contracts.

5 This prompt the then Prime Minister of the Republic of Trinidad and Tobago to make the following remarks at the Sod Turning
 Ceremony, at the Iron and Steel Company of Trinidad and Tobago (ISCOTT) - “Blessed as we are with hydrocarbon resources, we have
 a choice to make. There have been attempts to persuade us that the simplest and easiest thing to do would be to sit back, export our oil,
 export our gas, do nothing else and just receive the revenues derived from such exports and as it were, lead a life of luxury-at least for
 some limited period. This, the government has completely rejected, for it amounts to putting the entire nation on the dole. Instead, we
 have taken what may be the more difficult road and thus accepting the challenge of entering the world of steel, aluminum, methanol,
 fertilizer, and petrochemicals in spite of our smallness and in spite of our existing level of technology. We have accepted the challenge
 of using our hydrocarbon resources in a very definite industrialization process” (cited in Charles 2019, 99).
ECLAC - Studies and Perspectives series-The Caribbean No. 101 Navigating transfer pricing risk... 15

However, this situation was addressed by the government in 2016 on its negotiation of new upstream
contracts to encourage exploration and production activity (GORTT OPM 2017). Figure 1 illustrates
Trinidad and Tobago’s crude oil and natural gas production.

B. Hydrocarbon industry in Guyana
Guyana also has a history of exploration activity in the hydrocarbon industry, spanning over 50 years.
Exploration began during the 1965 to 1975 period, when several companies drilled 9 exploratory wells.
Only one resulted in oil discovery, in 1975. While this proved that oil deposits existed in Guyana, it was
insufficient to motivate commercial production (Balza et al. 2020).
 Oil exploration in Guyana remained sporadic over the next thirty years, with the occasional find
being deemed commercially unviable. In 2008, Esso Exploration and Production Guyana Ltd. began
exploration activity in the offshore blocks. This eventually resulted in successful commercial finds from
2015 (Energy Year 2019). In fact, Esso Exploration and Production Guyana Ltd. has made 16 commercial
finds, pushing the proven recoverable reserves from the Stabroek block to more than 8 billion barrels of
oil equivalent (boe) (Balza et al. 2020).
 It is forecasted that Guyana’s proven reserves in the deepwater blocks will keep growing, with
increased expansion of interest in Guyana’s energy industry by several multinational corporations.
Exploration and production (E&P) companies have leased 9 deepwater blocks, and there has been an
increasing number of foreign companies providing support services to the E&P companies (Balza et al.
2020). This is resulting in significant capital inflows, as well as in the development of infrastructure in
the communities in the vicinity of the energy industry.
 Guyana’s oil production is expected to reach approximately 120,000 bpd at the end of 2020. This
already exceeds Trinidad and Tobago’s production levels which stood at 82,000 bpd in 2019. At an
estimated oil price of US$40/bbl., this approximate production level would yield a revenue of some
US$4,800,000 per day.
 Certainly, the Government of Guyana is on the cusp of windfall hydrocarbon revenues.6 This can
create growing pressure for increased public spending, subsidies and transfers, which in turn can cause
a rise in the general price level (inflation), and an appreciation of the real exchange rate. Real exchange
rate appreciation, in the context of an economic boom, can have destabilizing effects on an economy,
a situation referred to as the Dutch Disease or resource curse (Hosein 2010).7
 Before moving on to a consideration of the transfer pricing problem, it is important to note that
the inflows calculated above represent estimated oil revenue, not profit. Taxes, however, are charged
on profits. Assuming that 75% of production is cost oil, 12.5% tax through a production sharing contract,
and a 2% royalty, then the eligible tax would be 0.25 x 120,000 x 0.145 x $40 = $171,000 (USD) per day
or US$62,415,000 per year. Therefore, the Government of Guyana’s take would be $171,000 USD per
day under such assumptions.
 This, however, must be set against a consideration that tax revenue will definitely increase as
Guyana’s oil production is projected to rise to 750,000 bpd by 2025, and to as much as 1,200,000 bpd by

6
 There is also a possibility that Guyana may have reserves of natural gas, since natural gas deposits are often found in geological
 formations with crude oil deposits. This natural gas is called associated gas.
7 A study notes additional challenges facing Guyana: “The new economic dynamics of oil production are likely to contribute to
 increased migration inflows, greater electricity demand, and greater housing demand in a geographic location where around 90 per
 cent of the population resides in low-lying coastal areas. This introduces policy challenges for urban development, immigration
 policy, environmental risk management, and climate risk mitigation.” (Balza et al. 2020, 7).
ECLAC - Studies and Perspectives series-The Caribbean No. 101 Navigating transfer pricing risk... 16

2030 based on primary recovery methods; the country has not yet started monetizing its natural gas;
and key features of its production sharing contracts evolve over time.
 It is interesting to note that under the foregoing assumptions, in a scenario where the royalty
(2%) is charged before deductions for cost oil, then the Government of Guyana would derive relatively
more revenue, i.e. this would result in an effective rate of tax of 5.13%. In contrast, if the cost deductions
were to accrue after cost oil the effective rate of tax would be estimated at 3.56% (See table 1).
 Table 1
 Estimation of effective tax rate for Guyana under current production sharing contract
 Scenario 2 where
 Scenario 1 where the royality
 the royalty is charged
 is charged before costs
 after costs

 Oil price (US$/bbl.) 40 40
 Rate of oil cost (%) 0.75 0.75
 Oil production (bbl./d) 120 000 120 000
 Cost oil (US$) 90 000 90 000
 Total revenue (US$) 4 800 000 4 800 000
 Royalty (2%) (US$) 96 000 24 000
 PSC (12.5%) (US$) 150 000 147 000
 Total tax for the GoG (US$) 246 000 171 000
 Total income after tax for the multinational (US$) 4 554 000 4 629 000
 Effective rate of tax (%) 5.13 3.56

Source: Economic Commission for Latin America and the Caribbean.

C. The transfer pricing problem
Although Trinidad and Tobago and Guyana are at different stages in the life cycle of their hydrocarbon
sector, both countries rely heavily on multinational energy companies for the development of the
industry. However, the hydrocarbon industry is a vast global value chain with interaction among several
actors, at different stages, all involved in moving the commodity from ground to final market.
Multinational corporations dominate hydrocarbon value chains. The interaction among the
stakeholders in the global value chain creates several opportunities for value which should accrue to the
hydrocarbon rich countries to be lost.8
 Indeed, as already indicated, neither Trinidad and Tobago nor Guyana presently has a framework
to address transfer pricing, or the loss of value from their hydrocarbon sector. The following three
sections seek to examine in more detail the mechanics of the functioning of oil and gas value chain; and
the modalities of hydrocarbon pricing and taxation. An understanding of these issues is crucial to policy
makers, as it may instruct the shaping of a policy framework to address transfer pricing.

8 In other words, there is tremendous scope for the multinational companies to conduct transactions with their subsidiaries and
 affiliates which are located across different segments of the global value chain. If the multinational companies conduct transactions
 with their affiliates but not at the arm’s length principle, then value can be shifted from one affiliate to another, and thus the
 hydrocarbon rich country can lose the opportunity to adequately tax its fair share of value.
ECLAC - Studies and Perspectives series-The Caribbean No. 101 Navigating transfer pricing risk... 17

II. Oil and gas global value chain

As Porter (1983) notes, there is a chain of activities, or value chain, which are required to bring a good or
service from conception, through different stages of production, to the point where the final product is
distributed and sold to the consumer. The oil and gas industry, like several other industries,
encompasses a range of activities which jointly contribute to the transformation of the raw materials to
the finished products. There is a distinct global value chain for crude oil, and one for natural gas.

A. Crude oil global value chain
The crude oil global value chaincomprises three segments:
 • upstream – exploration and production;
 • midstream – transportation and processing; and
 • downstream – marketing and distribution.
 The upstream segment of the crude oil value chain begins with the identification of suitable
locations to explore for hydrocarbons. Countries with proved reserves of hydrocarbons may directly
proceed to develop this industry, or they may invite multinational companies to undertake this venture.
Whether local or foreign, the exploration company must first obtain approvals and licenses from the
government to conduct exploration activities to confirm the exact locations of oil deposits, as well as
the characteristics of reservoirs. Oil companies may contract a variety of suppliers to provide auxiliary
services such as seismic surveys, well drilling, mud logging, and equipment supply.
 Once the deposits are confirmed, and the oil company has sufficient information on the
reservoirs, they may implement a development programme to systematically drill production wells and
bring the crude oil deposits to the surface. During production, multiple service contractors can also be
hired, notably academic consultants such as oceanographers, geologist, mechanical, and chemical
engineers, and non-technical suppliers includingfood caterers, cleaners, security guards, and drivers.
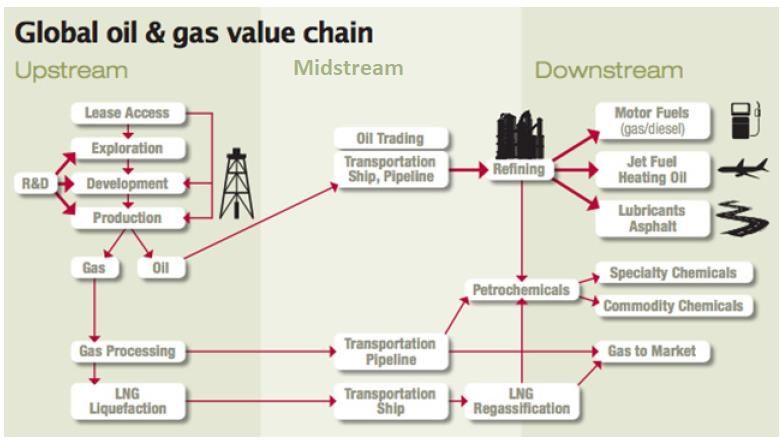
ECLAC - Studies and Perspectives series-The Caribbean No. 101 Navigating transfer pricing risk... 18

 The top oil exploration companies are highlighted in table 2. It is noteworthy that these
companies are also the dominant players in the natural gas industry. Furthermore, these companies are
vertically integrated and operate in all segments of the crude oil and gas value chain.
 Table 2
 Top oil exploration companies by revenue stream in 2018
 Company USD billion
 China Petroleum & Chemical Corporation (Sinopec) 426.00
 Royal Dutch Shell 388.37
 China National Petroleum Corp (CNPC) 346.00
 British Petroleum (BP) 298.75
 ExxonMobil 290.20
 Total 209.36
 Chevron 158.90
 Rosneft 133.70
 Lukoil 115.20
 Phillips 66 111.46

 Source: Offshore Technology (2018), “The World’s Biggest Oil and Gas Companies.” Accessed
 February 24, 2020. https://www.offshore-technology.com/features/largest-oil-and-gas-companies-
 in-2018//

 Many developing countries endowed with commercial reserves of crude oil and gas operate in
the upstream segment of the oil and gas global value chain. These countries may have the technical
capacity to monetize the energy reserves for themselves. Other countries rely on foreign multinational
energy companies to monetize the energy reserves. In some instances, the governments of these
countries encourage multinational energy companies to form joint ventures with local companies.9 The
top oil exporting countries are highlighted in table 3.
 Table 3
 Top oil exporting countries

 Rank Country/Region Oil - exports (bbl./day)
 1 Saudi Arabia 8 300 000
 2 Russia 5 225 000
 3 Iraq 3 800 000
 4 United States 3 770 000
 5 Canada 3 596 690
 6 United Arab Emirates 2 296 473
 7 Kuwait 2 050 030
 8 Nigeria 1 979 451
 9 Qatar 1 477 213
 10 Angola 1 420 588

 Source: (United States Energy Information Administration) (2019), “Petroleum and Other Liquids.” Accessed
 December 14, 2019.

 The midstream segment of the crude oil value chain involves transportation and processing. The
crude oil is transported from the production fields, mainly through pipelines, to refineries for processing.
The countries with refineries may process the oil into a variety of refinery fractions. The countries

9
 Joint ventures are often encouraged to help capture more value locally as a local content strategy. Joint ventures are also
 encouraged as a means to help local stakeholder develop their capacity.
ECLAC - Studies and Perspectives series-The Caribbean No. 101 Navigating transfer pricing risk... 19

without refinery facilities may transport the oil to a facility where it is organized for export to foreign
markets (See diagram 1).
 Diagram 1
 Oil and gas global value chain

Source: Baru, Penerbit Akademia (2019), “Logistics Management for Organizational Success of Downstream Industry in Oil & Gas.”

 Refining crude oil into various refinery fractions, such as heating oil, gasoline, diesel, bunker fuel,
aviation fuel, etc. should be advantageous for developing countries as it allows them to capture more
value added. However, there are very tight crack spreads10 in refining, and only the most efficient
processors can operate profitable refineries (Fahim et al. 2009).
 The downstream segment of the crude oil value chain involves the marketing, distribution and
sale of the refined products. Since crude oil has varying properties,11 different crude oils produce very
different yields when refined. Crudes that are lighter and sweeter produce a higher refinery yield of
lighter, more valuable products such as gasoline and aviation fuel, and a lower yield of lower-value
products such as residual fuel oil. Refineries aspire to produce the highest yield of the high-value
products to sell to markets (World Bank 2009).
 The three primary refining centers in the world, which are used as benchmarks for refining
margins are the United States (US) Gulf Coast, North-Western Europe, and Singapore. However,
countries can sell their refinery fractions to any market, and fetch better prices and gross margins.

10 The crack spread refers to a gross margin for refining. It is the difference between the price of the crude oil, and the weighted
 average price of the refinery fractions. The net margin is the difference between the gross margin, and the average cost of
 production. If the operational cost of a refinery company is too high, it can cause a refining company’s net margin to be negative
 (Fahim et al. 2009).
11
 Crude oil main properties which influences its price are its density, and its Sulphur content. The American Petroleum Institute (API)
 gravity determines the density and heaviness of a crude. Crudes with API gravity of greater than 100 are lighter than water and will
 float on water, therefore they are considered light. Crudes with API gravity of less than 10 0 are considered heavy (Meyer and Attanasi
 2004). Light crudes are considered more valuable than heavy crudes. The Sulphur content determines the sweetness and sourness
 of the crude. Crudes with a Sulphur content less than 0.5% are considered sweet. Crudes with Sulphur contents in excess of 0.5%
 are considered sour (Wlazlowski et al. 2011). Sweet crudes are considered more valuable than sour crudes.
ECLAC - Studies and Perspectives series-The Caribbean No. 101 Navigating transfer pricing risk... 20

B. Natural gas global value chain
Like the crude oil industry, the natural gas value chain is also comprised of upstream, midstream, and
downstream segments. The upstream segment of the natural gas value chain is almost identical to that
of the crude oil industry. In fact, crude oil issometimes discovered with natural gas. Natural gas found in
conjunction with crude oil is referred to as associated gas. The midstream segment involves
transportation and storage. The natural gas is transported from the production wells, mainly through a
pipeline, to a processing facility. Dry gas, which is predominantly methane, can only be transported by
pipeline (World Bank 2009). Liquid gas can be transported via pipelines or tankers, however, the
liquefaction of the gas typically occurs at an export facility rather than at the well. Since extensive
pipeline infrastructure is required to transport the gas, there is significant opportunity for local
stakeholders to capture value from the construction of pipelines.
 The downstream segment of the natural gas industry involves the processing of natural gas into
various products, and the marketing and distribution of these products. At the processing facility,
impurities are extracted from the gas.12 At this stage, there are multiple options. One option is for the
natural gas to be frozen at −162 °C (−260 °F) to form liquefied natural gas (LNG), which can then be
exported. Alternately, the natural gas can be transported to other facilities, where it can be used to
produce electricity. A third option is transporting the natural gas to downstream gas companies, which
in turn use the natural gas as feedstock for petrochemicals (World Bank 2015).
 With respect to the latter, it is noteworthy that primary petrochemicals are divided into different
groups based on their chemical structure:
 • Olefins which include intermediate products such as ethylene, propylene, and butadiene.
 Olefins are used to produce polymers, which in turn are used to manufacture plastics, resins,
 fibers, elastomers, lubricants, and gels;
 • Aromatics, which include intermediate products such as benzene, toluene, and xylenes. Benzene
 can be used to produce dyes and synthetic detergents. Olefins and aromatics are the basic
 building-blocks for a wide range of products including solvents, detergents, and adhesives;
 • Synthesis gas, which is a mixture of carbon monoxide and hydrogen. Synthesis gas can be
 processed to make ammonia and methanol. Ammonia can be processed to make urea, which
 can be used as an input for fertilizer. Methanol can be processed to form biofuels, solvents,
 and antifreeze;
 • Alkanes, which are highly combustible clean fuels. Methane, ethane, propane and butanes are
 all alkanes, and they are derived primarily from natural gas processing plants. Alkane
 derivatives are used in hundreds of goods, including plastics, paints, drugs, cosmetics,
 detergents, and insecticides; and
 • Methanol and formaldehyde. Methanol can be processed into formaldehyde, which in turn is
 a precursor to many chemical compounds such as industrial resin, polyoxymethylene plastics,
 adhesives used in plywood, the wet-strength resin added to sanitary paper products (Ren et
 al. 2009).
 Natural gas can also be transported to firms involved in gas-to-liquids (GTL) processing. GTL
processing can convert methane into a range of products normally made from crude oil, such as
transport fuel, naphtha,13 and oils for lubricants.

12
 Some of the impurities include hydrogen sulfide, carbon dioxide, water, mercury and higher-chained hydrocarbons (World Bank 2015).
13 Naphtha which have been produced in refineries can be catalytic cracked into aromatics.
ECLAC - Studies and Perspectives series-The Caribbean No. 101 Navigating transfer pricing risk... 21

 When natural gas industries are developed downstream, a country can capture a greater share of
activity from the natural gas value chain. Natural gas can also be processed to a multitude of
intermediate products, which in turn can form manufacturing industries. There is great scope for the
creation of backward linkages to the suppliers of raw materials and support services, and forward
linkages to industries which would use the feedstock to create intermediate and final products. The
formation of these linkages can also have a positive multiplier effect to generate economic activity,
employment, and income earning opportunities for several nationals not directly employed in the
hydrocarbon industry.
ECLAC - Studies and Perspectives series-The Caribbean No. 101 Navigating transfer pricing risk... 23

III. Oil vs gas markets and pricing

A central objective of this paper is to demonstrate that while crude oil and natural gas are both
commodities similarly used as fuel in the production of electricity, crude oil markets and pricing are
separate and distinct from natural gas markets and pricing. Following is an examination of their
respective market and price differences.

A. Oil markets and pricing
The price of oil is generally based on the spot price of a benchmark crude oil. The main benchmarks are
West Texas Intermediate (WTI), Brent and Dubai. WTI is lighter and sweeter than Brent, and is used as
the benchmark for crude oil in the North American market. WTI is traded on the New York Mercantile
Exchange (NYMEX) for delivery at Cushing, Oklahoma. Brent is traded on the Intercontinental Exchange
(ICE) for delivery at Sullom Voe, Scotland. Dubai Crude is a medium sour crude oil extracted from Dubai
and is used as a price benchmark for the Persian Gulf area.
 The price of crude oil is also determined by its demand and supply. Hamilton (1983) identified
several factors which influence the price of oil. In summary, the demand for crude oil is influenced by:
 • The demand for its refinery fractions (gasoline, diesel, heating oil, aviation fuel, etc.).
 • The weather and climate (which also influence the demand for the refinery fractions). For
 example, in the winter, the demand for oil should increase since more of the commodity is
 consumed to produce electricity for heating.
 • World income, or GDP, and its growth; an increase in global income invariably results in an
 increase in consumption.
 • The demand from major consuming countries and regions, such as the US, Europe or the
 Organization for Economic Co-operation and Development (OECD) bloc.
ECLAC - Studies and Perspectives series-The Caribbean No. 101 Navigating transfer pricing risk... 24

 The supply of oil is determined by:
 • The production quotas of major producing nations.
 • The oil inventories of major producing nations.
 • Wars, armed conflict, trade embargos;
 • Weather disruptions; extreme weather events near to producing regions or major import hubs
 can cause a disruption in supply.
 Other determinants of demand for oil include:
 • International trade of major oil consuming countries (Chen and Hsu 2012). This can be
 affected but tariff and non-tariff barriers to trade.
 • Demand for renewable energy, innovations in renewable energy, and the United Nations
 Framework Convention on Climate Change (UNFCCC) conventions on renewable energy. For
 example, emerging from the twenty-first Conference of the Parties (COP 21), both developed
 countries and developing countries agreed to submit and implement Nationally Determined
 Contributions (NDCs). These NDCs are voluntary renewable energy and energy efficiency
 plans to reduce countries CO2 emissions (Charles 2016).
 Other determinants of oil supply include:
 • The US shale oil supply (Killan 2016), which can be measured by the actual supply, or by rig count.
 • The flow of trade along key shipping routes (Morris 2019).

B. Natural gas regional markets and pricing
There is no one international market for gas. Natural gas is sold to different countries, each with their
own distinct pricing arrangements (IEA 2012). High transportation cost of natural gas both via LNG and
pipelines, has contributed to the absence of an integrated world gas market. LNG vessels costs are more
than six times more expensive than oil tankers. Freight rates show similar price differences. Thus, LNG
transportation costs are approximately six times more expensive than oil transportation costs (Aryanitis
et al. 2012).
 There are 3 major regional markets for gas (Davoust 2008; Sonstebo, 2012; Aguilera et al. 2014).
They include the North American market, the European market, and the Asian market. In the North
American market, the bulk of the imported gas is sourced via pipeline from Canada and Mexico to the
United States. There were 12 major LNG import terminals (Sonstebo 2012), however, the US has
emerged as a shale gas exporter.
 The European market also has vast pipeline infrastructure (Sonstebo 2012)14 and 19 LNG import
terminals to facilitate the transportation of gas (Sonstebo 2012). The European gas trade mainly takes
place from Norway, Russia, and Algeria to Western Europe (Geman, 2005). In the Asian market, gas is
purchased and transported as LNG (Davoust 2008; Erdos 2012). The gas is sourced predominantly from
the Australia, Indonesia, the Middle East, Trinidad and Tobago, the US and Japan (Geman 2009;
Erdos 2012).

14
 In 1998 a pipeline, the Interconnector, was used to physically integrate the United Kingdom (UK) with the rest of Continental Europe
 (Asche et al. 2012).
ECLAC - Studies and Perspectives series-The Caribbean No. 101 Navigating transfer pricing risk... 25

 The imported price of natural gas traded in international markets is determined by indexation
and open market/ gas-on-gas competition, which will be examined hereunder.
1. Indexation/cost plus pricing
At the inception of natural gas markets, indexation was used as the main pricing mechanism.15 With the
indexation pricing formula, the price of gas was calculated as a fixed price plus an indexation to the price
of a substitute fuel (e.g. oil). This resulted in the price of natural gas lagging behind the price of oil after
a number of periods (often by a few months). The cost-plus pricing method16 was also a pricing
mechanism used.
 Natural gas contracts that were indexed to oil typically comprised two parts. The first was a
minimum take volume, which was secured with a take-or-pay contract. The minimum take volume
typically represented between 80% and 90% of the total contracted volume, and had a fixed price that
was indexed to oil. The second part was a flexible volume which was not restricted via a take-or-pay
contract. The price on the flexible volume was allowed to move based on demand and supply conditions
as seen in diagram 2 (DCES 2013).
 Diagram 2
 Indexation demand and supply curves for natural gas

 Source: Deloitte Center for Energy Solutions (DCES) (2013), “Exporting the American Renaissance
 Global impacts of LNG exports from the United States.” Accessed June 14, 2014.

 The pricing of gas in the Asian market also followed the indexation pricing structure (Melling
2010). Historically, the Asian gas market was dominated by long term contracts. However, the rise in
the US shale gas has induced many importers to switch to short term contracts.

15 The natural gas indexation to oil pricing methodology was developed initially in Europe in the 1960s (Melling 2010).
16 Cost plus pricing formula is one where the price of gas at the market is equal to the well head price plus all other costs incurred at
 different segments of the value chain. It is the well head price plus transportation costs, plus distribution costs, plus distributer’s
 mark up, plus taxation costs.
ECLAC - Studies and Perspectives series-The Caribbean No. 101 Navigating transfer pricing risk... 26

 The benchmark used for the Asian market is Japanese LNG import prices or the Platts’ Japan-
Korea Marker (JKM) (Marcke 2013). Japanese and Korean prices are used as the benchmark because
their LNG imports represent the bulk of the LNG imports in the Asian market (van Marcke 2013;
Cunningham 2014).
2. Gas-on-gas competition
In gas to gas competition the price of natural gas is determined by its demand and supply. Natural gas
trading hubs tend to develop at locations where there are both intersections of major pipelines and large
storage capacities. The North American market for gas follows the free market pricing structure. The
major reference point for gas prices in the US is the Henry Hub (HH).17 To a lesser extent, there is some
degree of gas-on-gas competition in Europe, with major hubs including Zeebrugge in Belgium, National
Balancing Point (NBP) in the United Kingdom (UK), and Emden in Germany.
 To a lesser extent, a South-American natural gas market is emerging. South American LNG
importing countries; Argentina, Brazil, and Chile, compete internationally with LNG importing giants
such as Japan and South Korea for their supply of spot LNG. Spot LNG tend to flow to destinations
where the netbacks are the highest (Maxwell and Zhu 2011).18 In order for the South American countries
to secure their spot LNG supply they need to offer the minimum price at a reference Hub (HH or NBP
depending on the seller) plus a premium to account for transportation costs (Barroso, et al. 2008). It is
for this reason that South American countries pay prices similar to the Asian-Pacific market for spot
LNG (BAH 2013).

17
 Henry Hub is a physical location in Louisiana, United States, which serves as a distribution hub for imported gas. It interconnects
 with nine interstates and four intrastate pipelines. Henry Hub was a good benchmark for US gas prices as it was the source point for
 imported gas.
18 Netback pricing is a pricing arrangement whereby the price of gas if calculated from the market back to the well head. The costs
 incurred at different stages at the value chain, e.g. regasification costs, shipping costs, export taxes (if any) and liquefaction costs,
 are deducted from the market price of gas to derive gas prices at the well head (Maxwell and Zhu 2011).
ECLAC - Studies and Perspectives series-The Caribbean No. 101 Navigating transfer pricing risk... 27

IV. Taxation modalities: oil and gas industries

Companies require approval from the state, the owner of the natural resources, to conduct exploration
and production activities in a country. Governments create fiscal regimes comprised of licenses, and
taxation systems. Given that projects are expected to last decades, and risks shift over different project
phases, investors benefit from developing and maintaining a positive long-term relationship with the
country. Ideally, governments develop fiscal terms, which invariably include the awarding of licenses,
and the imposition of taxes, in an attempt to delicately balance the dual, and sometimes conflicting
policy objectives of optimizing resource rents and stimulating investment.

A. Licenses
Hydrocarbon companies are guided by petroleum licenses and contracts for the extraction and
monetization of attendant resources. The main types of contract systems used in the hydrocarbon
sector include concessionary, production sharing and service contracts respectively. A closer
examination of these follows below.
1. Concessionary system
Under this system, the energy company obtains a lease from the government for a fixed period of time
and is responsible for undergoing exploration and production activities. The licensee owns their
investment in the hydrocarbon rich country, and is liable to pay the government royalties, a specific
petroleum tax as well as the general corporate tax. Upon the expiration of the license, the ownership of
the investment is transferred to the government. The concessionary system was the only petroleum
contracting system available before the 1960s (World Bank 2009).
2. Production sharing contracts
Under this arrangement, ownership of the hydrocarbon reserves and production remains with the state,
however, an exploration and production company may be granted licenses and approval to conduct
exploration and production activities. The licensed company funds the exploration and production
You can also read