New Mid-term Business Plan - "IBI 21" Tatsuro Kosaka President and CEO CHUGAI PHARMACEUTICAL CO., LTD. January 31/ February 1, 2019

Page created by Donna Lindsey
 
CONTINUE READING
New Mid-term Business Plan - "IBI 21" Tatsuro Kosaka President and CEO CHUGAI PHARMACEUTICAL CO., LTD. January 31/ February 1, 2019
New Mid-term Business Plan
“IBI 21”

                Tatsuro Kosaka
                President and CEO
                CHUGAI PHARMACEUTICAL CO., LTD.

                January 31/ February 1, 2019
New Mid-term Business Plan - "IBI 21" Tatsuro Kosaka President and CEO CHUGAI PHARMACEUTICAL CO., LTD. January 31/ February 1, 2019
New Mid-term Business Plan “IBI 21”

Forward-Looking Statements

This presentation may include forward-looking statements
pertaining to the business and prospects of Chugai
Pharmaceutical Co., Ltd. (the “Company”). These statements
reflect the Company’s current analysis of existing information
and trends. Actual results may differ from expectations based
on risks and uncertainties that may affect the Company’s
businesses.

                         Note: Amounts shown in this report are rounded to the nearest 0.1 billion yen.
                               Variance and % are calculated based on the amounts shown.

                                                                                                          1
New Mid-term Business Plan “IBI 21”

     Review of 2016 – 2018
Mid-term Business Plan “IBI 18”

                                                             2
New Mid-term Business Plan “IBI 21”

Business Performance during IBI 18
Revenue                                                                                  Core OP
(bn JPY)                                                                                 (bn JPY)              2015-18
  600                                                                  579.8              150                  CAGR*
                                                 534.2
           498.8              491.8
  500                                                                                     125                  Revenue
  400                                                                                     100                   +5.1%
  300                                                                                     75

  200                                                                                     50                   Core OP

                                                 103.2                 130.3                                   +12.8%
  100      90.7               80.6                                                        25

    0                                                                                     0
           2015               2016               2017                   2018
                                                                                                               Core EPS
                                 Core OP        Revenue
                                                                                                               +14.9%
    Core EPS     116.4 JPY          102.5 JPY             138.7 JPY            176.4 JPY

                                                        Initial Target                      Result               Status
  IBI 18
  Target
               Core EPS CAGR*
                     (2015-18)
                                                Low single digit**
               *CAGR: Compound Annual Growth Rate (%)
                                                                                          17.1%**
                                                         ** 3 years, average constant exchange rate for 2015
                                                                                                                   ✓
                                                                                                                          3
New Mid-term Business Plan “IBI 21”

Summary of IBI 18
Achieving record high profit, Chugai is enriching our platforms
for further growth                                                                         Status
                                Posted consecutive record revenues and
      Financial targets          operating profit
                                Achieved industry-leading market capitalization
                                                                                           ✓
                                Continuously generated new antibody projects and
            Acquisition and      enhanced drug discovery platform for middle
           implementation of     molecules
            global top-class    Obtained early approval for Hemlibra
                                Obtained Tecentriq approval and simultaneously
Priority    competitiveness
agenda
                                 developed drugs for 19 indications
                                Established system to manage FDA GMP
                                 inspections
                                                                                           ✓
            Selection and       Established framework to execute regional strategy
           concentration for     through collaboration of 3 Chugai divisions
             accelerated         (Marketing & Sales/Medical Affairs/Safety)
               growth           Made steady inroads towards accelerated growth
                                 based on Hemlibra and Tecentriq
                                                                                               4
New Mid-term Business Plan “IBI 21”

  Realization of Becoming a
Top Pharmaceutical Company

                                                          5
New Mid-term Business Plan “IBI 21”

Goals of “Top Pharmaceutical Company”
                     Company that focuses on first-in-class/best-in-class products
  Corporate           and services, and continuously provides new solutions to
   Vision               patients and medical communities around the world
                                    -Innovation all for patients-

        Quantitative Targets                              Qualitative Targets
          (in late 2010s)                                  (in late 2010s)

 Gain a position among the                   A company that satisfies all
  top 3 major Japanese                         its stakeholders and
  pharmaceutical companies                     receives their active support
 No. 1 presence in our                        and trust
  strategic therapeutic areas in
  Japan                        A company that works
 Expanded presence in global   proactively on a global level
  market

                                                                                                  6
New Mid-term Business Plan “IBI 21”

Top Pharma: Quantitative Targets (1)
Goal: Rank within the top 3 major Japanese pharmaceutical
      companies in the following categories
 Domestic sales share                                                                                                                                                5th*
  Consolidated operating profit margin                                                                                        ✓                                      2nd
  Consolidated operating profit per employee                                                                                  ✓                                      2nd
  Domestic sales per MR                                                                                                       ✓                                    1st**
Goal: No.1 domestic presence in strategic disease areas
                                                                                                  Market share                                       Stakeholder satisfaction

  Oncology                                                         ✓                                     1st*                                                     1st***
Renal: 2nd*/2nd***, Bone & Joint: 2nd*/2nd***, RA (biologics): 2nd*/1st***
Goal: No.1 presence in hospital market based on medical care networks linking
       healthcare providers             Market share        Stakeholder satisfaction
  Share of hospital sales
  (≥100 beds)                                                          ✓                                 1st*                                                     1st***
* Copyright© 2019 IQVIA. Source: JPM 2018. Reprinted with permission. The scope of the market is defined by Chugai. (Other companies: 2017, 2018 or years ended March 31, 2018)
** Calculated by Chugai, based on data from Fuji-Keizai Co., Ltd. *** Copyright© 2019 anterio. Source: Rep-i 201808. Reprinted with permission. The scope of the market is defined by Chugai.
                                                                                                                                                                                                7
New Mid-term Business Plan “IBI 21”

Top Pharma: Quantitative Targets (2)
Goal: Expansion of global presence

                                                                2008: 10.4%
 Increase overseas sales ratio                              2018: 24.2%

                                                                Actemra
 Possess 3 major global products                                Alecensa
                                                                Hemlibra
                                                         nemolizumab
 Number of global projects in late-stage
 development (possess ≥3 projects)                       satralizumab
                                                        SKY59 (expected)

 Continuous addition of FIC/BIC in-house                        During IBI 18
 projects to the portfolio (average 3 projects                 8 projects/
 /year)                                                         3 years
                                                                                       8
New Mid-term Business Plan “IBI 21”

Top Pharma: Qualitative Targets (1)
Goal: A company that satisfies all its stakeholders and
       receives their active support and trust
【Patients and Healthcare Professionals】
 Play a part in increasing treatment satisfaction and the contribution
 of drugs in cancer treatments in our capacity as a leading oncology                        ✓
 company
【Shareholders and Investors】
 Realize growth strategies based on innovation
 (market capitalization: 31st in Japan overall, 1st in domestic
                                                       ※as of Dec. 28, 2018
                                                                                            ✓
 pharmaceutical industry)
【Roche】
 Contribute to growth of Roche Group by out-licensing Actemra,
 Alecensa, and Hemlibra.
 Realize revenue and profit growth by fully leveraging our alliance                         ✓
 with Roche.
                                                                                            9
New Mid-term Business Plan “IBI 21”

 Top Pharma: Qualitative Targets (2)
 Goal: A company that works proactively on a global level
Continuous creation, development, and domestic and overseas launches of
products with a competitive advantage in clinical results                                                ✓
  FDA breakthrough therapy designation for 7 times in 4 products (No. 1 in domestic pharm.)
  Establish world-class manufacturing base (completion of HEM/ALC global inspections)
Contribution to the Roche Group’s results through product-appropriate fostering
and sales                                                                                                ✓
  Maximize product value through simultaneous global development and filing of Roche products
  No. 1 customer satisfaction in strategic disease areas by establishing a system for providing new

                                                                                                         ✓
   solutions
Leadership in pharmaceutical industry activities
  Promote personalized healthcare in Japan
  Become an industry leader in biotechnology
  Lead the field of drug safety by establishing a system to provide value-added safety information
Activities in which all employees have an awareness, sense of responsibility and
pride as part of a top pharmaceutical company                                                            ✓
  Raise awareness among employees of Chugai’s goal of becoming a top pharmaceutical company
  Become a world-class company in employees engagement
  Facilitate human resource development that also creates win-win relationships at the individual
   level through collaboration with Roche
                                                                                                         10
New Mid-term Business Plan “IBI 21”

Realization of Top Pharmaceutical Company

                                                                   R&D targets
                                                                                             Status
                    Acquisition and implementation of
    Mid-Term        global top-class competitiveness
                                                                    Share and
  Business Plan      Selection and concentration for
                                                                 presence targets
                                                                                              ✓
      IBI 18               accelerated growth                   Financial targets

                         A company that works
      Top             proactively on a global level

 Pharmaceutical     A company that satisfies all its
                                                            Major quantitative
                                                                 targets                      ✓
   Company          stakeholders and receives their
                        active support and trust

                  As a most important member of the Roche group,
                  we aim to become a top Japanese pharmaceutical
   Envisioned
     Future
                     company by providing a continuous flow of
                     innovative new medicines domestically and
                                                                                              ✓
                                   internationally.
                                                                                                      11
New Mid-term Business Plan “IBI 21”

Business Environment and Vision for Growth

                                                                  12
New Mid-term Business Plan “IBI 21”

Drastic Reforms Required for Healthcare Industry
while Experiencing Big Changes in the Environment

             Mega-trends             Impact on healthcare industry
 Exponential        Remarkable
  changes           advances in          Higher benchmarks
                   life sciences          set for innovation
                     and digital
                   technologies

                                       • Falling drug prices due to
                     Dramatic
                                      clampdown on healthcare costs
                   demographic
 Simultaneous                            • Stricter evaluation of
                      shifts
 global threats                            cost-effectiveness

                     Threats to
                    sustainability   Increased calls to participate
                      of global
                  environment and      in resolving social issues
                   social systems
                                                                                 13
New Mid-term Business Plan “IBI 21”

Chugai’s Basic Policy
Striving for the mutual development of Chugai and Society by solving
social issues through the creation of innovative drugs and services

    Chugai              Creation of value shared by Chugai and Society                                 Social
  growth and
 development
                =             Realize advanced and sustainable                              =        growth and
                                                                                                    development
                                  patient-centric healthcare
 Increased                                                                                         Resolution
 corporate                                                                                          of social
   value                                                                                             issues
                                Focus on innovation
                          Creation of innovative drugs and services

                           Strategic alliance               Our science
                              with Roche                  and technologies

                         Chugai business model adopted
Sustainable    Human      Supply chain    Human        Social         Global                               Ethics and
                                                                                      Governance
Healthcare     Rights     management     Resources   Contribution   Environment                            Compliance

                          Key issues selected by Chugai (materiality)                                                   14
New Mid-term Business Plan “IBI 21”

Renewal of Core Values & Envisioned Future
                               Mission Statement
                         ~Innovation all for the p
                                                 patients~
                      Mission
No change:            Dedicate ourselves to adding value by creating and delivering
Maintain as           innovative products and services for the medical community and
                      human health around the world
starting point

                      Core Values
Change:                                      Make each patient’s wellbeing our highest
                      1. Patient Centric
Succinctly                                   priority
describe the most                            Pursue innovation by improving ourselves
                      2. Pioneering Spirit
important value                              and thinking differently
assessment criteria                          Maintain the highest standards in all we do to
                      3. Integrity
                                             create shared value with society

Change:               Envisioned Future
Redefine the aspect   Become a top innovator for advanced and sustainable patient-
of evolving with      centric healthcare, powered by our unique strength in science
society as a higher   and technology and the alliance with Roche
objective                                                                                        15
New Mid-term Business Plan “IBI 21”

FY2019-21 New Mid-term Business Plan “IBI 21”

                                                                    16
New Mid-term Business Plan “IBI 21”

Name of New Mid-Term Business Plan

 While maintaining the concept of “IBI” which express our attitude
 to pursue continuous innovation and creation, “21” expresses the
 new stage in which we will take on new challenges.

                  IBI 21
 IBI: INNOVATION BEYOND IMAGINATION

                                                                                      17
New Mid-term Business Plan “IBI 21”

New Mid-Term Business Plan: 5 Strategies
Accelerate corporate and social development through innovation
focused on innovative products
               Create global growth drivers and maximize value

      1     Value Creation                                       2    Value Delivery
         Realize innovative drug discovery                         Deliver patient-centric solution
          to cure and manage diseases                           to maximize value of growth drivers

     3    Promote advances in personalized healthcare
                      Realize the further advancement of PHC and innovate R&D process
                                      by utilizing digital technology and data

   Strengthen HR and infrastructure that support Chugai’s business

              4       Human capital and structural reform
                           Develop high-caliber HR talent that support innovation,
                            and drastically reform costs, systems and processes

                  5    Strengthen sustainable platforms
             Simultaneously realize company growth and sustainable social development
                                                                                                              18
New Mid-term Business Plan “IBI 21”

Strategy 1: Value Creation
Realize innovative drug discovery to cure and manage diseases
by integrating our core drug discovery techniques and biology,
and by achieving rapid PoC

                             Consecutive FIC/BIC generation to realize cure

                                          Maximize Value                   Enhance external
                                                                             collaboration
                                     Achieve
       Bolster IP strategy

                                      rapid         Demonstrate
                                                       value                      Promote
                                    ePoC/PoC                                   collaborative
                                                                                   study
                                                                                (e.g. IFReC)
                                    Creation of innovative drugs
                                                       Deepen
                                    Strengthen                                    Invest
                                                   understanding
                                     core drug                                  in venture
                                                    of pathology/
                                     discovery         Identify                 companies
                                    techniques     original targets
                                                                                                            19
New Mid-term Business Plan “IBI 21”

Strategy 2: Value Delivery
Maximize growth drivers (innovative drugs and services)
through patient centric consulting and digital solution

                            Maximize value of growth drivers
                               価値を創る製品戦略

                                  Provide solutions through integration
                                   between collaboration in variety of
                                    specialists and digital technology
        business in Japan
          Promote FMI

                                    Deepen 3 Divisions’        Advancement of
                                     collaboration and        treatment support/
                                    deliver sophisticated   solution utilizing digital
                                         consulting               technology

                                      Additional value to realize
                                  personalization and differentiation
                                High quality evidence          Real-time safety
                                   including RWE                 information

       Innovative drugs/services such as Hemlibra/Tecentriq                                               20
New Mid-term Business Plan “IBI 21”

Strategy 3: Promote Advances in PHC

Realize further advancements in PHC and innovate R&D process
through ‘PHC2.0’ by utilizing digital technology and data

                   Further advance PHC and innovate R&D process

Collaboration          Promote PHC 2.0 to create value                              Intelligence
 with Roche
                                           Develop high-quality                           Collect
                                              medical DB in                            information
                       Advance in           collaboration with                        incl. science
                          cancer            medical institutes                          and digital
     Utilize
                         genome                                                        technology
     Roche
                       diagnostics
    Assets
                           (FMI)
 (e.g. Flatiron)      (e.g. accelerate      Generate insights by                         Confirm
                      developing liquid        establishing data                        feasibility
                        biopsy etc.)
                                          utilization structure and                      of digital
                                          advanced data analysis                         devices
                                                                                                      21
New Mid-term Business Plan “IBI 21”

Strategy 4: Strengthen Human Capital and
Conduct Drastic Structural Reform
Recruit and develop diverse and high-caliber HR talent that
support innovation, and conduct drastic structural reforms

                      Accelerate innovation
                 by implementing strategies ①–③

                     Strengthen business platforms
    Recruit and develop HR talent         Drastic structural reform

             Strengthen                      Structural reform by
                talent                     reviewing costs, systems
            management                          and processes
               system

     Diversity          Reform
         &           remuneration
                                              Shift resources to
     Inclusion          system
                                             facilitate innovation

                                                                                      22
New Mid-term Business Plan “IBI 21”

Strategy 5: Strengthen Sustainable Platforms
With the aim of improving corporate value continuously, specify 6 priority agendas
that support our challenge toward innovation, based on expectation/request from
the society, economic/environmental/social effects by Chugai, and interest of
stakeholders.

    Corporate
      value          =       Economic value         +            Social value

                                    Quality
                                  management
     Supply chain                                                        Healthcare
     management                                                           access
                          Strong sustainable
                         platforms support our
    Dialogue with       challenge for innovation
                                                                         Social
    stakeholders
                                                                       contribution
                                      Global
                                   environment
                                                                                              23
New Mid-term Business Plan “IBI 21”

IBI 21 Quantitative Outlook
Under the new mid-term business plan, we will make essential
investment for future growth, while maintaining the momentum of
growth achieved during IBI 18, and realize sustainable profit
growth and expansion of corporate value.

    Core EPS CAGR*
                                                  High single digit**
     (2018 – 2021)
   * Compound Annual Growth Rate (%)   ** 3 years, based on constant exchange rate

                                                                                                         24
New Mid-term Business Plan “IBI 21”

Basic Policy of Shareholder Returns

                    To be distributed considering the balance
                    between internal reserves necessary for
      Profit
                    increasing corporate value, and profit
                    distribution with shareholders

                    Aim for a dividend payout ratio of 50% on
  Dividend Policy   average in comparison with Core EPS to
                    provide a stable dividend to shareholders

     FY2019
                    96 JPY (forecast)
     Dividend

                                                                                   25
New Mid-term Business Plan “IBI 21”

IBI 21 Growth Outlook
In addition to market penetration of growth drivers in Japan and
overseas, the approval and launch of satralizumab will support
further growth
                                                                  Nemolizumab, SKY59 global
                            Market penetration                     expansion
                            Revenue maximization                  Entry into new disease area

                             Tecentriq/Hemlibra market
                              penetration in Japan
                             Alecensa/Hemlibra global expansion
                             Promote FMI business
                             Satralizumab launch (JP/US/EU)

                                                                  Nemolizumab (overseas)
  New drug approvals        satralizumab (JP/US/EU)
                            Key development products
  Line extensions           Line extension of Tecentriq
    Tecentriq
    Hemlibra (JP/US/EU)                      Investment for future growth
                                                 Advances in mid-sized molecule research and
                                                  evolutions of antibody technologies
                                                 Strengthen new capabilities (digital technologies,
                                                  etc.) for future growth
                                                 Construction of new research facility and
                                                  expansion of production equipment

            IBI 18                   IBI 21                               Beyond…                      26
FY2018 Consolidated Financial Overview
(IFRS based)

                 Toshiaki Itagaki
                 Executive Vice President and CFO
                 CHUGAI PHARMACEUTICAL CO., LTD.

                 January 31/ February 1, 2019
FY2018 Consolidated Financial Overview

Full Year Results Summary

 Revenues: 579.8 billion yen (+45.6, +8.5% YoY)
• Domestic sales excl. Tamiflu: despite impact from HIP revision, slight increase due to steady
  sales growth of mainstay products (+0.8, +0.2%)
• Overseas sales: increase in exports of Actemra and Alecensa to Roche (+33.9, +36.1%)
• Royalties and other operating income: one-time income from transfer of long-term listed
  products, and from out-licensing of developed products, etc. (+17.0, +48.7%)

 Cost of sales / Operating expenses (Core basis)
• Cost of sales: the ratio to sales improved due to a change in product mix, etc. (-1.1% points,
  from 50.7% to 49.6%)
• Operating expenses: overall increase mainly due to increase of research and development
  expenses and general administration expenses, etc. (-9.5, +5.3%)
 Profits
• IFRS results: operating profit         124.3 billion yen (+25.4, +25.7%)
                net income                 93.1 billion yen (+19.6, +26.7%)
• Core results: operating profit          130.3 billion yen (+27.1, +26.3%)
                net income                  97.3 billion yen (+20.6, +26.9%)
• Core EPS (JPY):                         176.42            (+37.74, +27.2%)

                                                                                                         28
FY2018 Consolidated Financial Overview

IFRS and Core Results Jan-Dec

                                                                (Billions of JPY)
                                      Non-Core items

                                      Intangible assets:
                                         Amortization of intangible assets +1.2
                                         Impairment                        +4.8

                                      Others
                                        none

                                       Core net income
                                       attributable to Chugai
                                       shareholders                         96.7

                                                           (Millions of shares)
                                       Weighted average number
                                       of shares in issue used to
                                       calculate diluted earnings per
                                       share
                                                                            548

                                                                           (JPY)
                                       Core EPS                          176.42

                                                                                    29
FY2018 Consolidated Financial Overview
Year on Year (Core)

Financial Overview Jan-Dec

                               Royalties and other operating income            +17.0
                                  One-time income from transfer of long-
                                  term listed products, and from out-
                                  licensing developed products, etc.
                               Other financial income (expense)                 +0.5
                                  Exchange gains/losses                         +0.5
                                  Gains/Losses on derivatives                   +0.0
                                  (Gains/Losses on foreign exchange
                                  forward contracts)

                               Other Expenses                                   -1.5
                                   Settlement for transfer pricing taxation

                                Cost of sales ratio vs. Sales
                                           2017                   2018
                                         Jan – Dec              Jan – Dec
                                           50.7%                  49.6%

                                Market average exchange rate (JPY)
                                                   2017              2018
                                                 Jan – Dec         Jan - Dec
                                     1 CHF         113.90            112.92
                                     1 EUR         126.39            130.36
                                     1 USD         112.17            110.45
                                     1 SGD           81.22           81.87       30
FY2018 Consolidated Financial Overview
     Year on Year

   Sales (excl. Tamiflu) Jan-Dec
                 Sales by Disease Area,                                         Sales by Products,
               Year on Year Comparisons                                       Year on Year Changes
 (Billions of JPY)
                       +34.8, +7.2%       517.2
            482.4                                         -12.1, -36.2%
                                                                               Rituxan          Actemra
                                                                                                                       +19.7, +32.3%
                                                                                                (overseas)
                                                                               (21.3)
                           Overseas                                                                          (80.6)

                          +33.9, +36.1%    127.9                               HER2             Alecensa
             94.0                                          -2.4, -4.3%         Franchise *)     (overseas)             +15.6, +112.2%
                           Others                                              (52.8)
                                                                                                             (29.5)
                                                                                                Tecentriq
                          -3.1, -10.4%     26.8
             29.9                                                              Tarceva                        (9.1)                   +9.1, -
                        Renal Diseases                      -2.2, -21.0%
             39.3                          36.3                                (8.3)                                             (Commencing sales
                           -3.0, -7.6%                                                          Actemra                          from April, 2018)
                                                                                                                              +5.1, +15.4%
Domestic                                              Domestic                                               (38.2)
                        Bone and Joint
388.4        93.3                          100.5      389.2
                          +7.2, +7.7%                                                           Alecensa
                                                      +0.8, +0.2%                                                           +3.9, +23.4%
                                                                                                             (20.6)

                                                                                                Edirol
                                                                                                              (32.9)
                                                                                                                          +3.3, +11.1%

                          Oncology                                                              Hemlibra
                                                                                                                         +3.0, -
            225.9         -0.2, -0.1%      225.7                                                             (3.0)              (Commencing sales
                                                                                                                                from May, 2018)
                                                                                                Avastin
                                                                                                                         +2.5, +2.7%
                                                                                                             (95.6)

                                                                            *) Details of HER2 franchise
                                                                                                                         ( ): Actual sales in FY2018
             2017                           2018                           Herceptin (28.1)      -5.5, -16.4%
                                                                                                                         %: Year-on-year
                                                                           Perjeta (16.1)       +2.5, +18.4%
           Jan - Dec                      Jan - Dec                        Kadcyla (8.5)        +0.5,   +6.3%            percentage change        31
FY2018 Consolidated Financial Overview

Tamiflu Sales Trends

                                                                32
FY2018 Consolidated Financial Overview
   Year on Year (Core)

  Operating Profit Jan - Dec
(Billion of JPY)                                                                            2017      2018
                                                                 (Billions of JPY)                              Growth
                                                                                          Jan - Dec Jan - Dec
                                M&D                          Revenues                          534.2     579.8     +45.6
                                -0.9
                                       R&D                     Cost of sales                   -252.9    -261.9      -9.0
                                                             Gross profit                      281.3     317.9     +36.6
      Royalties and
                                       -5.3
                                              G&A                   Sales                       246.4     266.0    +19.6
      other operating
      income            +17.0                 -3.4                  Royalties, etc.              34.9      51.9     +17.0
                                                               Marketing and distribution       -72.8     -73.7      -0.9
                                                               Research and development         -88.9     -94.2      -5.3
Gross profit                                                   General and administration       -16.3     -19.7      -3.4
from sales                                                   Operating profit                  103.2     130.3     +27.1
                                                                 Increase in gross profit from sales                           +19.6
               +19.6                                                  Increase in export to Roche and improvement of cost
                                                                       of sales ratio to sales due to change in product mix, etc.

                                                     130.3       Increase in royalties and other operating income
                                                                 Increase in marketing and distribution expenses
                                                                                                                               +17.0
                                                                                                                                 -0.9

                        +27.1 (+26.3%)                           Increase in research and development expenses                  -5.3
                                                                       Progress of projects, etc.

103.2                                                            Increase in general and administration expenses, etc.           -3.4
                                                                       Increase in various expenses, including legal expenses and the
                                                                       enterprise tax, etc.

   2017                                                2018
 Jan - Dec                                           Jan - Dec
                                                                                                                                        33
FY2018 Consolidated Financial Overview
Year on Year (Core)

Financial Overview Oct - Dec
                               Increase in gross profit from sales               +4.4
                                  Increase in export to Roche and
                                  improvement of cost of sales ratio to sales

                               Increase in royalties and other operating
                               income                                            +2.2
                                  Increase in milestone income
                               Increase in operating expenses                    -4.0
                                  Decrease in marketing and distribution         +0.3

                                  Increase in research and development           -2..1
                                     Progress of projects, etc.
                                  Increase in general and administration, etc.   -2.2
                                      Increase in legal expenses, etc.

                                Cost of sales ratio vs. Sales

                                             2017                  2018
                                           Oct – Dec             Oct – Dec
                                             50.0%                   48.6%

                                 Market average exchange rate (JPY)
                                                     2017              2018
                                                   Oct – Dec         Oct - Dec
                                       1 CHF         114.41           113.33
                                       1 EUR         132.93           128.72
                                       1 USD         112.89           112.84
                                       1 SGD           83.38           82.04       34
FY2018 Consolidated Financial Overview
vs. Forecast (Core)

Financial Overview Jan - Dec
                               Increase in gross profit from sales                   +19.4
                                  Increase in domestic sales and export to
                                  Roche, and improvement of cost of sales
                                  ratio to sales due to a change in product
                                  mix, etc.

                               Increase in royalties and other operating
                               income                                                 +8.9
                                  Increase in one-time income from
                                  out-licensing developed products, etc.
                               Increase in operating expenses                         -6.1
                                   Increase in legal expenses and
                                   expenses for further market penetration
                                   of new products and mainstay products

                               Cost of sales ratio vs. Sales
                                             2018                   2018
                                          Jan – Dec               Jan – Dec
                                           Forecast                Actual
                                            50.6%                    49.6%
                                Exchange rate (JPY)
                                                   2018                 2018
                                                Jan – Dec            Jan – Dec
                                               Assumption             Actual *
                                     1 CHF        115.00               112.92
                                     1 EUR        133.00               130.36
                                      1 USD          111.00            110.45
                                      1 SGD           84.00            81.87
                                     * Market average exchange rate for the period
                                     Jan – Dec.                                        35
FY2018 Consolidated Financial Overview
     vs. Forecast (Core)

 Sales Progress (excl. Tamiflu) Jan - Dec
(Billions of JPY)    Sales by Disease Area,
                       Actual vs. Forecast                                          Sales by Products,
                                              517.2
             492.9         +24.3, +4.9%                                             Actual vs. Forecast
                                                                                                 Actemra
                             Overseas                         -2.1, -9.0%       Rituxan
                                                                                (21.3)                                          +7.6 +10.4%
                             +9.8, +8.3%
                                               127.9                                             (overseas)

             118.1                                                                               Tecentriq
                                                                                                              (80.6)

                              Others                             -2.1, -9.3%    Alecensa
                                                                                (20.6)                         (9.1)      +6.0, +193.5%
                            +2.6, +10.7%       26.8
              24.2         Renal Diseases                        -1.5, -15.3%
                                                                                                 Avastin

                                               36.3
                                                                                Tarceva                       (95.6)                +3.6, +3.9%
              35.3           +1.0, +2.8%
                                                                                (8.3)

                                                                                                 HER2 Franchise *)
                                                                                                                                 +3.3, +6.7%
                           Bone and Joint      100.5                                                       (52.8)
              97.1            +3.4, +3.5%                 Domestic
Domestic                                                                                         Alecensa
374.8                                                     389.2                                  (overseas)
                                                                                                                                 +3.1, +11.7%
                                                          +14.4, +3.8%                                        (29.5)
                                                                                                 Actemra
                                                                                                              (38.2)             +3.0, +8.5%
                             Oncology
                                                                                                 Hemlibra
                             +7.5, +3.4%
             218.2                             225.7                                                          (3.0)         +1.6, +114.3%

                                                                                                 Oxarol                     +1.5, +25.9%
                                                                                                              (7.3)

                                                                                   *) Details of HER2 franchise
             2018                               2018
                                                                                    Herceptin (28.1)       +1.5, +5.6%
           Jan - Dec                          Jan - Dec                             Perjeta (16.1)         +1.5, +10.3%
                                                                                                                          ( ): FY2018 Actual
                                                                                                                          %: Achievement
           Forecast                            Actual                               Kadcyla (8.5)          +0.2, +2.4%

                                                                                                                                               36
FY2018 Consolidated Financial Overview
    vs.
    YearForecast
          on Year(Core)

  Impact from Foreign Exchange
                                FX impact Jan – Dec 2018                  [Reference]
(Billions of JPY)                                                         Historical exchange rate to the JPY
                               (FX impact vs. Assumption)                                                                               Forecast rate

                                                -1.2                                                                                     1EUR 133JPY

Revenues                       Sales                               -0.7
                               Royalties and other                 -0.5
                               operating income
                                                                                                                                         1CHF 115JPY
Cost of sales                  Cost of sales                       +0.3
Operating expenses             Expenses                            +0.6

                                                                           Jan   Feb   Mar   Apr   May   Jun    Jul   Aug   Sep   Oct    Nov     Dec
Operating profit                                -0.3

                                                                                                                                        1USD: 111JPY

                                                                                                                                        1SGD 84JPY

                                                                           Jan   Feb   Mar   Apr   May    Jun   Jul   Aug   Sep   Oct    Nov      Dec
 * Actual: market average exchange rate for the period Jan - Dec
                                                                                                                                                   37
FY2018 Consolidated Financial Overview
    vs. 2017 Year End

Overview of Financial Position
                                                                  Decrease in net working capital                                      -15.6

                                                                     Decrease in inventories                                            -9.7
                                                                         Impact from front-loaded purchases in the
                                                                         previous year and transfer of long-term listed
                                                                         products, etc.
                                                                     Decrease in other net working capital                             -10.7

                                                                  Increase in long-term net operating assets                          +80.6
                           *1
                                                                     Increase in Property, plant and equipment                        +50.8
                                                                          Purchase of a business site in Yokohama for a
                                                                          new laboratory
                                                                     Increase in Other long-term assets                               +28.2
                                *2                                        Mainly decrease of the deferred income on
                                                                          applying IFRS15 and increase in long-term
                                                                          prepaid expenses for outsourcing of
                                                                          Manufacturing
                                                                  Increase in net cash                                                 +6.4
                                                                  Decrease in other non-operating assets - net                          -7.8
                                                                  Equity ratio attributable to Chugai shareholders                +1.0% pts.

                                     *3                              2018 Dec                                                         82.2%
                                                                     2017 Dec                                                         81.2%

                                                                                                           2017        2018
                                                                      FX rate to the JPY                   Dec         Dec
                                                                      (end of period)
                                                                                             1CHF           115.35     112.03
 *1 Accrued receivable, accrued payable, accrued expenses, etc.                              1EUR           134.82     126.13
 *2 Long-term prepaid expenses, long-term provisions, etc.                                   1USD           112.89     110.28
 *3 Deferred tax assets, corporate income tax payable, etc.
                                                                                             1SGD              84.39      80.07           38
FY2018 Consolidated Financial Overview
       vs. 2017 Year End
                                                                                                      Main investment for P.P.E
                                                                                                      Yokohama site:Purchase of business site
    Net Cash                                                                                          Ustunomiya: High-mix low-volume production
                                                                                                      capability for pre-filled syringe form products
                              Main investment for P.P.E                                               Ukima Plant: High-mix low-volume production of
                                                                                                      antibody API for initial commercial products
                              Ustunomiya: High-mix low-volume production
                                                                                                      Ukima Research Laboratories: Enhancement of the
                              capability for pre-filled syringe form products
                                                                                                      process development function of small- and middle-
                              Ukima: High-mix low-volume production of antibody                       molecule active pharmaceutical ingredients
                              API for initial commercial products

 (Billions of JPY)            Fujieda: Solid formulation manufacturing facility, etc.                             +4.5
                                                                                                                  Total
                                                                                                      Total
                                                                                                               investment
                                                                                                      decrease
                                                                             Operating profit         in net    -77.7 Corporate
             Total decrease in net                                                                                      income tax
                                                                             after adjustments        working
             working capital, etc.        Total investment                                                                payable,
                                                                                                      capital,
                           +14.5               Corporate                                       +147.4 etc.                  etc.
                                                                                                                                                                         Net effect
                                       -44.5  income    tax
                                                                        Net effect                                                         -30.5         Dividends       of
                                                payable,
                                                   etc.                 of                                         Operating                             paid            currency
Operating profit                                                        currency                                 Free cash flow                                          translation
after adjustments                                  -26.2      Dividends translation                                  +74.3                                               on net
                                                              paid      on net                                                                           -35.8           cash, etc.
              +121.0            Operating                                                                                                                                *1
                                                                        cash, etc.
                              Free cash flow                 -31.0      *1                                                                                              -1.5
                                  +91.0
                                                                         +4.1
                                                                                                                                      Free cash flow
                                               Free cash flow
                                                                                                                                          +43.7
                                                   +64.7
Net Cash
                                                                                   242.8                                                                                       249.2
204.9                                                                                                                     +6.4 (+2.6%)
2016 Dec                    +37.9 (+18.5%)                                         2017 Dec                                                                                    2018 Dec
 *1 Net effect of currency transactions on net cash, etc. = Transaction in own equity instruments + Net effect of currency translation on net cash(*2)

 *2 A result of using different exchange rate types when consolidating overseas subsidiaries in financial statements, i.e. net cash using end of period exchange rate
    and free cash flow using average exchange rate. (Chugai defines this term based on International Accounting Standard (IAS) 7 and IAS 21)
                                                                                                                                                                                       39
FY2018 Consolidated Financial Overview

Summary of Earnings Prospects for 2019
  Revenues: 592.5 billion yen (+12.7 +2.2% YoY)
 • Domestic sales 1): decrease due to competition with generic drugs and impact of HIP
   revision (-10.8, -2.7%)
 • Overseas sales: increase mainly due to Alecensa and Actemra export to Roche (+11.0,
   +8.6%)
 • Royalty and profit-sharing income. 2): increase in royalties from Roche for Hemlibra (+29.4,
   +122.0%)
 • Other operating income 2): decrease in one-time income from transfer of long-term listed
   products in the previous year, etc. (-16.9, -60.6%)
  Cost of sales / Operating expenses (Core basis)
 • Cost of sales: the ratio to sales will improve due to change in product mix, etc. (-1.8% points,
   from 49.6% to 47.8%)
 • Operating expenses: overall increase mainly due to the increase of research and
   development expenses from progress of projects, etc. (-9.4, +5.0%)
  Profits (Core basis)
             Operating profit          143.0 billion yen (+12.7, +9.7%)
             EPS (JPY):               198.00             (+21.58, +12.2%)

 1) Domestic sales include Tamiflu sales from FY2019.
 2) Details of Royalty and profit-sharing income and Other operating income are shown separately from FY2019.
                                                                                                                             40
FY2018 Consolidated Financial Overview
2019 Forecast (Core)

Forecast 2019 Jan - Dec
                          Increase in gross profit from sales                      +9.5
                             Despite decrease in domestic sales,
                             increase in export to Roche

                          Increase in royalties and other operating
                          income                                                  +12.6
                             Increase in royalties from Hemlibra, etc.
                          Increase in operating expenses                            -9.4
                             Increase in research and development                   -7.8
                                Progress of projects, etc.
                                Increase in research and development
                                activities

                                      Cost of sales ratio vs. Sales
                                              2018                      2019
                                            Jan – Dec                 Jan – Dec
                                               49.6%                   47.8%

                                       Exchange rate (JPY)
                                                       2018                2019
                                                    Jan – Dec           Jan – Dec
                                                     Actual *          Assumption
                                        1CHF          112.92              114.00
                                        1EUR           130.36            128.00
                                        1USD           110.45            111.00
                                        1SGD            81.87             82.00
                                      *Actual: market average exchange rate
                                       for the period of Jan – Dec.

                                                                                     41
FY2018 Consolidated Financial Overview
   2019 Forecast (Core)

Movement of Operating Profit 2017 - 2019
(Billions of JPY)

                                                                                                   Increase
                                                                                      National      in sales                 Other
                                                                                      Health        volume,                  operating
                                                                                      Insurance       etc.                   income
                                                                                                                                         Operating
                         Increase
                          in sales   Royalties,
                                                                                      drug price                Royalties,   -16.9       expenses
                                                                                      revision                  etc.
                          volume,    etc.
                                                              Operating
                                                                                                                                         -9.4
            National
                            etc.                  Other
                                                  operating
                                                              expenses                                         +29.4
            Health
            Insurance
                                                  income      -9.5
            drug price               +6.9 +10.2                                                                                                      143.0
            revision                                                                         Gross profit +22.1
                                                                          130.3

                   Gross profit +36.6
103.2

   2017                  +27.1 (+26.3%)                                      2018                   +12.7 (+9.7%)                                 2019
Jan – Dec                                                                 Jan – Dec                                                            Jan – Dec
  Actual                                                                    Actual                                                              Forecast   42
FY2018 Consolidated Financial Overview
    2019 Forecast (Core)

   Sales Forecast vs. 2018 Actual
                    Sales by Disease Area,                                                         Sales by Products,
(Billions of JPY) Year on Year Comparisons
                                                                                                 Year on Year Changes
              527.8            +0.2, +0.0%           528.0
                                                                                                   Rituxan           Hemlibra
                                  Overseas                                      -7.8, -36.6%                                                  +9.9, +330.0%
                                                                                                   (13.5)                         (12.9)
              127.9               +11.0, +8.6%        138.9
                                                                                                   Tamiflu (ordinary) Alecensa
                                 Others 1)                                         -6.7, -66.3%                                            +7.1, +24.1%
                                                                                                   (3.4)             (overseas)
                                +0.8, +2.1%
               37.5                                   38.3
                                                                                                                                  (36.6)
                              Renal Diseases                                                       Avastin           Perjeta
               36.3                                                  -6.2, -6.5%                                                                    +5.1, +31.7%
                               -4.5, -12.4%           31.8                                         (89.4)                         (21.2)

                              Bone and Joint                                                       Herceptin         Alecensa
              100.5            +2.6, +2.6%                              -4.1, -14.6%                                                               +4.5, +21.8%
Domestic                                              103.1                                        (24.0)                         (25.1)

399.9                                                            Domestic
                                                                   389.1 -3.1, -24.8%              Xeloda            Actemra
                                                                                                                                                  +4.0, +5.0%
                                                                                                   (9.4)             (overseas)
                                                                -10.8, -2.7%
                                                                                                                                  (84.6)
                                  Oncology                                                         Tarceva           Tecentriq
                                  -9.8, -4.3%                              -2.7, -32.5%                                           (13.1)
                                                                                                                                                  +4.0, +44.0%
                                                                                                   (5.6)
              225.7                                   215.9
                                                                                                   Mircera           Tamiflu
                                                                          -2.6, -11.3%                               (Govt. stockpiles)        +2.7, +540.0%
                                                                                                   (20.5)
                                                                                                                                  (3.2)

              2018                                     2019
                                                                                                                            ( ): FY2019 forecast
            Jan – Dec                               Jan – Dec             Details of HER2 franchise (54.3) +1.5 +2.8%
                                                                                                                            %: Year-on-year percentage change
                                                                             Herceptin: see the above
              Actual                                 Forecast                Perjeta: see the above
  1) Tamiflu is included in “Others” from FY2019.                            Kadcyla (9.1)      +0.6 +7.1%                                                      43
FY2018 Consolidated Financial Overview

         Outline of Hemlibra Sales to Roche
                2017                      2018                            2019                                    2020~
                                                                 1): The 2018 shipment inspected in 2019 by Roche recognized at the
                                                                 initial price in 2019
                Export at initial supply price
                                                                       2.4 billion yen
Export
sales         3.1 billion yen          2.3 billion yen                        0.0 billion yen
                                                                              Export at ordinary supply price
                                                                         2): No shipment in 2019 for the assumption of export forecast

                                                  Royalty income for initial shipment

                                               2.0 billion yen          24.4 billion yen
Royalty
and profit-               Royalty income for intellectual properties
sharing
income

                                      Profit-sharing income for co-promotion activities in UK, Germany, France, etc.

                                Expenses for co-promotion activities in UK, Germany, France, etc. shared by Chugai
Expenses

                                                                                                                                         44
FY2018 Consolidated Financial Overview

Current Status / Plan for Major Capital Investments
                 -   Building of state-of-the-art R&D site to create innovative new drug candidates
    Main         -   Simultaneous development and quick launch of therapeutic antibodies, etc.
   Objective     -   Reduction of manufacturing costs for in-house products
                 -   Enhancement of the process development function of small- and middle- molecule active
                     pharmaceutical ingredients
            2012 2013
           2012     20132014 2014
                               2015        2015 2017
                                           2016   2016           2017        2018    2019         2020        2021       2022              2026

            CPR (Singapore): Accelerate creation of clinical candidates utilizing proprietary antibody technologies
C P R

            2012-21: 476 million SGD (276 million SGD), incl. capital investments of 61 million SGD (59 million SGD)
                                                     2022-26: 282 million SGD, incl. capital investments of 21 million SGD

            Yokohama site:     Purchase of business site                                 Construction of laboratory
                                          2016-18: 43.4 billion JPY (43.0 billion JPY)   (Details to be officially announced upon final decision)

                                  Enhancement of high-mix low-volume production capability for pre-filled syringe form products
            Utsunomiya Plant:
                                  (Installment of tray filler)
Domestic

                                2013-18: 6.0 billion JPY (6.0 billion JPY)

            Ukima Plant: Enhancement of high-mix low-volume production of antibody API for initial
                            commercial products (Expansion of production capability by construction of UK3)
                                                2015-18: 37.2 billion JPY (36.7 billion JPY)

             Ukima Research       Construction of a new synthetic research building for strengthening the process development
             Laboratories:        function of small- and middle-molecule active pharmaceutical ingredients
                                                                        2018-20: 4.5 billion JPY (1.3 billion JPY)
                                                                                                                                                 45
                                                                                               ( ): Cumulative amount at the end of Dec., 2018
FY2018 Consolidated Financial Overview

Dividend Policy
Policy
 Aiming for a consolidated dividend payout ratio of 50% on average in comparison
 with Core EPS to provide a stable allocation of profit to all shareholders, taking
 into account the strategic funding needs and earnings prospects.

                                      Annual dividends per share (JPY)        Core payout ratio
                                    Interim End of FY Special      Total    Single FY 5-year average
    Dividends for
    FY2017 (Actual)
                                         29       33           -       62     44.7%        48.4%
    Dividends for                                                                                                                       96
     FY2018      (Plan)
                                         31       41         14        86     48.7%        48.6%
    Dividends for
                                                                                                                            86
    FY2019 (Forecast)
                                         48       48           -       96     48.5%        48.4%
                                                                                                                             14
                                                                                                                 62                      48
                                                                                          58
                                                                               48                      52
                                                                      45                   6
                                  40       40      40        40                                                              41
                                                                                                                  33
              Special dividends    6                                                      26           26
                                                                       23       26
    End of                                 23       20       20
      FY                           17                                                                                                    48
              Regular dividends
    Interim
                                                                                          26           26         29         31
                                   17      17       20       20        22       22

                                  2009    2010     2011     2012     2013      2014      2015        2016       2017        2018        2019   46
Overview of Development Pipeline

            CHUGAI PHARMACEUTICAL CO., LTD.
            Executive Vice President
            Co-Head of Project & Lifecycle Management Unit
            Dr. Yasushi Ito

            January 31/ February 1, 2019
Overview of Development Pipeline

New Mid-Term Business Plan: 5 Strategies
Accelerate corporate and social development through innovation
focused on innovative products
               Create global growth drivers and maximize value

      1     Value Creation                                       2    Value Delivery
         Realize innovative drug discovery                         Deliver patient-centric solution
          to cure and manage diseases                           to maximize value of growth drivers

     3    Promote advances in personalized healthcare
                      Realize the further advancement of PHC and innovate R&D process
                                      by utilizing digital technology and data

   Strengthen HR and infrastructure that support Chugai’s business

              4       Human capital and structural reform
                           Develop high-caliber HR talent that support innovation,
                            and drastically reform costs, systems and processes

                  5    Strengthen sustainable platforms
             Simultaneously realize company growth and sustainable social development
                                                                                                         48
Overview of Development Pipeline

Target during IBI 21

Create global growth drivers and maximize Value

   No. of late stage
    development                                                28
       pipeline*                          (including additional indication)
   *Projects   under development / launched products which already demonstrated PoC

 Aiming to bring middle molecule projects into the
 clinical phase, and continuously develop innovative
 novel antibody engineering technologies

                                                                                                   49
Overview of Development Pipeline

Value brought to Roche/Chugai by PHC 2.0

                          0101
                          1000
                          0101
                          1101
                          1011

Smarter more     Deep Scientific     Better, earlier Go            Faster won by
efficient R&D       Insight          / No go decision              efficient trials

                         ?
                                                                 RWD to improve
  Improve        Better patient Tx                               access based on
                                     Enhanced physician
access & PHC        matching             Tx decision                  Value

                                                    Clinical genome
 Clinical Data                                      information DB which
                                                    satisfy the requirements
  Genome information                                of regulatory filing
                                                                            Source: Roche slides
                                                                                                   50
Overview of Development Pipeline

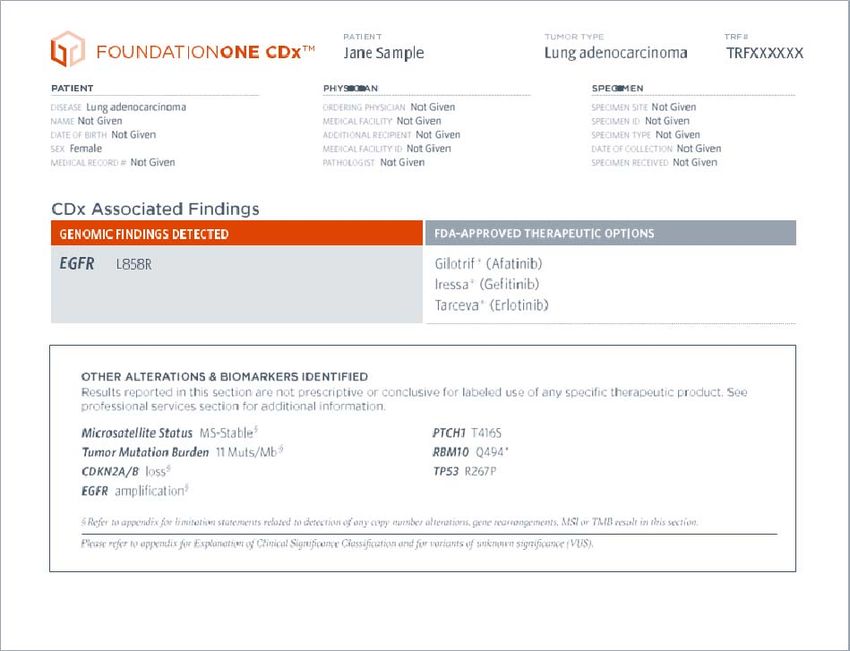
     Design of FoundationOne CDx Report

                                                                                                                                 Background
                                                                                                                           information of Patient,
                                                                                                                                Physician etc.
                                                                                                                            Summary of detected
                                                                                                                                mutations

                                                                                                                         ・Approval status of
                                                                                                                         corresponding targeted
                                                                                                                         therapies
                                                                                                                         ・Ongoing clinical trials of
                                                                                                                         detected mutations

                                                                                                                          Summary of references
                                                                                                                          on detected mutations
                                                                                                                            and candidates of
                                                                                                                                 therapy
                                                                                                                                                                     51
Source︓https://assets.ctfassets.net/vhribv12lmne/P1UbtVjOoeAcaOCWoWQkW/613003bbb4a62d6f06ab10b6e8367f92/FoundationOne_CDx_Sample_Report.pdf as of January 28, 2019
Overview of Development Pipeline

    Projects under Development (1)
    (as of January 31, 2019)

                             Phase I                        Phase II                                       Phase III                                  Filed
                       CKI27                             RG6268 /                    RG3502 / Kadcyla              AF802 (RG7853) /             RG7446 / Tecentriq
                       - solid tumors                    entrectinib                 - breast cancer               Alecensa                     - breast cancer ★
                                                         - NSCLC                     (adjuvant)                    - NSCLC (adjuvant)           - SCLC ★
                       GC33 (RG7686)
                       / codrituzumab                                                RG435 / Avastin               RG7446 / Tecentriq
                       - HCC★                                                        - RCC                         - NSCLC (adjuvant)           RG6268 / entrectinib
                                                                                     - HCC                         - urothelial carcinoma       - solid tumors ★
                       ERY974
                                                                                                                   - MIUC (adjuvant)
                       - solid tumors                                                RG7440 / ipatasertib
                                                                                                                   - RCC
                                                                                     - prostate cancer
Oncology               RG7421 / cobimetinib
                                                                                     - breast cancer
                                                                                                                   - RCC (adjuvant)
                       - solid tumors                                                                              - early breast cancer
                                                                                     RG7596 /                      - ovarian cancer
                       RG7802 /
                                                                                     polatuzumab vedotin           - prostate cancer
                       cibisatamab
                                                                                     - DLBCL                       - HCC
                       - solid tumors
                                                                                     RG6264                        - HNC (adjuvant)
                       RG7828 /
                                                                                     - breast cancer
                       mosunetuzumab
                                                                                        (Fixed-dose combination,
                       - hematologic tumors                                              subcutaneous injection)

                                                                                     NRD101 / Suvenyl (China)                                   ED-71 / Edirol
  Bone &                                                                             - knee osteoarthritis                                      (China)
   Joint                                                                             /shoulder periarthritis                                    - osteoporosis

                       EOS789
    Renal              - hyperphosphatemia

In principle, completion of first dose is regarded as the start of clinical studies in each phase.    Letters in orange: in-house projects
 HCC: hepatocellular carcinoma                    RCC: renal cell carcinoma                           ★: Projects with advances in stages since October 24, 2018
 NSCLC: non-small cell lung cancer                DLBCL: diffuse large B-cell lymphoma                ★: Multinational study managed by Chugai
 SCLC: small cell lung cancer                     HNC: head and neck carcinoma
 MIUC: muscle invasive urothelial carcinoma                                                                                                                        52
Overview of Development Pipeline

    Projects under Development (2)
    (as of January 31, 2019)
                                       Phase I                               Phase II                          Phase III                           Filed
                              RG7845 / fenebrutinib                                                   MRA (RG1569) / Actemra
                              - rheumatoid arthritis                                                  - systemic sclerosis
  Autoimmune

                              RG7935 / prasinezumab                 RG7916 / risdiplam                RG1450 / gantenerumab
                              - Parkinson's disease                 - spinal muscular atrophy         - Alzheimer's disease
                              GYM329 (RG6237)                                                         RG7412 / crenezumab
                              - neuromuscular disease                                                 - Alzheimer's disease
    Neurology                 RG7906                                                                  SA237 (RG6168) /
                              - psychiatric disorders★                                                satralizumab
                                                                                                      - NMOSD ★
                                                                                                      RG6206
                                                                                                      - DMD (PII/III)
                              PCO371                                CIM331 / nemolizumab*             RG7716 / faricimab                 ACE910 (RG6013)
                              - hypoparathyroidism                  - pruritus in dialysis            - DME                              / Hemlibra (EU)
                                                                      patients                                                           - hemophilia A
                              RG7716 / faricimab
       Others                 - wAMD                                SKY59 (RG6107)
                                                                                                                                           (non-inhibitor)
                                                                    - paroxysmal nocturnal
                              AMY109
                                                                      hemoglobinuria (PI/II)
                              - endometriosis

In principle, completion of first dose is regarded as the start of clinical studies in each phase.   Letters in orange: in-house projects
wAMD: wet age-related macular degeneration                                                           ★: Projects with advances in stages since October 24, 2018
DME: diabetic macular edema                                                                          ★: Multinational study managed by Chugai
DMD: Duchenne muscular dystrophy
NMOSD: neuromyelitis optica spectrum disorder
* Atopic dermatitis is under development by licensees [Galderma (overseas) and Maruho (Japan)]

                                                                                                                                                              53
Overview of Development Pipeline

Development Status (1)

In-
house
        ACE910 / Hemlibra®
        Routine prophylaxis to prevent or reduce the frequency of
        bleeding episodes in adults and children with hemophilia A
        without factor VIII inhibitors, administered once weekly, every two
        weeks, or every four weeks. *
           Approved in December 2018 (Japan)
           Filed in January 2019 (Taiwan)

        Routine prophylaxis to prevent or reduce the frequency of
        bleeding episodes in adults and children with hemophilia A
        with factor VIII inhibitors, administered once weekly.
          Approved in December 2018 (Taiwan)

          * Additional dosing options of every two weeks or every four weeks in adults
           and children with hemophilia A with factor VIII inhibitors are also included.
                                                                                           54
Overview of Development Pipeline

Development Status (2)
 In-        RG7446 / Tecentriq®
 licensed
             Previously untreated unresectable advanced or recurrent non-
              squamous NSCLC (combination with Avastin and chemotherapy)
              - Approved in December 2018
             SCLC (1L)
              - Filed and designated as an Orphan drug in December 2018
             Triple negative breast cancer (1L)
              - Filed in December 2018
             HER2 positive early breast cancer (neoadjuvant)
              (combination with Herceptin and Perjeta)
              - Started global Phase 3 study (IMpassion050) in January 2019

 In-        RG6268 / entrectiniab
 licensed
             NTRK fusion positive solid tumors
              Filed and designated as an Orphan drug in December 2018
 In-        RG7906
 licensed
             Psychiatric disorders
              Started Phase 1 study in January 2019                                  55
Overview of Development Pipeline

Other Progress

 FMI
 business
            FoundationOne ® CDx / Cancer Genomic profile
             Gene mutation analysis program for solid tumors
              (for use in cancer genome profiling)
              Somatic gene mutation analysis program (for use in assessing
              anticancer drug indications)
                 - Approved in December 2018
             Expanded use as companion diagnostic for entrectinib
                 - Filed in January 2019

 In-
 house
            SA237 / satralizumab
             NMO / NMOSD
              Breakthrough Therapy Designation by the U.S. FDA in
              December 2018

                                                                                  56
Overview of Development Pipeline

 Results of Clinical Trials / Conference (1)
               In-          SKY59 (RG6107)
               house
                            Paroxysmal Nocturnal Hemoglobinuria (PNH)
                            Interim analysis data of Phase 1/2 study in patient subjects presented at the
                            American Society of Hematology (ASH) in December 2018
                             Complete complement inhibition was achieved for all PNH patients treated
                                with SKY59 and good control of intravascular hemolysis was shown
                             SKY59 was well tolerated and no severe adverse events were observed

Mean LDH Levels                                     Mean LDH Levels
                                                                                      Blue : Treatment naïve PNH patients
                                                                                      Brown:ECU pre-treated PNH patients
                                                                                               switched to SKY59
  LDH (U/mL)

                                                      LDH (U/mL)

                                                                                              LIA : Liposome Immuno Assay
                                                                                              LDH: lactate dehydrogenase
                                                                                              ECU: Eculizumab

                       Time (days)                                 Time (days)                      Source : ASH (2018) slides   57
Overview of Development Pipeline

Results of Clinical Trials / Conference (2)

 In-
 house
         SA237 / satralizumab
          NMOSD
          Primary end point was met in SAkuraStar study (Phase 3) in
          December 2018
           Satralizumab routine administration statistically reduced
           the risk of relapse as primary endpoint compared to placebo

 In-
 house
         CIM331 / nemolizumab
          Atopic dermatitis
          Primary end point was met in Phase 2b study conducted by
          Galderma in October 2018
           Nemolizumab improved Eczema Area and Severity Index
           (EASI) scores from baseline compared to placebo

                                                                                58
Overview of Development Pipeline

Projected Submissions
(Post PoC NMEs and Products)                                           as of January 31, 2019
                                                                    NME        line extension            ipatasertib
                  Filed                            in-house                                              (RG7440)
                                                                                                         Prostate Cancer
                       EDIROL                      in-licensed
  TECENTRIQ            (ED-71)                     NSCLC: non-small cell lung cancer
  (RG7446)                                                                                                                     nemolizumab*
                       Osteoporosis                RCC: renal cell carcinoma                             TECENTRIQ
  SCLC                                                                                                                         (CIM331)
                       (China)                     SCLC: small cell lung cancer                          (RG7446)
                                                                                                                               Pruritus in
                                                   MIUC: muscle invasive urothelial carcinoma            HNC (adjuvant)
                       HEMLIBRA                                                                                                Dialysis Patients
                                                   HCC: hepatocellular carcinoma
  TECENTRIQ            (ACE910/RG6013)
                                                   HNC: head and neck carcinoma                                                faricimab
  (RG7446)             Hemophilia A
                       non-inhibitor               DLBCL: diffuse large B-cell lymphoma                  AVASTIN               (RG7716)
  Breast Cancer
                       (EU)                        NMOSD: neuromyelitis optica spectrum disorder         (RG435)
                                                                                                                               Diabetic Macular
                                                   FDC: fixed-dose combination                           HCC
  entrectinib                                      sc: subcutaneous injection                                                  Edema
  (RG6268)
                                                                                                                              crenezumab
  Solid tumors                                   TECENTRIQ                                               TECENTRIQ            (RG7412)
  (NTRK+)                                        (RG7446)                                                (RG7446)
                                                                                                                              Alzheimer’s
                                                 Ovarian Cancer                                          HCC
                                                                                                                              Disease

                                                                        risdiplam                                              gantenerumab
                                                 AVASTIN                                                 TECENTRIQ
                                                                        (RG7916)                                               (RG1450)
                                                 (RG435)                                                 (RG7446)
                                                                        Spinal Muscular                  Prostate Cancer       Alzheimer’s
                                                  RCC
                                                                        Atrophy                                                Disease

                                                                        RG6206                           TECENTRIQ
                                                 TECENTRIQ                                                                     ALECENSA
                                                                        Duchenne                         (RG7446)
                                                 (RG7446)                                                                      (AF802/RG7853)
                                                                        Muscular                         Early
                                                 RCC                                                                           NSCLC (adjuvant)
                                                                        Dystrophy                        Breast Cancer

  ACTEMRA              satralizumab              TECENTRIQ              ipatasertib                      TECENTRIQ             RG6264
  (MRA)                (SA237/RG6168)            (RG7446)               (RG7440)                         (RG7446)              (FDC, sc)
  Systemic Sclerosis   NMOSD                     MIUC (adjuvant)        Breast Cancer                    RCC (adjuvant)        Breast cancer

                       SUVENYL                                          KADCYLA                          TECENTRIQ
  entrectinib          (NRD101)                  TECENTRIQ              (RG3502)                                               polatuzumab vedotin
                                                                                                         (RG7446)
  (RG6268)             Knee Osteoarthritis       (RG7446)               Breast Cancer                                          (RG7596)
                                                                                                         Urothelial
  NSCLC (ROS1+)        /Shoulder Periarthritis   NSCLC (adjuvant)       (adjuvant)                                             DLBCL
                       (China)                                                                           Carcinoma

                  2019                                           2020                                        2021 and beyond
                                                 *Atopic dermatitis is under development by licensees [Galderma (overseas) and Maruho (Japan)]       59
Overview of Development Pipeline

Updates on the Development Requests for
Unapproved Drugs/Indications
Review Committee of Development Requests for Unapproved Drugs/Indication
• 1st round requests: all approved (ten indications, including additional dosages and
                      administrations of eight products)
• 2nd round requests: all approved (three indications of three products)
• 3rd round requests: requests were made for three indications of three products, including
                      additional dosages and administrations, and two of them were approved
  Product                         Indication                                           Current Status
              Additional dosage and administration for ovarian          Submitted company opinion and
  Avastin®
              cancer                                                    waiting for evaluation by the committee
• 4th round requests: requests were made for four indications of four products and one of
                      them was approved

  Product                         Indication                                           Current Status
                                                                        Submitted company opinion and
  Xeloda®     Neuroendocrine tumor
                                                                        waiting for evaluation by the committee
                                                                        Submitted company opinion and
  Avastin®    Cerebral edema induced by radiation necrosis
                                                                        waiting for evaluation by the committee
              Combination treatment with chemotherapy                   Submitted company opinion and
 Neutrogin®
              including fludarabine for relapsed/refractory AML         waiting for evaluation by the committee
                                               Letters in orange: projects with advances in status since July 26, 2018   60
Contacts: Corporate Communications Dept.
Media Relations Group
Tel: +81 (0)3-3273-0881 Fax: +81 (0)3-3281-6607
e-mail: pr@chugai-pharm.co.jp
Tomoko Shimizu, Hiroshi Araki, Chisato Miyoshi, Yayoi Yamada,
Shumpei Yokoyama

Investor Relations Group
Tel: +81 (0)3-3273-0554 Fax: +81 (0)3-3281-6607
e-mail: ir@chugai-pharm.co.jp
Toshiya Sasai, Takayuki Sakurai, Tomoyuki Shimamura,
Sachiyo Yoshimura
You can also read