NHFIC - First Home Loan Deposit Scheme and New Home Guarantee Trends & Insights Report 2020-21

Page created by Dwight Vargas
 
CONTINUE READING
NHFIC - First Home Loan Deposit Scheme and New Home Guarantee Trends & Insights Report 2020-21
NHFIC
    National Housing Finance
    and Investment Corporation

First Home Loan Deposit Scheme
and New Home Guarantee
Trends & Insights Report
2020–21
NHFIC - First Home Loan Deposit Scheme and New Home Guarantee Trends & Insights Report 2020-21
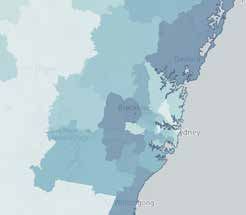
About the First Home Loan Deposit Scheme and New Home Guarantee / 2

                                                About the First Home
                                                Loan Deposit Scheme and
                                                New Home Guarantee
The First Home Loan Deposit                     The First Home Loan Deposit Scheme (FHLDS) is an Australian Government
Scheme (FHLDS) and New Home                     initiative to support eligible first home buyers to purchase their first home sooner.
Guarantee (NHG) are Australian                  The Scheme launched on 1 January 2020 with two major lenders and
Government initiatives to support               25 non-major lenders on 1 February 2020 (a total of 27 lenders) offering
                                                guaranteed loans, and Scheme places not taken up in financial year 2019–20
eligible home buyers purchase
                                                (2019–20) were made available during financial year 2020–21 (2020–21).
their first home sooner.
                                                The New Home Guarantee (NHG) was introduced to help first home buyers
                                                purchase a new home sooner. The Australian Government announced the NHG
                                                on 6 October 2020 as part of the 2020 Budget, and the NHG commenced on
                                                2 November 2020, with 10,000 Scheme places released for the financial year.
                                                This research paper covers the FHLDS and NHG data for 2020–21.
                                                Under FHLDS and NHG, eligible first home buyers can purchase a home with
                                                a deposit of as little as 5%. This is because NHFIC guarantees Scheme lenders
                                                up to 15% of the value of the property financed by an eligible first home buyer’s
                                                home loan. Under the NHG, first home buyers must either build a new dwelling or
                                                purchase a newly built dwelling.
                                                Buyers must satisfy certain eligibility requirements, including that they have a
                                                taxable income under $125,000 per annum in the previous financial year if they
                                                are a single applicant ($200,000 for a couple), and that the intended purchased
                                                property is subject to the property price caps set by the Australian Government,
                                                which differ across Australia, financial years and Schemes.
                                                More information about the Schemes is available on the NHFIC website.

Schemes administered by NHFIC as at 1 July 2021

                                                 First Home Loan
Name                                                                           New Home Guarantee*          Family Home Guarantee
                                                 Deposit Scheme

                                          Commenced on 1 January 2020
                                                                                   Commenced on                 Commenced on
                                          for major banks and 1 February
                                                                                  2 November 2020                1 July 2021
                                               for non-major lenders

Purpose                                                                                                      To help single parents
                                             To help first home buyers         To help first home buyers
                                                                                                           with dependants purchase
                                          purchase their first home sooner   purchase a new home sooner
                                                                                                                 a family home

Minimum deposit                                         5%                              5%                            2%

Scheme places made available in that financial year

2019–20                                               10,000

2020–21                                               10,000                           10,000

2021–22                                               10,000                           10,000              10,000 for a 4 year period

*Previously known as FHLDS (New Homes)
NHFIC - First Home Loan Deposit Scheme and New Home Guarantee Trends & Insights Report 2020-21
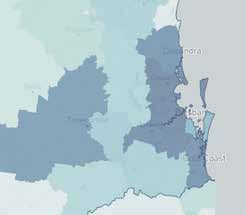
Contents / 3

Contents

Contents
About the First Home Loan Deposit Scheme
and New Home Guarantee                                                                             2

Introduction                                                                                       4

Key points                                                                                         5

Key trends and insights under FHLDS and NHG                                                        8

Key scheme financials                                                                            20

State and territory analysis                                                                     22

© National Housing Finance and Investment Corporation 2021. Apart from any use as permitted under
the Copyright Act 1968 all other rights are reserved. You are not permitted to re-transmit, distribute
or commercialise the information or material without seeking prior written approval from the National
Housing Finance and Investment Corporation.
NHFIC - First Home Loan Deposit Scheme and New Home Guarantee Trends & Insights Report 2020-21
Introduction / 4

                                                              Introduction

                                                              Record low interest rates and government assistance have helped support buyer
                                                              confidence and the housing market more generally throughout the COVID-19
                                                              pandemic. First home buyers have been front and centre of the economic recovery,
                                                              recording their highest proportion of all owner-occupier buyers in over a decade
                                                              over the course of 2020–21.1 This has been underpinned by record amounts of
                                                              monetary and fiscal support, including the Government’s Homebuilder program,
                                                              various state and territory programs, as well as two low-deposit home loan
                                                              guarantee initiatives for first home buyers, the:
                                                              1. First Home Loan Deposit Scheme (FHLDS) – On 1 July 2020, the
                                                              Commonwealth Government released its second round of FHLDS guarantees.
                                                              This provided another 10,000 guarantees that, subject to eligibility and lender
                                                              credit criteria, allowed first home buyers on modest incomes to purchase a home
                                                              with a deposit of as little as 5% of the value of the property.
                                                              2. New Home Guarantee (NHG) – Commencing on 2 November 2020, the NHG
                                                              allows first home buyers with as little as 5% deposit to build a new dwelling or
                                                              purchase a newly built dwelling. The NHG will be available until 30 June 2022.
                                                              More recently, the Government also introduced the Family Home Guarantee (FHG),
                                                              offering eligible single parents with dependants the opportunity to purchase a new
                                                              home with a deposit as low as 2%.2
                                                              The first report on the operation of the FHLDS between 1 January 2020 to
                                                              30 June 2020 was published in August 2020. This report provides an annual
                                                              snapshot of the operation of the FHLDS and the NHG for the 12 months from
                                                              1 July 2020 to 30 June 2021, as well as broader trends since the scheme’s initial
                                                              implementation on 1 January 2020.

1   Australian Bureau of Statistics, Lending Indicators, July 2021.
2   Trends in the Family Home Guarantee will be covered in the next annual snapshot.
Key points / 5

                        Key points

Since January 2020      The schemes have supported tens of thousands
                        of Australians in purchasing their first home,
                        contributing to strong first home buyer demand
                        •   Since 1 January 2020, almost 33,000 Australians were supported in
                            purchasing their first home by either the FHLDS or the NHG. The top two
                            states supported under the schemes were NSW (11,000 residents) and Qld
                            (9,000 residents).
30,000                  •   Between 1 January 2020 and 30 June 2021, the Commonwealth Government
low deposit home            guaranteed more than $1.4 billion in deposit shortfalls for new homeowners
                            across Australia, with almost three quarters of this issued in 2020–21.
loan guarantees
have been offered       •   In 2020–21, first home buyers entered the housing market at the highest rate
to Australian first         since the Global Financial Crisis. Around one in ten of all first-time homeowners3
home buyers                 during this period were supported by a FHLDS or NHG guarantee. This includes
                            more than one in seven of all first home buyers in Qld and almost one in seven
                            in NSW.

                        Younger first home buyers made up
                        a considerable portion of recipients
                        •   In 2020–21, support under the FHLDS and NHG was concentrated in younger
                            first home buyer cohorts, with 58% of all buyers under the schemes aged

$1.4b                       under 30. This compares with 42% according to a survey of recent first home
                            buyers outside of the schemes.4 The schemes also supported almost 300 people
in deposit shortfalls       aged over 50 to buy their first home.
guaranteed by the       •   Compared with the previous financial year, guarantees under the FHLDS in
Commonwealth                2020–21 were taken up by the 18–24 age cohort at a greater rate, representing
Government                  nearly one in four of all buyers (compared with one in six in 2019–20). Under
                            NHG, home buyers tended to be older (on average) with more than a quarter
                            of all demand from buyers aged above 35 (compared with around one fifth
                            under FHLDS).

1 in 10 first
homebuyers
made use of
FHLDS or NHG

                        3   Refers to first home buyer owner-occupied loan commitments. ABS, Lending Indicators, July 2021.
                        4   Genworth First Home Buyer Report 2020, https://www.genworth.com.au/media/yrzb5ouj/genworth-fhb-report_
                            v1_final.pdf
Key points / 6

Since January 2020   The schemes achieved broad geographical
                     coverage, with strong representation under
                     FHLDS from regional areas
                     •   Under FHLDS, regional representation during 2020–21 remained relatively stable,
                         with around 37% of all applications moving to a new home located outside of
                         major cities. For comparison, a sample of the broader first home buyer market
                         showed that 31% were purchasing in regional areas.5 More people accessing the
                         NHG bought in greater capital city areas relative to FHLDS, with three quarters of

37%                      all NHG-assisted purchases occurring in major cities.
                     •   Both FHLDS and NHG had strong representation across the country, with first
of FHLDS
                         home buyers across all states and territories benefiting. NHG saw stronger
applications were        take up in Vic, Qld and WA relative to population shares, likely due to other
for regional areas       complementary stimulus rolled out in those states.

25%                  •   Demand across Australia for FHLDS loans was strongest in Melbourne’s
                         north-west (particularly Craigieburn, Mickleham and Donnybrook), with 109
for NHG                  guarantees issued. For the NHG, Sydney’s north-west (particularly Box Hill,
                         Marsden Park and Riverstone) recorded the largest volume of guarantees (158).
                     •   Seven of the top ten postcodes for FHLDS in 2020–21 were also in the top ten
                         postcodes in 2019–20, including 4350 (Toowoomba, Qld), 3977 (South East
                         Melbourne, Vic), and 4305 (Ipswich, Qld).

                     Key workers accounted for a significant
                     proportion of the support given under the
6,000                schemes, allowing this cohort to enter the
key workers
were supported       home ownership market for the first time
in purchasing
                     •   Together, the FHLDS and NHG helped more than 3,700 key workers purchase
their first home         their first home during 2020–21, accounting for 23% of all guarantees issued
                         over this period.
                     •   Of these key workers, 35% were nurses, 34% were teachers, and 11% were
                         emergency service workers.
                     •   This brings the total number of key workers supported under the schemes to
                         almost 6,000 since 1 January 2020, of which, 36% were teachers, 34% were
                         nurses and 11% were emergency service workers.

                     5   A survey was conducted of the broader first home buyer portfolio for lenders participating in the schemes.
Key points / 7

Since January 2020   Buyers were willing to move further away from
                     their existing residence to buy their first home,
                     particularly those under the NHG
                     •   First home buyers accessing the NHG typically bought further away from their
                         former residence compared with those using the FHLDS, suggesting purchases
                         were concentrated in outer greenfield areas. On average, first home buyers
                         under the NHG moved 13km away (compared with 8.4km under FHLDS), with
                         some buying up to 90km from their immediate previous residence.

6,000                •   Consistent with FHLDS loan guarantees in 2019–20, in Australia’s largest cities,
                         the schemes helped people to buy new homes in the middle and outer rings
new homes                where homes are more affordable. For example, almost two-thirds of all scheme
were built under         recipients in Greater Sydney moved into a new home at least 30km away from
the schemes              the city’s central business district.
                     •   Since late 2020, when the NHG commenced, more than half of all guarantees
                         issued under the two schemes have been for new homes. Of the guarantees
                         issued under the NHG, more than three-quarters were for housing
                         construction-related activity.6

                     Over time, the schemes have recorded
                     improvements to debt risk and overall
72%                  mortgage serviceability, supported by falling
of NHG guarantees
originated from
                     interest rates and increased income levels
the broker channel   •   Despite increasing property prices, the amount of debt first home buyers
                         accumulated under FHLDS relative to incomes has declined modestly.
                         On average, FHLDS participants recorded a lower debt-to-income ratio of
                         4.78 in 2020–21, down from 4.92 in 2019–20.
                     •   Mortgage serviceability has improved during 2020–21 for first home buyers
                         under FHLDS (on average). For example, first home buyers with a FHLDS
                         guarantee used around 23% of their income to pay off their mortgage, down
                         from 25% in 2019–20.
                     •   The proportion of loans originating from broker channels has dramatically
                         increased over the last 12 months, most likely driven by COVID restrictions.
                         FHLDS guarantees in 2020–21 via broker channels made up 56% of total loans,
                         up from 48% in the previous year. The proportion of NHG guarantees in 2020–
                         21 originating from broker channels was 72%. Feedback from lenders who are
                         actively participating in the schemes suggests that broker participation is now in line
                         with broker proportions across the lenders’ wider loan portfolio.

                     6   Referring to house and land package purchases or separate land purchase with a contract to build.
Key trends and insights under FHLDS and NHG / 8

                                                            Key trends and insights
                                                            under FHLDS and NHG

                                                            Since 1 January 2020….
                                                            Almost 33,000 Australians are now living in a home supported by either
                                                            FHLDS or NHG, supporting both strong construction activity and key
                                                            workers entering the housing market
                                                            Since 1 January 2020, 30,000 low deposit home loan guarantees have been offered
                                                            to Australian first home buyers under the FHLDS and NHG (see Figure 1). Nearly
                                                            all of the 20,000 FHLDS guarantees, and approximately two-thirds of the 10,000
                                                            NHG guarantees, have been taken up.

                                                            Figure 1: Scheme take-up since 1 January 2020

23,000                                                       As at 30 June 2021                        FHLDS 2019–20            FHLDS 2020–21              NHG 2020–21

home                                                         Guarantees offered by                           10,000                    10,000                   10,000

purchases
                                                             Australian Government

                                                             Guarantees to be rolled-over to                  1,848                      N/A                      N/A
across Australia                                             next financial year7
supported by the                                             Guarantees rolled-over                            N/A                     1,848                      N/A
schemes                                                      from previous financial year*

                                                             Total guarantees on offer                       10,000                    11,848                   10,000

                                                            By 30 June 2021, the vast majority of guarantees offered under FHLDS
                                                            (94.1% in 2019–20 and 93.4% in 2020–21) had been settled. Of the 10,000
                                                            NHG guarantees, 41% had settled by 30 June.
                                                            Of the 30,000 scheme places made available since 1 January 2020, 22,879 homes
                                                            have been purchased, in which at least 32,962 Australians9 are now residing.
                                                            The schemes meant that, amid the COVID-19 pandemic and a time of economic
                                                            uncertainty over the last 18 months, almost 6,000 key workers were able to enter
                                                            the home ownership market for the first time.
                                                            Construction activity was also supported over the period with almost 6,000 new
                                                            homes built10 with the help of a FHLDS or NHG guarantee since 1 January 2020.

7   The Federal Government has rolled over all unused guarantees under FHLDS 2019–20 (1,848 guarantees) into 2020–21. These places were made available from early 2021.
8   Scheme places made available but not taken up by a participating lender.
9   This figure only accounts for the individuals who applied for the guarantee. It does not include the applicants’ other family members who may have moved into the home at the
    same time.
10 Referring to house and land package purchases or separate land purchase with a contract to build.
Key trends and insights under FHLDS and NHG / 9

                                                      Over the 2020–21 financial year….
                                                      2020–21 saw the strong take up of places under the FHLDS and NHG

                                                      In 2020–21, 21,848 Scheme places were made available to first home buyers
                                                      through both the FHLDS and the NHG, which was only in operation for eight
                                                      months of this financial year.11 All but one of the FHLDS places were taken up by
                                                      30 June 2021. At the same time, two thirds of NHG places were taken up, as it had
                                                      only been operating since late 2020.

                                                      Figure 2: Take-up of Scheme places made available during 2020–21 (as at 30 June 2021)

                                                      FHLDS 2020–21                                                                                                             99.99%

                                                                                                       NHG 2020–21                                               67%

                                                       FHLDS 2019–20                                                                        100%
                                                      rolled over places

                                                                                                                                    0               2,000               4,000            6,000              8,000            10,000

                                                                                                                                                            ■ Places taken up ■ Places expired

                                                      FHLDS and NHG helped to support decade high first
                                                      home buyer purchases

                                                      The schemes have played a part in first home buyer loan commitments rising to their
                                                      highest proportion of owner occupiers since the GFC. In 2020–21, first home buyers
                                                      accounted for more than 40% of all owner-occupied buyers, with around 1 in 10 of
                                                      all first home buyer commitments during this period supported by a FHLDS or NHG
                                                      guarantee.12 Record low interest rates, other government stimulus, and a favourable
                                                      environment to buy (versus renting) also, drove the significant increase in first home
                                                      buyer activity.

                                                      Figure 3: First home buyer loan commitments – Australia February 2008 to June 2021

                                                                                                                 50                                                                                                        20,000
                                                      FHBs as a proportion of total owner-occupied lending (%)

                                                                                                                                         FHBs as a proportion of total owner-occupied lending (LHS)
                                                                                                                                                                                                                                    Number of FHB loan commitments

                                                                                                                 40                                                                                                        16,000

                                                                                                                 30                                                                                                        12,000

                                                                                                                                        Number of FHBs (RHS)

                                                                                                                 20                                                                                                        8,000
11 10,000 new places were offered through FHLDS
   and 10,000 new places offered through NHG,
   with 1,848 rolling over from 2019–20.
12 Refers to first home buyer owner-occupied loan                                                                10                                                                                                        4,000
   commitments. ABS, Lending Indicators, July 2021.                                                                   2008   2009   2010    2011   2012   2013   2014    2015   2016   2017   2018   2019   2020    2021
Key trends and insights under FHLDS and NHG / 10

Across the states and territories, representation ranged from 14.1% of loans in NSW
to around 3.1% in the NT. The lower representation in some states is likely due to
other permanent first home buyer support. For example, WA and SA also have low
deposit loan schemes known as Keystart and HomeStart, respectively.

Figure 4: FHLDS guarantees as a proportion of total first home buyer loan
commitments within each state/territory (July 2020 to June 2021)

                                           14.1
                                      14
                                                  12.7
                                      12
FHLDS guarantees as a proportion of

                                      10
    total loan commitments (%)

                                                         8.8        8.6
                                       8
                                                                             6.6
                                                                                      6.2
                                       6
                                                                                               5.2

                                       4
                                                                                                        3.1

                                       2

                                       0
                                           NSW    Qld    Vic       ACT       SA       WA       Tas      NT
Key trends and insights under FHLDS and NHG / 11

                                                                Profile of first home buyer under both FHLDS and NHG

                                                                In 2020–21, more than one-third of all guarantees were issued to single applicants
                                                                earning less than $80,000 – well below the $125,000 eligibility income threshold.
                                                                The median property price for single applicants was $397,000 under FHLDS and
                                                                $465,000 under NHG, with gender distribution broadly equal across both schemes.
                                                                For comparison, a sample of the broader first home buyer market showed that
                                                                59% of single home purchasers were male and 41% were female.13 14 Guarantees
                                                                issued to couples were concentrated in the higher joint income brackets – between
                                                                $100,000 and $125,000 – with a higher median property purchase price of
                                                                $474,500 under FHLDS and $548,500 under NHG.

                                                                Figure 5: Profile of typical buyers under the FHLDS and the NHG for 2020–2115

                                                                          Profile of the                                                                      Profile of the
                                                                        median single buyer                                                                median couple buyer

                                                                     FHLDS                   NHG                                                       FHLDS                   NHG

                                                                    $397,000             $465,000                   Purchase price                   $474,500              $548,500

                                                                                 25–29                                Age bracket                                 25–29

                                                                     $60 – $80k per annum                        Household income                    $100 – $125k per annum

                                                                  52% female           47% female
                                                                   48% male             53% male                      Gender split                          –                    –

                                                                       95%                   92%                 Loan to value ratio                     95%                  94%

13 A survey was conducted of the broader first home buyer portfolio for lenders participating in the schemes.
14 0.5% of single purchasers were classified as ‘Other’ under the broader first home buyer portfolio survey.
15 Gender distributions are based on assumptions made using the participant’s name title (i.e. ‘Mrs’, ‘Mr’, ‘Ms’, ‘Miss’.). The analysis is only indicative. It does not account for
   individuals who identify with a different gender than that suggested by the name title provided.
Key trends and insights under FHLDS and NHG / 12

                                                                            FHLDS and the NHG supported higher concentrations of younger
                                                                            Australians across all states, some people in older age cohorts
                                                                            also benefited

                                                                            In 2020–21, around 9 in 10 guarantees were provided to buyers aged under 40.
                                                                            This includes 57.8% who were 29 years old and below. For comparison, a recent
                                                                            survey of recent first home buyers outside of the schemes showed 41.5% were at
                                                                            or below 29 years of age. A further 43.3% were between 30 and 39 years of age.16
                                                                            Almost 300 guarantees were also provided for people aged in their 50s and 60s.
                                                                            Compared with the previous financial year, in 2020–21, guarantees under the
                                                                            FHLDS were taken up by the 18–24 age cohort at a greater rate, representing
                                                                            23% of all buyers (compared with 17% in 2019–20). Under NHG, on average,
                                                                            home buyers tended to be older, with more than a quarter of all demand from
                                                                            buyers aged above 35 (compared with 19% under FHLDS).

                                                                            Figure 6: Distribution of guarantees under FHLDS and NHG – by age range17
                                                           Proportion of first home buyers under the schemes (%)

                                                                                                                  40

                                                                                                                  35

                                                                                                                  30

                                                                                                                  25

                                                                                                                  20

                                                                                                                  15

                                                                                                                  10

                                                                                                                  5

                                                                                                                  0
                                                                                                                       18–24      25–29    30–34        35–39      40–49      50–59        60+

                                                                                                                               ■ FHLDS 2019–20     ■ FHLDS 2020–21     ■ NHG 2020–21

16 Genworth First Home Buyer Report 2020, https://www.genworth.com.au/media/yrzb5ouj/genworth-fhb-report_v1_final.pdf
17 The distribution by age is based on individual buyers, rather than scheme places. Those who submitted their scheme application as a couple have been treated as two
   separate individuals.
Key trends and insights under FHLDS and NHG / 13

                                                        In 2020–21, people accessing FHLDS guarantees were concentrated in similar
                                                        income brackets to those in 2019–20. But there were some differences between
                                                        FHLDS and NHG. Generally, a larger share of joint applications were made under the
                                                        NHG (almost 50% versus just over 40% under FHLDS 2020–21), tending to put its
                                                        applicants into higher household income ranges.

                                                        Figure 7: Distribution of guarantees under FHLDS – by taxable household income range18

                                                                                                         20
                                                        Proportion of first home buyers under FHLDS (%)

                                                                                                         15

                                                                                                         10

                                                                                                         5

                                                                                                         0
                                                                                                               Up to    $37,001 to   $45,001 to   $60,001 to   $80,001 to $100,001 to $125,001 to $150,001 to $180,001 to
                                                                                                              $37,000    $45,000      $60,000      $80,000      $100,000   $125,000    $150,000    $180,00     $200,00

                                                                                                                                       ■ Single applicant            ■ Joint applicants

                                                        Figure 8: Distribution of guarantees under NHG – by taxable household income range18

                                                                                                         15
                                                          Proportion of first home buyers under NHG (%)

                                                                                                         10

                                                                                                          5

                                                                                                          0
                                                                                                               Up to    $37,001 to   $45,001 to   $60,001 to   $80,001 to $100,001 to $125,001 to $150,001 to $180,001 to
                                                                                                              $37,000    $45,000      $60,000      $80,000      $100,000   $125,000    $150,000    $180,00     $200,00

                                                                                                                                       ■ Single applicant            ■ Joint applicants

18 Income data captured under the scheme is for 2019–20. First home buyers’ financial circumstances may have changed between 30 June 2020 and when the guarantee
   was issued.
Key trends and insights under FHLDS and NHG / 14

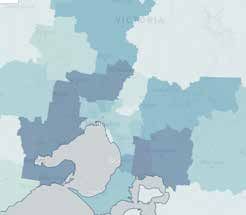
                                                            FHLDS and NHG supported first home buyers across the country,
                                                            with NHG having particularly strong take up in Vic, Qld and WA
                                                            relative to population share

                                                            Similar to the initial 10,000 places offered in its first year, FHLDS guarantees in
                                                            2020–21 broadly aligned with population shares around the country.19 In contrast,
                                                            NHG guarantees were more concentrated in states such as Qld and WA, compared
                                                            with population share. This was offset by reduced demand in NSW. The stronger
                                                            representation in states like Qld and WA is likely driven by complementary
                                                            construction stimulus measures in these states and interstate migration trends.
                                                            For example, at the height of the pandemic in 2020, WA was offering financial
                                                            assistance of as much as $80,000 or around 15% of the property price threshold.20
                                                            Under FHLDS in 2020–21, both regional and metropolitan areas were well
                                                            represented, with 63% of all guarantees used to buy homes in greater capital city
                                                            regions and the remaining 37% in regional areas. This compares with 67.7% of
                                                            Australians residing in the greater capital city regions.21 According to a sample of the
                                                            broader first home buyer market, 69% of purchases were made in greater capital
                                                            city regions and 31% were purchasing in regional areas.22 Demand was greater in
                                                            the major cities for the NHG, with 75.6% of all guarantees located in the greater
                                                            capital city regions.

Figure 9: Distribution of guarantees issued under the Scheme compared with population23

      40

      35    34 35
                         32
      30                                                      29
                                 26 26 27                          26
      25                                              24 24
                    22
                                            20
      20
(%)

      15                                                                                                                   14

                                                                                                                                10
      10
                                                                                                             7     7   7
                                                                                                 4       5
      5                                                                                              4
                                                                           2   2       2                                             2          2
                                                                                   1                                                     1
Key trends and insights under FHLDS and NHG / 15

                                                        NHG seeing strong representation in
                                                        Queensland and Western Australia
                                                        Government stimulus and interstate migration trends can be seen as potential
                                                        driving factors behind the strong take-up under NHG in Qld and WA.
                                                        As shown in Figure 9, 27% of the NHG-assisted guarantees were issued in Qld and
                                                        14% were in WA, compared with 20% and 10% resident population respectively.
                                                        At the same time, NSW, which was home to around 32% of Australia’s resident
                                                        population, only received 22% of the new home purchases under NHG.
                                                        The net overseas migration shock has placed the greatest pressure on major eastern
                                                        seaboard states such as NSW and Vic. However, at the same time, Qld has been
                                                        the greatest benefactor of Australians migrating between regions. The volume of
                                                        residents moving from NSW, and more recently from Vic, into Qld has spurred on
                                                        greater demand for housing within the state.

                                                        Figure 10: Net interstate migration (quarterly), 2015 to 202024

                                                                                              10,000
                                                      Population change (number of persons)

                                                                                                                                                                    Qld

                                                                                               5,000
                                                                                                                                                                  Vic
                                                                                                   0
                                                                                                                   SA
                                                                                                                                                     WA
                                                                                               -5,000
                                                                                                                                    NSW

                                                                                              -10,000
                                                                                                        2015      2016        2017        2018    2019       2020         2021

                                                        In WA, the introduction of unprecedented government stimulus into the housing
                                                        construction market has pushed the state’s NHG distributional representation
                                                        higher. For example, a first home buyer accessing a guarantee under the NHG could
                                                        receive approximately $80,000 in state and federal government stimulus which
                                                        equates to almost 20% of the median purchase price for properties being bought
                                                        under the scheme.

                                                        Figure 11: Maximum state and federal stimulus benefit for new home buyer under NHG25

                                                                     State                                         Max. stimulus benefit          Level of assistance as a
                                                                                                                 value for first home buyer      percentage of the median
                                                                                                               (up until 31 December 2020)       property value under NHG

                                                                     WA                                                  ~$82,000                         19.6%

                                                                     NT                                                  ~$95,000                         18.9%

                                                                     Vic                                                 ~$80,000                         14.9%

                                                                     Tas                                                 ~$59,000                         13.8%

                                                                     Qld                                                 ~$63,000                         13.3%

                                                                     NSW                                                 ~$89,000                         13.3%

                                                                     SA                                                  ~$54,000                         12.6%
24 Australian Bureau of Statistics, National, state
   and territory population, March 2021.                             ACT                                                 ~$47,000                          9.2%
25 Stimulus benefits in this analysis include
   HomeBuilder, First Home Owner Grant, stamp
                                                        The subdued level of demand in NSW relative to the strong take-up in Qld and
   duty concessions, Lenders Mortgage Insurance
   savings under NHG and other building bonus           WA were not limited to the NHG cohort. Demand for the Australian Government’s
   grants available at 31 December 2020.                HomeBuilder initiative also illustrated similar trends. In NSW, new build HomeBuilder
26 Australian Government, The Treasury, HomeBuilder     applications accounted for 15.7% of total applications across Australia, compared
   Total Applications as at 25 June 2021, https://
   treasury.gov.au/coronavirus/homebuilder.
                                                        with 21.8% and 16.6% for Qld and WA respectively.26
Key trends and insights under FHLDS and NHG / 16

                                                              Buyers under NHG are moving further from their current home
                                                              relative to FHLDS guarantee recipients

                                                              On average in 2020–21, buyers under the NHG moved 13km away (compared with
                                                              8.4km under FHLDS in the same year), with some buying up to 90km from their
                                                              immediate previous residence.27 This suggests more people buying a home under
                                                              NHG purchased in outer city rings in greenfield areas where a significant portion of
                                                              new housing is being constructed.28
                                                              In Tasmania, people moved around 27km away from their immediate residence
                                                              to purchase a home under NHG – more than three times the distance than people
                                                              receiving a FHLDS guarantee in the same state. This may be due to there being
                                                              fewer high-rise buildings across the state and more residential spread into outer
                                                              city areas.29
                                                              Compared with the previous financial year, the distance from their previous
                                                              residence to their new home for FHLDS guarantee recipients increased in all states
                                                              and territories, albeit modestly.

                                                              Figure 12: Median distance between purchased property and immediate previous
                                                              residence under the Scheme30

                                                                           30
                                                                                                                                                                                   27.0

                                                                           25

                                                                           20
                                                           Distance (km)

                                                                           15                                                                                         14.6
                                                                                                                                            12.9         13.5
                                                                                                                             11.7                                  11.0
                                                                                                           8.9                                                  10.4
                                                                           10
                                                                                      7.2 7.4                          7.6                7.7      7.7 7.8                   7.6 7.9
                                                                                                 6.4 6.5         6.9
                                                                                5.9                                                 6.2
                                                                           5

                                                                           0
                                                                                  ACT               SA             Qld                WA            NSW            Vic         Tas

                                                                                                ■ FHLDS 2019–20                ■ FHLDS 2020–21 ■ NHG 2020–21

                                                               Strong demand for middle city and outer ring areas within eastern
                                                               seaboard cities

                                                               In 2020–21, buyers under the schemes in larger cities like Sydney and Melbourne
                                                               continued to be concentrated in outer and middle city rings. For example, in Sydney
                                                               just one in five of all home purchases supported by FHLDS or NHG were bought
                                                               within 15km of the CBD. Compared with the first release of FHLDS guarantees,
                                                               buyers bought further away from the CBD in Sydney, Brisbane and Adelaide. In the
                                                               smaller cities such as Canberra, Hobart and Adelaide, first home buyers purchased
                                                               much closer to the CBD.

27 Distance calculations were based on postcodes, rather than individual addresses. The relevant geocodes were then applied to calculate the distance from one postcode to
   another. The majority of first home buyers under Schemes in the NT purchased a property in the same postcode as their previous residence.
28 Australian Bureau of Statistics, 2020–21 Building Approvals, June 2021.
29 Australian Bureau of Statistics, Census of Population and Housing, 2016.
30 Distance calculations were based on postcodes, rather than individual addresses. The relevant geocodes were then applied to calculate the distance from one postcode to
   another. The majority of first home buyers under the schemes in the NT purchased a property in the same postcode as their previous residence.
Key trends and insights under FHLDS and NHG / 17

Figure 13: Distance from purchased property to capital city CBD – proportion of guarantees by distance bands31

Scheme               Distance               Adelaide             Brisbane            Canberra              Hobart              Melbourne               Perth              Sydney
                     from CBD

FHLDS                0–15km                  31.79%              25.81%               43.53%              67.27%                 24.11%              30.46%               21.21%
2020–21
                     15–30km                 45.70%              44.91%               44.40%              12.73%                 30.66%              32.03%               20.41%

                     30–50km                 22.52%              25.33%                                    5.45%                 33.45%              27.58%               29.92%

                     50-100km                                     3.94%               12.07%              14.55%                 11.78%               9.93%               28.46%

NHG                  0–15km                  45.71%               8.83%               34.04%              22.22%                  9.89%              13.17%               11.67%
2020–21
                     15–30km                 20.00%              56.11%               38.30%              11.11%                 42.99%              45.12%               15.30%

                     30–50km                 33.47%              26.96%                                   27.78%                 33.10%              29.73%               56.03%

                     50–100km                 0.82%               8.10%               27.66%              38.89%                 14.01%              11.98%               16.99%

Proportion of guarantee

10%                       70%

Figure 14: Top 5 postcodes by number of guarantees issued under FHLDS 2020–21 and top 5 postcodes by number of guarantees
issued under NHG

                                                                                                               NHG
                                                                                                               Location: 4306, Ipswich, Qld
                                                                                                               No. Guarantees: 84

                                                                                                                                   FHLDS
                                                                                                                                   Location: 4305, Ipswich, Qld
                                                                                                                                   No. Guarantees: 89
                                                                                               FHLDS
                                                                                               Location: 4350,
                                                                                               Toowoomba, Qld
                                                                                               No. Guarantees: 98                     FHLDS
                                                                                                                                      Location: 4207, Logan-Beaudesert, Qld
                                                                                                                                      No. Guarantees: 95

                                                                                                                                     NHG
                                                                                                                                     Location: 2765, Sydney,
                                                                                                                                     Blacktown, NSW
                                                                                                                                     No. Guarantees: 158

                                                               FHLDS                                           NHG
                                                               Location: 3064,
                                                                                                               Location: 3064,
                                                               Melbourne – North West, Vic
                                                                                                               Melbourne – North-West, Vic
                                                               No. Guarantees: 109
                                                                                                               No. Guarantees: 101

                                                                                                                    NHG
                                                                       NHG                                          Location: 3978,
                                                                       Location: 3029,                              Melbourne – South East, Vic
                                                                       Melbourne – West, Vic                        No. Guarantees: 107
                                                                       No. Guarantees: 116

                                                                                                     FHLDS
                                                                                                     Location: 3977,
                                                                                                     Melbourne – South East, Vic
                                                                                                     No. Guarantees: 93

31   Distance calculations were based on postcodes, rather than individual addresses. The relevant geocodes were then applied to calculate the distance from one postcode to another.
Key trends and insights under FHLDS and NHG / 18

                                                            By postcode, demand for FHLDS in 2020–21 was highest in 3064 in Melbourne’s
                                                            north-west, particularly in the suburbs of Craigieburn, Mickleham and Donnybrook
                                                            (109 guarantees issued). Other postcodes with large amounts of first home
                                                            buyers supported by FHLDS were 4350 in Toowoomba Qld (98), 4207 in
                                                            Logan-Beaudesert Qld (95) 3977 in South East Melbourne (93) and 4305
                                                            in Ipswich Qld (89).
                                                            For NHG, demand was highest in the postcode of 2765 in Sydney’s north-west
                                                            (particularly in the suburbs of Box Hill, Marsden Park and Riverstone), with 158
                                                            guarantees issued.
                                                            In terms of the FHLDS scheme, seven of the top ten postcodes in 2020–21 were
                                                            also in the top ten postcodes in 2019–20, namely 3064 (North West Melbourne,
                                                            Vic), 4350 (Toowoomba, Qld), 3977 (South East Melbourne, Vic), 4305 (Ipswich,
                                                            Qld), 3029 (Melbourne West, Vic), 2830 (Dubbo, NSW), and 2570 (Outer South-
                                                            West Sydney, NSW).

                                                            Almost one in four guarantees have helped key workers buy their
                                                            first home
                                                            The schemes have helped more than 3,700 key workers purchase their first home,
                                                            with key workers accessing 23% of all guarantees issued in 2020–21. Of these
                                                            key workers, 35% were nurses, 34% were teachers, and 11% were emergency
                                                            service workers.

                                                            Figure 15: Distribution of key workers who purchased homes under the FHLDS or
                                                            NHG, 1 July 2020 to 30 June 202132

                                                                      Social
                                                                     workers
                                                                      3.0%               Child carers
                                                                                           10.4%
                                                                          Other
                                                                          0.5%

                                                                                Aged and
                                 Nurses                                      disabled carers
                                                                                  6.6%
                                 34.8%
                                                                                                                          Teachers
                                                                                                                           34.1%
                                                                       Emergency
                                                                        services
                                                                         10.6%

32 Occupations classified as key workers: pre-primary, primary and secondary school teachers; nurses; childcare workers; carers and aides; defence force members, firefighters
   and police; ambulance officers and paramedics; and social and welfare professionals.
Key trends and insights under FHLDS and NHG / 19

                                                           Along with other government stimulus, NHG has supported strong
                                                           construction activity during the economic recovery
                                                           Since the NHG commenced on 2 November 2020, more than half of all guarantees
                                                           issued under FHLDS and NHG have been for new homes. Of the NHG guarantees
                                                           issued, three-quarters were for housing construction-related activity.33 The main
                                                           drivers in the uptick of construction activity include the Federal Government’s
                                                           HomeBuilder payment and, state grants and concessions.

                                                           Figure 16: Proportion of Scheme guarantees issued for new construction

                                                                                       ■ New dwellings         ■ Established dwellings

                                                            Prior to NHG launch           14%                               86%

                                                                Post NHG launch                          54%                             46%

                                                               NHG guarantees
                                                                                                                 76%                           20%   4%
                                                               by purchase type

                                                                                        ■ Construction activity
                                                                                          (separate land and build/house and land packages)
                                                                                        ■ Newly constructed dwelling
                                                                                        ■ Off the plan

33 Referring to house and land package purchases or separate land purchase with a contract to build.
Key scheme financials / 20

                                                            Key scheme financials

                                                            Over time, the schemes have recorded
                                                            improvements to debt risk and overall
                                                            mortgage serviceability, supported by falling
                                                            interest rates and increased income levels
                                                            A key objective of the schemes is to support Australians in entering the housing
                                                            market sooner.
                                                            Similar to 2019–20, those without alternative financial means or access to the
                                                            schemes would have otherwise delayed their home purchase by around four years to
                                                            save the entire 20% deposit. For borrowers under the NHG, this delay is slightly higher
                                                            and closer to four and a half years.34
                                                            The ability for Australians to purchase their first home sooner is further evidenced
                                                            by the targeting of younger cohorts and reduced financial capacity for buyers
                                                            under the schemes. As mentioned earlier in this report, 58% of all buyers under
                                                            the schemes were aged under 30, compared with 42% for other first home buyers
                                                            outside of the schemes.35
                                                            The loan-to-value ratio under FHLDS and NHG were concentrated at or around 95%.
                                                            This is compared with a sample of the broader first home buyer portfolio between
                                                            80% and 85%.36 According to a recent survey of prospective first home buyers, only
                                                            19% were proposing to have a deposit of less than 10%.37
                                                            Despite the average loan-to-value ratio being lower for NHG (92%) compared with
                                                            FHLDS (95%), debt relative to income is higher for NHG borrowers. This is mainly
                                                            due to the higher price thresholds under NHG resulting in larger levels of debt.
                                                            On average in 2020–21, first home buyers under NHG borrowed 5.5 times their
                                                            combined annual taxable income, while FHLDS applicants borrowed 4.8 times their
                                                            combined annual taxable income. Compared with the previous financial year, on
                                                            average FHLDS participants recorded a lower debt-to-income ratio, down to 4.78
                                                            from 4.92 in 2019–20.

                                                            Figure 17: National Scheme financial statistics for 2020–21

                            First Home Loan Deposit                                                                 New Home Guarantee

 4 years Home purchases brought forward by four years                                    4 years        Home purchases brought forward by four years

   95%         Participants are borrowing 95% of the purchase price                        92%          Participants are borrowing 92% of the purchase price

   4.8x        Debt equates to 4.8 times borrowers’ annual income                           5.5x        Debt equates to 5.5 times borrowers’ annual income

 $561m Government guaranteed $561m of deposit shortfalls $314m                                          Government guaranteed $314m of deposit shortfalls

34 NHFIC has revised the bring forward analysis published in the 2020 First Home Loan Deposit Scheme Trends & Insights paper. Figures are only indicative as household savings
   rates will differ based on individual circumstances.
35 Genworth First Home Buyer Report 2020, https://www.genworth.com.au/media/yrzb5ouj/genworth-fhb-report_v1_final.pdf
36 A survey was conducted of the broader first home buyer portfolio for lenders participating in the schemes.
37 Genworth First Home Buyer Report 2020, https://www.genworth.com.au/media/yrzb5ouj/genworth-fhb-report_v1_final.pdf
Key scheme financials / 21

                                                             Mortgage serviceability (mortgage repayments as a proportion of income) also
                                                             improved for FHLDS loans in 2020–21 compared with the previous year, falling
                                                             from a median of 24.5% to 23%.38 With debt levels remaining relatively stable
                                                             over the periods, improved serviceability has been likely driven by a combination
                                                             of reduced interest rates, along with a potential for increased savings due to the
                                                             COVID-19 pandemic.
                                                             At 30 June 2021, the Commonwealth Government had guaranteed more than
                                                             $1.4 billion in deposit shortfalls for new home owners across Australia, with no
                                                             mortgage defaults occurring under the schemes. Almost three-quarters of this was
                                                             issued in 2020–21.
                                                             The proportion of loans originating from broker channels increased dramatically
                                                             over the last 12 months. In 2020–21, the proportion of guarantees originating from
                                                             broker channels was 72% under NHG and 56% under FHLDS, up from 48% in the
                                                             previous year. Feedback from lenders who are actively participating in the schemes
                                                             suggests that broker participation has increased due to a lift in awareness of the
                                                             FHLDS and NHG, and is now in line with broker proportions across the lenders’
                                                             wider loan portfolio.

                                                             Figure 18: Loans guaranteed by origination channel

FHLDS 2019–20                                             48%                                                             37%                     10%        5%

FHLDS 2020–21                                                   56%                                                              30%               9%        5%

   NHG 2020–21                                                              72%                                                         18%             8%    2%

                                                       ■ Mortgage Broker            ■ Bank Branch ■ Mobile Lender                  ■ Other

38 Mortgage serviceability is calculated using annual repayments as a proportion of annual taxable income/s for settled loans.
State and territory analysis / 22

State and territory analysis
FHLDS and NHG

New South Wales
                                                                                                           Sydney

                                                                                                         Guarantees issued

                                                                                                         less than 5            600

NSW                                                                       Number of guarantees             Median property purchase             Median deposit paid by
                                                                                issued                               price                            borrower

FHLDS 2019–20                       Greater capital city region                     1,895                              $620,000                          $34,800

                                    Regional areas                                  1,434                              $415,000                          $22,700

FHLDS 2020–21                       Greater capital city region                     1,954                              $620,000                          $34,300

                                    Regional areas                                  1,414                              $415,000                          $22,500

NHG 2020–21                         Greater capital city region                      766                               $720,000                          $39,800

                                    Regional areas                                   295                               $533,300                          $35,000

Top 10 NSW postcodes by number of guarantees issued in 2020–2139

Postcode        Location

2765            Sydney – Blacktown

2570            Sydney – Outer South West (Camden and Wollondilly)

2179            Sydney – South West (Bringelly and Green Valley)

2259            Central Coast – Wyong

2830            Dubbo

2650            Wagga Wagga

2560            Sydney – Outer South West (Campbelltown)

2557            Sydney – South West (Bringelly and Green Valley)

2250            Central Coast – Gosford

2750            Sydney – Outer West and Blue Mountains (Penrith)

39 Location is provided based on the postcode correspondence to statistical areas as defined by the Australian Statistical Geography Standard published by the Australian Bureau
   of Statistics. A combination of Statistical Area 2, 3 and 4 names have been used in the table for clarification on the location.
State and territory analysis / 23

Victoria

                                                                                                           Melbourne

                                                                                                         Guarantees issued

                                                                                                         less than 5            600

Vic                                                                       Number of guarantees             Median property purchase             Median deposit paid by
                                                                                issued                               price                            borrower

FHLDS 2019–20                       Greater capital city region                     1,767                              $520,000                          $30,000

                                    Regional areas                                   557                               $345,000                          $21,000

FHLDS 2020–21                       Greater capital city region                     1,814                              $525,000                          $30,000

                                    Regional areas                                   514                               $350,000                          $21,000

NHG 2020–21                         Greater capital city region                     1,127                              $565,000                          $38,400

                                    Regional areas                                   268                               $468,200                          $40,300

Top 10 Vic postcodes by number of guarantees issued in 2020–2140

Postcode        Location

3064            Melbourne – North West (Tullamarine and Broadmeadows)

3029            Melbourne – West (Wyndham – Hoppers Crossing and Tarneit)

3978            Melbourne – South East (Casey – Cranbourne East)

3977            Melbourne – South East (Casey – Cranbourne)

3335            Melbourne – West (Melton – Rockbank and Hillside)

3217            Geelong

3030            Melbourne – West (Wyndham – Werribee)

3810            Melbourne -– South East (Cardinia)

3338            Melbourne – West (Melton South)

3336            Melbourne – West (Melton – Rockbank and Mount Cottrell)

40 Location is provided based on the postcode correspondence to statistical areas as defined by the Australian Statistical Geography Standard published by the Australian Bureau
   of Statistics. A combination of Statistical Area 2, 3 and 4 names have been used in the table for clarification on the location.
State and territory analysis / 24

Queensland

                                                                                                           Brisbane

                                                                                                         Guarantees issued

                                                                                                         less than 5            600

Qld                                                                       Number of guarantees             Median property purchase             Median deposit paid by
                                                                                issued                               price                            borrower

FHLDS 2019–20                       Greater capital city region                     1,218                              $412,500                          $22,500

                                    Regional areas                                  1,340                              $340,000                          $19,100

FHLDS 2020–21                       Greater capital city region                     1,293                              $411,000                          $22,500

                                    Regional areas                                  1,231                              $351,200                          $19,800

NHG 2020–21                         Greater capital city region                      820                               $486,500                          $33,000

                                    Regional areas                                   492                               $454,800                          $33,400

Top 10 Qld postcodes by number of guarantees issued in 2020–2141

Postcode        Location

4306            Ipswich – Inner and Hinterland

4207            Gold Coast, Logan and Beaudesert

4350            Toowoomba

4209            Gold Coast (Ormeau and Oxenford)

4305            Ipswich – Inner and Hinterland

4818            Townsville

4300            Ipswich – Springfield and Redbank

4503            Moreton Bay – South

4740            Mackay, Isaac and Whitsunday

4670            Wide Bay – Bundaberg

41 Location is provided based on the postcode correspondence to statistical areas as defined by the Australian Statistical Geography Standard published by the Australian Bureau
   of Statistics. A combination of Statistical Area 2, 3 and 4 names have been used in the table for clarification on the location.
State and territory analysis / 25

Western Australia

                                                                                                            Perth

                                                                                                         Guarantees issued

                                                                                                         less than 5            600

WA                                                                        Number of guarantees             Median property purchase             Median deposit paid by
                                                                                issued                               price                            borrower

FHLDS 2019–20                       Greater capital city region                      581                               $350,900                          $19,800

                                    Regional areas                                    55                               $265,000                          $15,000

FHLDS 2020–21                       Greater capital city region                      666                               $360,000                          $19,800

                                    Regional areas                                    57                               $266,000                          $14,800

NHG 2020–21                         Greater capital city region                      659                               $427,700                          $27,300

                                    Regional areas                                    31                               $355,800                          $26,200

Top 10 WA postcodes by number of guarantees issued in 2020–2142

Postcode        Location

6055            Perth – North East (Swan)

6112            Perth – South East (Armadale)

6171            Perth – South West (Rockingham)

6164            Perth – South West (Cockburn)

6069            Perth – North East (Swan)

6210            Mandurah

6056            Perth – North East (Swan and Mundaring)

6170            Perth – South West (Kwinana)

6167            Perth – South West (Kwinana)

6122            Perth – South East (Serpentine and Jarrahdale)

42 Location is provided based on the postcode correspondence to statistical areas as defined by the Australian Statistical Geography Standard published by the Australian Bureau
   of Statistics. A combination of Statistical Area 2, 3 and 4 names have been used in the table for clarification on the location.
State and territory analysis / 26

South Australia

                                                                                                            Adelaide

                                                                                                         Guarantees issued

                                                                                                         less than 5            600

SA                                                                        Number of guarantees             Median property purchase             Median deposit paid by
                                                                                issued                               price                            borrower

FHLDS 2019–20                       Greater capital city region                      353                               $344,000                          $19,500

                                    Regional areas                                    77                               $210,000                          $11,100

FHLDS 2020–21                       Greater capital city region                      265                               $355,000                          $19,800

                                    Regional areas                                    89                               $208,800                          $10,800

NHG 2020–21                         Greater capital city region                      237                               $440,000                          $26,600

                                    Regional areas                                    16                               $380,200                          $20,300

Top 10 SA postcodes by number of guarantees issued in 2020–2143

Postcode        Location

5251            Adelaide – Central and Hills (Mount Barker)

5290            South Australia – South East (Mount Gambier – East)

5115            Adelaide – North (Playford)

5162            Adelaide – South (Morphett Vale and Woodcroft)

5116            Adelaide – North (Gawler – South)

5114            Adelaide – North (Playford)

5117            Adelaide – North (Playford)

5085            Adelaide – North (Port Adelaide – East)

5108            Adelaide – North (Salisbury)

5118            Adelaide – North (Gawler – North and South)

43 Location is provided based on the postcode correspondence to statistical areas as defined by the Australian Statistical Geography Standard published by the Australian Bureau
   of Statistics. A combination of Statistical Area 2, 3 and 4 names have been used in the table for clarification on the location.
State and territory analysis / 27

Tasmania

                                                                    Hobart

Guarantees issued

less than 5           600

 Tas                                   Number of guarantees issued                   Median property purchase price                 Median deposit paid by borrower

 FHLDS 2019–20                                          75                                         $361,000                                        $20,000

                                                        84                                         $270,000                                        $14,500

 FHLDS 2020–21                                          45                                         $365,000                                        $20,000

                                                        70                                         $265,000                                        $14,400

 NHG 2020–21                                            17                                         $458,700                                        $31,700

                                                         6                                         $357,500                                        $26,500

Top 10 Tas postcodes by number of guarantees issued in 2020–2144

 Postcode       Location

 7310           West and North West (Devonport)

 7320           West and North West (Burnie and Ulverstone)

 7140           South East (Central Highlands)

 7250           Launceston and North East

 7315           West and North West (Burnie and Ulverstone)

 7016           Hobart – North East (Risdon Vale)

 7010           Hobart – North West (Glenorchy, Derwent Park and Montrose)

 7172           Hobart (Sorell and Richmond)

 7019           Hobart – North East (Rokeby)

 7248           Launceston and North East

44 Location is provided based on the postcode correspondence to statistical areas as defined by the Australian Statistical Geography Standard published by the Australian Bureau
   of Statistics. A combination of Statistical Area 2, 3 and 4 names have been used in the table for clarification on the location.
State and territory analysis / 28

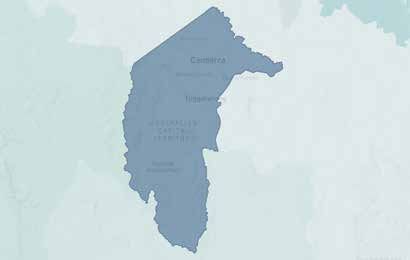
Australian Capital Territory

  Canberra

                                                                                                         Guarantees issued

                                                                                                         less than 5            600

ACT                                     Number of guarantees issued                  Median property purchase price                 Median deposit paid by borrower

FHLDS 2019–20                                           200                                        $439,500                                        $24,300

FHLDS 2020–21                                           205                                        $425,000                                        $24,000

NHG 2020–21                                              42                                        $509,400                                        $29,300

Top 10 ACT postcodes by number of guarantees issued in 2020–2145

Postcode        Location

2611            Urriarra, Namadgi and Weston Creek

2913            Gungahlin

2617            Belconnen

2615            Belconnen

2602            North Canberra

2914            Gungahlin

2906            Tuggeranong – Condor and Gordon

2606            Woden Valley

2912            Gungahlin

2900            Tuggeranong – Greenway

45 Location is provided based on the postcode correspondence to statistical areas as defined by the Australian Statistical Geography Standard published by the Australian Bureau
   of Statistics. A combination of Statistical Area 2, 3 and 4 names have been used in the table for clarification on the location.
State and territory analysis / 29

Northern Territory                          46

                                                                                                         Darwin

                                                                                                      Guarantees issued

                                                                                                      less than 5         600

NT                                      Number of guarantees issued                  Median property purchase price         Median deposit paid by borrower

FHLDS 2019–20                                           39                                        $347,500                                $18,600

FHLDS 2020–21                                           30                                        $300,000                                $17,500

NHG 2020–21                                              5                                        $504,100                                $26,400

46 Due to insufficient sample size we are not reporting on the top NT postcodes for guarantees.
You can also read