North Coast Regional Planning Unit, 2021 - 2024 Humboldt County Workforce Development Board - Scott Adair Economic Development Division Director ...
←
→
Page content transcription
If your browser does not render page correctly, please read the page content below
North Coast Regional Planning Unit, 2021 – 2024
Humboldt County Workforce Development Board

                      Scott Adair
         Economic Development Division Director
                     707-476-4800
               sadair@co.humboldt.ca.us

                           1
ANALYTICAL OVERVIEW OF THE REGION
• Provide an analysis of current employment and unemployment data.
• Provide an analysis of the current educational and skill levels of the workforce, the current
needs of employers in the region, and any relevant skill gaps between the two.
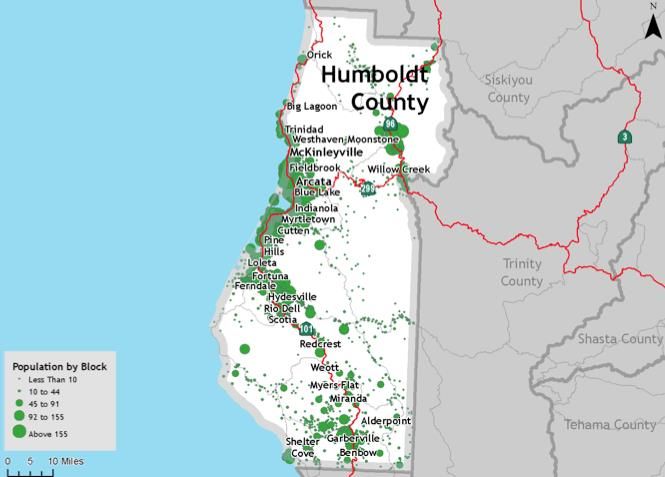
Demographic Profile
Humboldt County has approximately 135,500 residents, with 3,203 employer establishments in
2018.1 According to EDD, the labor force in December 2020 was 60,700, a 2.9% decrease
compared to a year ago.2 Relatively low population density, low traffic congestion and quick
commute times contribute to a high-quality rural lifestyle. Eureka, the county seat and
population hub, houses approximately 27,000 residents. Arcata, the second most populated city
in the county, is home to more than 18,000 residents as well as Humboldt State University, one
of the largest employers in the county. It is followed by Fortuna, the third largest incorporated
city with nearly 12,000 residents. Rio Dell is home to approximately 3,400, and Ferndale has
nearly 1,400. Trinidad, the smallest incorporated city, has about 300 permanent residents and
Blue Lake has 900. The population of unincorporated Humboldt County is approximately
72,000. McKinleyville is the largest unincorporated community with just over 17,000 residents;
Garberville has a population of approximately 900. Willow Creek, in eastern Humboldt County,
has about 1,500 residents and Scotia, at the southern end of the Eel River Valley, has
approximately 550 inhabitants.3 (It is also worth noting that different governmental and analytic
documents sometimes refer to the Humboldt region as the Redwood or North Coast.). Most of
Humboldt’s population is clustered along the 101 Corridor, as shown in the map below.4
American Indian Demographic Profile
For context while viewing the following data, it is important to note that underrepresentation in
demographic data has been problematic for years in American Indian and Alaska Native
communities. Limitations in the U.S. Census data methodology, as well as in the race and ethnic
categorization, provides a limited demographic view of the total tribal membership in
Humboldt County. Some of the methodological limitations include the fact that Census tribal
data is geographically based, only capturing those tribal members residing on tribally owned
lands and thus is not a comprehensive count of the members of any tribe in Humboldt County.
A pertinent example is the Yurok Tribe of the Yurok Reservation, straddling Del Norte and
Humboldt Counties. The tribe has an enrollment of approximately 5,600 individuals, making it
one of the numerically largest tribes in the state. However, the 2019 Census estimates only
captures the 836 members residing directly on the Yurok Reservation, as the remaining Yurok
tribal members live in surrounding communities, as well as across the state and nation. It is
1
QuickFacts, https://www.census.gov/quickfacts/humboldtcountycalifornia
2
https://www.labormarketinfo.edd.ca.gov/file/lfmonth/humbopds.pdf
3
Source for population figures: US Census Bureau
4
Humboldt County Economic and Demographic Profile 2018, Center for Economic Development, CSU Chico.
https://tinyurl.com/y263om65. Support provided by Rural County Representatives of California.
2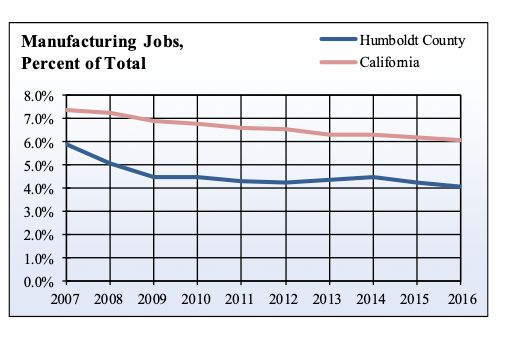
important to remember that these off-reservation enrolled members typically retain significant
social, cultural, and economic connections to tribal lands, activities, and economic resources.

Another issue influencing the Census data occurs when respondents are asked to self-identify
their race on Census surveys. Tribal members may choose to self-identify their race in diverse
ways, which can result in a reduced number of respondents being categorized strictly as
American Indian and Alaska Native. In 2019, a total of 7,073 Humboldt County residents self-
identified as American Indian and Alaska Native, making up 5.2 percent of the county’s total
population. However, in the category of people of two or more races, an additional 5,385
respondents self-identified as White / American Indian and Alaska Native. The two categories
combined represent 12, 458 Humboldt County residents, which equals 9.2 percent of the
county’s total population. As there is no inherent link between self-identification with either of
these categories and tribal affiliation, respondents in either category may be enrolled tribal
members of a tribe located within the county, affiliated with tribal groups outside the area, or
not formally affiliated with any tribe but still retaining important connections to local tribal
community. However, at this time the Census data provides the best available data for
measuring tribal demographics. Using this limited data set, it is possible to assess some general
trends which may affect other tribal members not captured by the surveys.

 2019 Labor Force and
 Employment Status
                               Resig    Table    Trini      Yur     Big    Blue            Rohner
            Category                                                              Hoopa
                                hini    Bluff    dad        ok    Lagoon   Lake             ville
 Population 16 years and
 over                             16        89       126    657        5     56 2,337          15

 In labor force                    9        43        69    314        0     43 1,156           8

 Civilian labor force              9        43        69    314        0     43 1,156           8

 Employed                          9        37        59    261        0     43 1,054           8

 Unemployed                        0         6        10     53        0      0 102             0

 Armed Forces                      0         0         0      0        0      0 -               0

 Not in labor force                7        46        57    343        5     13 1,181           7

 Civilian labor force              9        43        69    314        0     43 1,156           8
                                                     14.5   16.
 2019 Unemployment Rate          n/a    14.0%          %     9%      n/a    n/a     8.8%      n/a

 Employment by Industry

                                                 3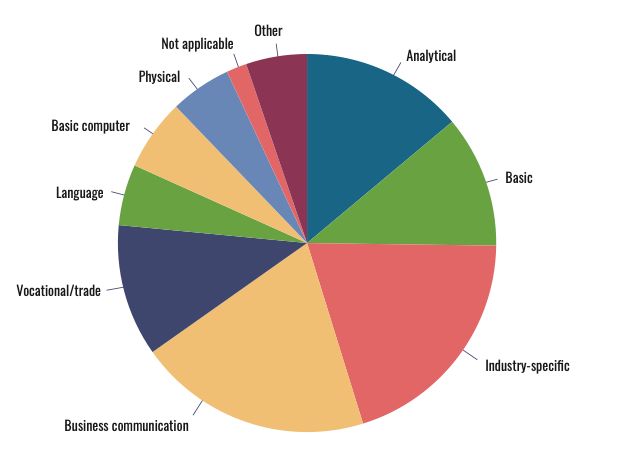
Resig   Table   Trini    Yur     Big    Blue           Rohner
           Category               hini   Bluff   dad      ok    Lagoon   Lake   Hoopa    ville
Management, business,
science, and arts
occupations                          2      14       14    80        0     43     216        3
Service occupations                  3       6       19    82        0      9     388        0
Sales and office occupations         1      13       11    45        0     13     244        1
Natural resources,
construction, and
maintenance occupations              1       1        6    33        0     11     127        4
Production, transportation,
and material moving
occupations                          2       3        9    21        0      1      79        0
Civilian employed
population 16 years and
over                                 9      37       59   261        0      9    1054        8
Agriculture, forestry, fishing
and hunting, and mining              2       0        0    23        0     43     100        3
Construction                         1       1        4     8        0      0      65        0
Manufacturing                        0       0        0     5        0      0      11        0
Wholesale trade                      0       0        0     6        0      2       0        0
Retail trade                         0       2        5     5        0      0     157        0
Transportation and
warehousing, and utilities           0       0        0    11        0      1      25        0
Information                          0       0        2     2        0      4       0        0
Finance and insurance, and
real estate and rental and
leasing                              0       3        4    14        0      0      66        0
Professional, scientific, and
management, and
administrative and waste
management services                  3       4        0    15        0      0      72        0
Educational services, and
health care and social
assistance                           1       1       19    61        0      3     252        0
Arts, entertainment, and
recreation, and
accommodation and food
services                             0       9       18    54        0     11     132        3
Other services, except public
administration                       0       2        1    11        0     16      12        2
Public administration                2      15        6    46        0      1     162        0
Civilian employed
population 16 years and
over                                 9      37       59   261        0      5    1054        8

                                                 4
Private wage and salary
workers 1 16 41 108 0 43 485 5
Government workers 6 16 17 121 0 25 470 0
Self-employed in own not
incorporated business
workers 2 5 1 32 0 17 66 3
Unpaid family workers 0 0 0 0 0 1 33 0
The most current available data shows the median household income is $48,041, with 19.1% of
residents in poverty.5 Total personal income statistics are compiled by the US Department of
Commerce’s Bureau of Economic Analysis, using data from individual and corporate tax
returns. Growing personal income generally indicates a growing economy, as long as the
growth is greater than the annual average inflation rate. The primary components of personal
income in Humboldt County are work earnings, dividends, interest, rent, and medical benefits.
5
QuickFacts, https://www.census.gov/quickfacts/humboldtcountycalifornia. Population estimates, July 1, 2019.
5A significantly larger portion of Humboldt County’s personal income derived from retirement
and disability benefits when compared to the statewide average.6 The following table shows
the per capita personal income in Humboldt County for the last three available years. The
impact of the 2020 pandemic is yet to be seen.
Rank in
Dollars Percent change
State
2017 2018 2019 2019 2018 2019
Humboldt $45,815 $47,400 $49,654 33rd +3.5 +4.8
The unemployment rate in December 2020 was 7.5%, compared to 3.1% a year ago in December
2019. Unemployment hit a year high of 13.8% in April 2020, demonstrating the economic impact
of the COVID-19 pandemic as well as some mild job recovery in the following months, as
shown by the recently lower rate.
Humboldt County 2020 Unemployment Rate
16.0%
13.8%
14.0%
12.0%
12.0%
11.7%
10.6%
10.0%
8.2%
8.0%
7.6% 7.5%
6.5%
6.0%
6.1%
4.1% 5.0%
4.0%
3.9%
2.0%
0.0%
Data Source: EDD, Historical Civilian Labor Force, Humboldt County
Commute Patterns
6
Humboldt County Economic and Demographic Profile 2018, Center for Economic Development, CSU Chico.
https://tinyurl.com/y263om65. Support provided by Rural County Representatives of California.
6Housing and transportation infrastructure play an important role in workforce dynamics.
Affordable rental housing and opportunities for homeownership offer long-term social and
financial benefits, making housing an important economic influencer. The county’s median
home price of $370,000 is rising but is still significantly less than the statewide median price of
$717,930 (Dec 2020 figures).7 Rental costs in the region are also rising but remain much lower
than in more urban areas of California, especially along coastal communities near the major
cities. Municipalities and organizations continue to identify and address barriers to
construction, incentivizing the building of new market rate, low-cost and HUD supported
affordable housing.
Humboldt’s variable topography can make for geographic isolation and resulting
transportation challenges for some workers, though the region’s rural nature also bolsters the
job market by offering highly productive agricultural land with a long growing season and
many micro‐climates, and facilitating the production of commodities like grass-fed beef, wine
grapes, flowers and many other niche products.8
The vast majority – 97.4% - of Humboldt workers work in their county of residence.9 92.3% of
workers in the county commute to work. The 2019 American Community Survey found that
39.3% of workers over the age of 16 who commute traveled 20 minutes or more to work. Only
3.8% traveled 60 minutes or more, with an overall mean commute of 19 minutes.
Educational and Skill Level of the Workforce
Humboldt County residents have reached higher levels of educational attainment than
surrounding counties: 90.8% of the population above 25 has a high school degree or higher
(compared to 82% for the state), while 30.4% have a bachelor’s degree or higher (compared to
35% statewide). The table below is for those ages 25 and older.
Education Level Percentages of Individuals 25 and older, Humboldt County
Less than HS Some college, AA degree BA degree or
HS degree graduate no degree higher
Percent 9.1% 20.7% 28% 11.8% 30.4%
Number 8,531 19,235 26,048 10,992 28,292
SOURCE: 2019 American Community Survey
In 2020, there were an estimated 4,532 individuals over the age of 5 who do not speak English
“very well.”10 Of those individuals, 59.6% (2,701 individuals) speak Spanish and 23.5% (1,065
individuals) speak Asian and Pacific Island languages. The overwhelming majority of the
7 https://www.car.org/en/marketdata/data/countysalesactivity
8
Comprehensive Economic Development Strategy, Humboldt County, CA, 2018 Draft.
https://humboldtgov.org/DocumentCenter/View/64989/CEDS---Part-1---Introductions
9
Table 1: https://www.census.gov/data/tables/2015/demo/metro-micro/commuting-flows-2015.html
10
Census 2020 California Hard-to-County Fact Sheet, Humboldt County. https://census.ca.gov/wp-
content/uploads/sites/4/2019/06/Humboldt-County.pdf
7population in Humboldt, 89%, speaks only English. Although the Census data does not provide
a further breakdown of Asian sub populations, on-the-ground intelligence from workforce
system partners finds that the Hmong population often seeks services. As such, providers have
acted accordingly to provide information and services in that language.
Race and Hispanic Origin
Total population 135,490
Hispanic or Latino of any race 11.1%
Hispanic Exclusive Race:
White Alone 74.9%
Black or African American Alone 1.0%
American Indian or Alaskan Native Alone 4.6%
Asian Alone 2.9%
Native Hawaiian/Other PI Alone 0.3%
Some other Race Alone 0.3%
SOURCE: Census 2020 California Hard-to-County Fact Sheet, Humboldt County
High School Equivalency preparation is offered by the following adult schools in the RPU:
College of the Redwoods, Eureka Adult School, Fortuna Adult Education, Southern Humboldt
Adult Education, and Northern Humboldt Adult School.11 The vast geographical spread of the
region presents a challenge to the provision of adult basic education - while most schools offer
online and independent study programs, students must be able to provide their own
transportation to the school site for registration and testing services.
Knowledge and Skills Gap Analysis
An examination of JobsEQ data provides some insight to the skills gap within the Humboldt
labor force. A skill gap is defined as the difference between the supply and demand for a skill.
In the following table, positive gaps are surpluses of a skill and negative gaps represent a
shortage of a skill. Skill supply (candidates) is collected from resume data; demand (openings)
is collected from job postings. Humboldt employers experience some difficulty finding
individuals with skills and experience in the following areas: medication administration,
typing/word processing, teaching, home health care, report writing, payroll, and inventory
control. On the other hand, job seekers appear to have an over-abundance of the following
types of skills: cash handling, Point of Sale systems, sales, food service, merchandising, serving,
and barista. Microsoft Word/Microsoft Office and Spanish/bilingual appear on opposite sides
of the skills gap, perhaps indicating a mismatch between the way those skills are described in
job postings and in resumes. The below graph reflects data from Quarter 3 of 2020.
11
Source: CA Dept of Ed School Directory
8The 2018 Humboldt County Workforce Development Survey Report details the results of
employer surveys and interviews completed in 2017 and 2018, including those working in
targeted industries.12 At the time, employers were struggling with the challenges of a low
unemployment labor market, clearly a different situation than employers find themselves facing
in early 2021. Nonetheless, the data gathered from employers helps to illustrate some of the
existing skills gaps within Humboldt’s workforce.
Employers reported major difficulty with filling positions that require an advanced degree (51%
of respondents), with the reverse being true for positions requiring a high school degree or less.
Many employers reported that they were using their own resources to develop or provide
training in industry specific skills, customer service, supervision, software and computer
knowledge, and business communication. Employers expressed a desire for education
providers to offer more job readiness and professional certification courses.
Employers were also asked to rank personal traits and success criteria that they sought but that
were lacking in job candidates. 71% of survey respondents ranked “Dependability and
Reliability” as needed but lacking; 57% identified “Initiative and Motivation,” 50% identified
“Interpersonal Ability” and 45% “Ability to Perform in a Team.” Employers reported that they
12
https://humboldtgov.org/DocumentCenter/View/71302/2018-Humboldt-County-Workforce-Development-Survey-
Report
9are not able to train employees to be dependable or to be motivated, although they can possibly
promote those traits through the use of incentives.
The following graph from the report illustrates specific skills that employers were seeking but
appeared to be lacking in their job candidates (based on 42 responses):
Source: Humboldt County 2018 Workforce Development Survey Report
Labor Market Analysis and Forecast
• Provide an analysis of industries and occupations with an emerging demand. (Sec. A)
• Identify the in-demand industry sectors or occupations for the region. (Section B)
The COVID-19 pandemic has deeply affected the workforce and job availability: From March
2020 through the week of February 6, 2021, 48,6775 initial claims for unemployment insurance
and 13,467 claims for Pandemic Unemployment Assistance (PUA) have been filed –
representing a very substantial portion of Humboldt’s labor force. Opportunity Insights
Economic Tracker, a tool that uses big data to provide real-time statistics related to the impact
of COVID-19, found that small business revenue in Humboldt County dropped by 49.6% when
comparing January to December 2020. Furthermore, for the same time period, 46.5% fewer
10small businesses were open.13 An examination of the Small Business Administration’s data of
Paycheck Protection Plan loans made to Humboldt zip codes finds 1,714 businesses received
loans under $150,000 and 267 received loans above $150,000.14 Furthermore, 1,459 disaster loans
had been made to local businesses through partner agencies as of June 23, 2020.
Humboldt businesses continue to struggle with the uncertainty and challenges of the pandemic,
including constantly changing state requirements. Given the uncertainty of the long-term
economic impacts of the COVID-19 pandemic, the following overview of Humboldt County’s
regional economic conditions (including existing and emerging sectors and occupations, labor
market forecasts, and employment needs of employers in the region) may change as the long-
term impacts of the COVID-19 pandemic become clear. The following section provides some
historical context for Humboldt County’s important sectors, projections, and current data on
employment and business numbers.
Employment Forecasts for the Humboldt County Region
In 2018, the region was home to 3,203 employer establishments and 11,275 non-employer
establishments, indicating that small entrepreneurs play a large part in the economy.
The Targets of Opportunity Report 2004-2014 provides an analysis based on the 5 counties of
Humboldt, Del Norte, Siskiyou, Trinity, and Mendocino. The report identified the top eight
fast-growing, high wage-paying industries for the Redwood Coast region for that time period
based on: (1) job growth; (2) wage growth; (3) firm growth; and (4) career potential:
- Tourism
- Diversified Health Care
- Specialty Food, Flowers, and Beverage
- Building and Systems Construction
- Investment Support Services
- Forest Products
- Niche Manufacturing
- Management and Innovation Services
A key component of the Humboldt RPI 4.0 application is a request for resources to update the
Targets of Opportunity report. The following is a brief recap of the results of the 2014 report,
followed by more current data on the top industries.
In 2014, the Targets of Opportunity industry clusters accounted for 66.9 percent of the region’s
total employment and 72.3 percent of the region’s total wages.15 A key element of the regional
economy was identified as new firm creation - many of the region’s largest private sector
employers began as non-employer firms (self-employed firms with no employees). The county
13
http://tracktherecovery.org
14
https://home.treasury.gov/policy-issues/cares-act/assistance-for-small-businesses/sba-paycheck-protection-
program-loan-level-data
15
https://humboldtgov.org/DocumentCenter/View/62405/Targets-of-Opportunity-Final-Report
11continued to experience substantial and continued growth of non-employer firms, with a net
increase of 1,884 new non-employer firms from 2004-2014, representing a growth rate of 20
percent.
In an analysis of the Redwood Coast region, four of the eight targets of opportunity increased the
number of jobs available in their industries, and all of them outperformed the region’s total job
decline of 0.4 percent, based on the compound annual growth rate from 2004 to 2014. Diversified
Health Care, Management and Innovation Services, Niche Manufacturing, and Specialty Food,
Flowers, and Beverage experienced growth rates ranging from 0.1 to 1.6 percent over the 2004-
2014 period.
When adjusted for inflation using the Employment Cost Index, six of the eight clusters
experienced growth in real wages over the 2004-2014 study period. With the exception of
Tourism, all the Target clusters paid an average annual wage higher than the regional average in
2014. Not only did these clusters increase in average annual wages, but the wages expanded faster
than the regional economy. Specifically:
• The cluster with the strongest wage growth was Specialty Food, Flowers, and Beverage,
which reported an average annual wage increase of 19.3 percent.
• The next largest increase was in Diversified Health Care, which increased average annual
wages by 13.6 percent.
• The industry with the highest rate of job growth was Management and Innovation
Services, which is project to grow from 770 jobs to 1,240, expanding by a remarkable 61%.
• The ongoing shrinkage of the historically dominant Forest Products industry means job
growth in that field will continue to slow.
An update of the 2004-2014 report for 2012-2022 (“Part II”) found the ongoing importance of
some of Humboldt’s the targeted industries. The Tourism industry was projected to grow by
the most jobs, with 1,900 new openings by 2022, the largest proportion being in the Food
Preparation and Serving sector, especially for fast food worker, restaurant cook, and waiter jobs.
The Diversified Healthcare industry was projected to grow 1,000 jobs by 2022, with the most
growth in home health aide and personal care aide positions, as well as medical assistant and
secretary positions. The Specialty Food, Flowers, and Beverage industry was projected to grow
by 1,570 jobs by 2022, with the most growth in farmworker, retail, and agricultural managing
jobs (e.g., farmers or ranchers). The Building and Systems Construction industry was projected
to grow by 880 jobs, with the most growth in landscaping/groundskeeping worker and
carpenter positions.
Other industries were also projecting growth, although in smaller numbers. The Investment
Support Services industry was projected to grow by 210 jobs, with the most growth in counter
and rental clerk, teller, and services sales agent positions. The Niche Manufacturing industry
was projected to grow by 140 jobs, with the most growth in installation, maintenance and repair
worker as well as heavy and tractor-trailer truck driver positions. Finally, the Management and
12Innovation Services industry was projected to grow by 470 jobs, with the most openings in
office clerk and installation, maintenance and repair worker positions.
Top 8 Industries in Redwood Coast with Projected Growth by 2022
Job Growth
Industry Sector Jobs in 2012 Jobs in 2022 Job Growth
Rate
Tourism 9,250 11,150 1,900 20.5%
Diversified
12,200 13,200 1,000 8.2%
Healthcare
Specialty Food,
Flowers, and 5,790 7,360 1,570 27.1%
Beverage
Building and
Systems 3,980 4,860 880 22.1%
Construction
Investment
Support 2,830 3,040 210 7.4%
Services
Forest Products 2,050 2,000 -50 -2.4%
Niche
1,080 1,220 140 13%
Manufacturing
Management
and Innovation 770 1,240 470 61%
Services
SOURCE: tabulation based on Targets of Opportunity, Redwood Coast, 2004-14; Part II
EDD’s Labor Market Information Division made projections for the occupations with the fastest
growth from 2016 to 2026 for the North Coast region (including Del Norte, Humboldt,
Mendocino and Lake Counties). Similar to the Targets of Opportunity analysis, tourism and
retail/food trade occupations are projected to remain prominent areas of growth. Government
and Construction industry occupations, especially education, social and other health
occupations, also represent significant sectors of growth. See the table below:
Industry Employment Projections, 2016-26, North Coast Region
Projected Projected
2016 Job 2026 Job Numeric Percent
Industry Estimates Projections Growth Growth
Educational Services (Private), Health 19,870 24,150 4,280 21.5%
Care, and Social Assistance
Leisure and Hospitality 12,180 13,800 1,620 13.3%
Local Government 22,390 23,550 1,160 5.2%
Trade, Transportation, and Utilities 19,620 20,680 1,060 5.4%
Self-Employment 7,330 8,080 750 10.2%
13Construction 3,500 4,150 650 18.6%
Professional and Business Services 5,210 5,810 600 11.5%
Retail Trade 15,290 15,850 560 3.7%
Total Farm 3,630 4,110 480 13.2%
Transportation, Warehousing, and 2,470 2,870 400
Utilities 16.2%
Other Services (excludes 814-Private 3,220 3,550 330
Household Workers) 10.2%
Manufacturing 5,060 5,250 190 3.8%
Financial Activities 3,260 3,420 160 4.9%
State Government 5,800 5,960 160 2.8%
Wholesale Trade 1,860 1,960 100 5.4%
SOURCE: Ten-year projections, Humboldt https://www.labormarketinfo.edd.ca.gov/data/employment-
projections.html
The below table details the mean annual wage by industry for the first quarter of 2020.
Mean Annual Wage by Industry, North Coast Region (1st quarter 2020)
May 2019
Employment Mean Hourly Mean Annual
Industry Title Estimate Wage Wage
Management Occupations 5,610 $42.48 $88,353
Business and Financial Operations 3,620 $29.53 $61,424
Occupations
Life, Physical, and Social Science 1,570 $34.35 $71,440
Occupations
Arts, Design, Entertainment, Sports, and 680 $25.70 $53,463
Media Occupations
Healthcare Practitioners and Technical 5,540 $43.89 $91,297
Occupations
Healthcare Support Occupations 7,230 $15.69 $32,622
Food Preparation and Serving Related 10,650 $14.32 $29,769
Occupations
Sales and Related Occupations 11,910 $17.55 $36,498
Farming, Fishing, and Forestry 2,390 $18.83 $39,166
Occupations
Construction and Extraction 4,030 $27.20 $56,576
Occupations
14Transportation and Material Moving 7,000 $18.22 $37,900
Occupations
Installation, Maintenance, and Repair 4,250 $22.52 $46,839
Occupations
SOURCE: Humboldt County spreadsheet, https://www.labormarketinfo.edd.ca.gov/data/oes-
employment-and-wages.html
EDD calculated North Coast County RPU occupational data based on middle skill analysis,
offering insight on openings in desirable middle skill occupations. Approximately 40% of these
occupations fall under the Diversified Healthcare cluster, and 15% fall under the Building and
Systems Construction cluster. See table below.
Top 20 Middle Skill Occupations by Total Job Openings in the North Coast RPU (2016-2026)
Median Median Industry Category
Total Hourly Annual
Occupational Title Openings Wage Wage
Heavy and Tractor-Trailer 883 $25.24 $52,493 Building and Systems
Truck Drivers Construction
Bookkeeping, Accounting, 868 $20.22 $42,055 Investment Support
and Auditing Clerks Services
Teacher Assistants 545 $30,189 Education
Automotive Service 384 $21.57 $44,869 Automotive Repair and
Technicians and Mechanics Maintenance
Medical Assistants 366 $18.26 $37,995 Diversified Healthcare
Forest and Conservation 274 $18.90 $39,305 Forest Products
Technicians
Nursing Assistants 252 $17.20 $35,775 Diversified Healthcare
Dental Assistants 233 $21.47 $44,641 Diversified Healthcare
Heating, Air Conditioning, 164 $27.51 $57,220 Building and Systems
and Refrigeration Construction
Mechanics and Installers
Telecommunications 107 $25.83 $53,725 Building and Systems
Equipment Installers and Construction
Repairers, Except Line
Installers
Manicurists and Pedicurists 93 $19.11 $39,735 Personal Care Services
Licensed Practical and 73 $25.50 $53,024 Diversified Healthcare
Licensed Vocational Nurses
Phlebotomists 68 $20.71 $43,087 Diversified Healthcare
61 $27.52 $57,227 Architectural,
Civil Engineering Engineering, and Related
Technicians Services
Massage Therapists 58 $35.48 $73,796 Diversified Healthcare
1556 $22.85 $47,523 Computer Systems
Computer User Support Design and Related
Specialists Services
Medical Records and 54 Diversified Healthcare
Health Information
Technicians
Medical and Clinical 52 Diversified Healthcare
Laboratory Technicians
Human Resources 42 $23.76 $49,422 General Merchandise
Assistants, Except Payroll Stores
and Timekeeping
38 $28.31 $58,904 Computer Systems
Computer Network Design and Related
Support Specialists Services
SOURCE: North Coast RPU, https://www.labormarketinfo.edd.ca.gov/geography/regional-planning-
units.html
Moving away from projections to an examination of Duns and Bradstreet data for a five-year
lookback at actual employment numbers by industry, some interesting trends emerge, some of
which can be at least partially explained by the COVID-19 pandemic, some of which have
developed over a longer period of time. The greatest gains in employment numbers from 2016
to present have been in the sectors of healthcare, professional services, eating and drinking
establishments, retail stores, and hotels and accommodations. On the flip side, the sectors with
the greatest decreases in employment numbers for the same time period are administrative and
support services, manufacturing, public administration and educational services, wholesale,
and information-based industries. While the number of manufacturing businesses dropped
slightly over the last five years from 249 to 235, a 5.6% decrease, the employment numbers
dropped significantly more at -19.8%, and in a continuously downward trend. An analysis by
the Center for Economic Development at CSU Chico also found a downward trend in the
number of manufacturing jobs for the period of 2007-2016.16
16
Humboldt County Economic and Demographic Profile 2018, Center for Economic Development, CSU Chico.
https://tinyurl.com/y263om65. Support provided by Rural County Representatives of California.
16Developing a more detailed picture of this trend, understanding the context within regional
projections, and updating projections are among the topics that merit further study, and that the
RPU intends to pursue with its RPI 4.0 resources.
The following tables of Duns and Bradstreet data for 2016-2021 include employment numbers
and business numbers by industry.
Employment
2016 2017 2018 2019 2020 2021
Administrative and
Support Services 2169 2064 1347 1274 1132 1116
Agriculture, Forestry,
Fishing, Hunting 1254 1305 1190 1126 1136 1198
Arts, Entertainment,
Recreation, Fitness 1244 1251 1327 1266 1223 1192
Construction 2585 2558 2608 2671 2663 2590
Eating and Drinking 3282 3534 3845 3733 3474 3472
Pub Admin/Educational
Services 12377 13277 12335 11747 11859 11865
Finance 927 1019 1021 1059 1026 996
Health Care 7628 10154 8967 8688 8350 8313
Hotels and
Accommodations 1066 1207 1157 1201 1137 1165
17Information-Based
Industries 1297 1129 1154 1211 1183 1191
Insurance Carriers and
Related Activities 393 400 478 497 479 477
Legal Services 298 305 312 311 305 304
Manufacturing 3102 2870 2612 2587 2515 2489
Management of Companies 10 14 13 13 6 6
Mining 5 5 5 7 11 11
Professional Services 2223 2249 2706 2624 2595 2489
Real Estate 812 813 865 868 866 855
Rental and Leasing Services 234 239 218 182 176 183
Retail Stores 6066 6035 6588 6517 6467 6215
Services 2479 2544 2605 2578 2628 2546
Transportation 583 661 619 540 483 489
Utilities 343 360 376 400 406 403
Warehousing and Delivery 209 224 221 207 216 216
Waste Management and
Remediation 149 145 156 168 164 164
Wholesale 1717 1795 1981 1888 1619 1377
Data Source: Duns & Bradstreet (www.dnb.com) and Bureau of Labor Statistics Quarterly Census of
Employment and Wages (http://www.bls.gov/cew/data.htm)
Businesses
2016 2017 2018 2019 2020 2021
Administrative and Support
Services 555 521 475 432 388 376
Agriculture, Forestry,
Fishing, Hunting 226 253 257 244 249 267
Arts, Entertainment,
Recreation, Fitness 148 150 161 175 173 175
Construction 716 750 738 745 747 752
Eating and Drinking 286 310 314 318 311 312
Pub Admin/Educational
Services 451 490 456 440 442 445
Finance 125 122 127 124 120 121
Health Care 710 723 772 780 786 778
Hotels and
Accommodations 106 115 119 125 120 123
Information-Based
Industries 91 90 90 94 96 100
18Insurance Carriers and
Related Activities 72 77 78 83 78 77
Legal Services 90 95 100 99 100 98
Manufacturing 249 253 243 240 234 235
Management of Companies 3 5 4 4 2 2
Mining 1 1 1 2 1 1
Professional Services 609 602 573 578 580 584
Real Estate 239 253 268 262 275 264
Rental and Leasing Services 65 64 58 55 55 57
Retail Stores 801 827 856 854 860 851
Services 705 724 736 730 755 753
Transportation 102 124 125 99 104 108
Utilities 24 27 27 31 33 32
Warehousing and Delivery 37 38 37 30 35 35
Waste Management and
Remediation 18 16 17 18 18 18
Wholesale 231 241 253 242 238 233
The following two graphs illustrate the sectors in Humboldt with the greatest employment
gains and losses over 2016-2021.
Industry Sectors in Humboldt County LWIA, CA, Employment Gain, 2016 - 2021
19Industry Sectors in Humboldt County LWIA, CA, Employment Loss, 2016 - 2021
B. Fostering Demand-Driven Skills Attainment
Describe how the RPU and regional partners will expand or develop, and then implement sector
initiatives for those in-demand industry sectors or occupations.
The Humboldt WDB and its partners have supported a number of sector initiatives in the
region’s priority areas, particularly healthcare and construction. The RPU developed healthcare
sector partnerships with Slingshot funds, including a Healthcare Exploration Summer Institute
for high school students, which allowed students to job shadow within local hospitals and gain
hands on and eye-opening experience.
Humboldt built on the success of this sector strategy with RPI 2.0 funds to develop a Dental and
Oral Health Project, to help address the dental provider shortage in the region. These projects
have been guided by local committees comprised of workers in the field; employers; education
partners, and the Chamber of Commerce. RPI 2.0 funded a Regional Healthcare Liaison to lead
the effort and to create an Oral Health Career Exploration Summer Institute, develop a Dental
and Oral Health Training Model in 4 high schools and 1 charter school, promote Dental and
Oral Health careers at high schools and community colleges, identify work- based learning and
apprenticeship opportunities, and promote dual enrollment opportunities for high school
students at College of the Redwoods Dental Health Program.
20Unfortunately, the COVID-19 pandemic caused the postponement of the Oral Health Career
Exploration Summer Institute portion of the initiative, which was converted to an online format
offered in July 2020. Topics covered included soft skills, medical and dental career exploration,
information on healthcare, social work, and COVID-19, HIPAA and Blood Borne Pathogen
Certificate trainings, and guest speakers. Each youth participant received a stipend for
completing the training.
The RPU also worked to develop the Humboldt Regional Trades sector initiative in the high
schools in partnership with the Humboldt County Office of Education, College of Redwoods,
industry partners and the Building Trades Council. The initiative hired a Regional Trades
Program Liaison, created a marketing campaign for the Trades program, and further developed
the Traveling Trades Academy. The Trades Academy and its Mobile lab worked to enhance
student knowledge through high quality hands-on learning, industry field trips, access to
industry professionals and opportunities to earn certifications.
Participants can earn a variety of certifications which make them more likely to find
employment: MC3, OSHA 10, Traffic Control, First Aid and CPR, Confined Space, Blueprint
Reading, Labor History, Hazardous Waste Initial and Fundamentals of Construction. Industry
partners have been at the center of these efforts, providing participants with on-the-job
experience as well as visiting classrooms. Employers have given feedback that they favorably
view candidates who come out of CTE programs. The initiative has been instrumental in
progress toward developing a regional building trades training program. Although the
COVID-19 pandemic has added a layer of uncertainty to the timeline and specifics of the future
of the RPU’s sector initiative, the Humboldt WDB remains committed to supporting the
industries important to the region’s economy and will work with industry partners to chart
future efforts.
C. ENABLING UPWARD MOBILITY FOR ALL CALIFORNIANS
Describe how the RPU will prioritize working with employers who provide quality jobs that
provide economic security through family-sustaining wages and comprehensive benefits. This
should include whether the RPU has, or plans to develop, a formal policy related to job
quality.
Humboldt has prioritized working with employers who provide quality jobs primarily through
its sector strategies. Through the vigorous use of data to bring to light the sectors with the most
employment potential, Humboldt has been able to focus its resources on sectors and
occupations that pay family-sustaining wages and have career growth potential. Humboldt’s
workforce system, including staff, board members, and partner organizations, have been
holding discussions regarding a jobs quality statement or policy. Conversations are ongoing at
HC-WDB meetings. After updating the Targets of Opportunity, the Humboldt WDB will work
21with stakeholders to determine if a jobs quality policy would help to advance the work of the
system.
Describe how the RPU and regional partners will work together to identify shared target
populations and develop targeted service strategies.
In addition to the core partners, the North Coast region is reliant on a robust and critical system
of community-based organizations (CBOs) to reach and work with groups that have some of the
most significant barriers to employment. CBOs participate in program development, outreach,
and specialized supportive services, in coordination with one-stop partner groups across the
region. By working with these community-embedded organizations and ensuring appropriate
referral and co-enrollment, the workforce system is better able to assist individuals with
accessing regional sector pathways and connecting them with needed supportive services and
resources to ensure that they will remain in relevant programs as they work their way through
career pathways. Recent efforts around a shared target population have been focused on justice
involved individuals, using the resources from the state’s Prison2Employment initiative.
Partners include College of the Redwoods Adult Education, College of the Redwoods
Workforce and Community Education, DHHS-Employment Training Division and the Westside
Community Improvement Association, which houses the Jefferson Center. Through these
partnerships, participants have received EPA Lead Abatement Certification; holistic counseling;
financial literacy training; and mindfulness training for staff and participants.
The most common partnerships with CBO’s focus on additional wrap-around supports for
vulnerable populations in order to enhance their accessibility to the workforce system and
ensure their inclusion in the workforce. CBO partners are an integral part of the pipeline to
direct clients into regional sector pathways, either by directly providing training for in-demand
occupations themselves, exposing youth clients to careers in demand sectors, or providing
wrap-around services to reduce barriers to employment. Please see Humboldt’s local plan for
further detail on the roles of partner organizations.
Describe how the RPU and regional partners will work with employers and training providers
to ensure that historically unserved and underserved communities have equal access to the
regional sector pathways, earn and learn opportunities, supportive services, and other
approaches identified by the RPU. This should include whether the RPU has, or plans to
develop, a formal policy related to equity.
The HC-WDB is actively promoting equity and equal access to workforce system services. As
detailed in the local plan, diversity and inclusion trainings as well as strategies for serving
specific communities has been an ongoing topic for professional development. HC-WDB has
been working with a consultant who has provided county-wide diversity trainings which have
garnered positive feedback. The consultant is also working with the County’s Office of
Economic Development (within which the WDB is housed) staff to conduct team building.
Furthermore, the consultant is working on an effort to research best practices among Humboldt
22employers in the area of workforce equity – results of this research will be shared out
community-wide. The HC-WDB is in the process of developing an equity statement to capture
the WDB’s commitment to ensuring equal opportunity for historically underserved
communities.
One example of Humboldt’s commitment to underserved communities is its Opioid National
Dislocated Worker Grant (NWDG), which won a gold category award in the category of
“Economic Equity and Inclusion” of the International Economic Development Council (IEDC).
According to the California Department of Public Health, there were 28 opioid overdose deaths
in Humboldt County in 2017, which placed Humboldt as the county with the second-highest
opioid overdose death rate in the state. The HC-WDB applied for a grant with the Employment
Development Department in 2018, the National Health Emergency Phase Two: Disaster
Recovery National Dislocated Worker Grant for Opioids (Humboldt Opioid NDWG). The grant
provides two projects: Temporary Jobs, and Workforce Development Training and Temporary
Jobs. All participants complete a 9-hour Ethics training. Upon completion, 10 participants
gained employment in temporary jobs related to substance abuse treatment and prevention. An
additional 25 participants enrolled in a Certified Alcohol Drug Counselor I (CADC-I) training
program that runs 8-10 weeks for 30-40 hours each week and obtained temporary jobs. This
project provides five worksites with subsidized staff. By connecting people in recovery and the
unemployed with professions that target substance abuse, this project helps address the
economic effects of the opioid crisis and improves the overall quality of lives.
D. Aligning, Coordinating, and Integrating Programs and Services
• Describe any regional service strategies, including use of cooperative service delivery
agreements or MOU.
• Describe any regional administrative cost arrangements, including the pooling of funds
for administrative costs for the region.
As Humboldt is a one-county RPU, service delivery strategies are described in the local plan.
Regional administrative cost sharing arrangements are not applicable in this situation.
23Appendix A
Stakeholder and Community Engagement Summary
The development of comprehensive Local and Regional Plans entails building broad and inclusive partnerships
with regional and local entities in a variety of sectors. This includes engaging with employers, labor
organizations, and community-based organizations, as well as WIOA core, required, and strategic program
partners. This will ensure the inclusion of person- centered approaches to addressing multifaceted barriers to
employment by utilizing input from the communities themselves.
Stakeholders participating in the planning processes should include, but are not limited to, employers, labor
organizations, education partners, human services and housing partners, as well as community-based
organizations that provide services to target populations such as: justice-involved, English language learners,
refugees, immigrants, youth, older adults, veterans, people with disabilities, and any other entities supporting
historically unserved or underserved communities.
Using the template below, Regional Planning Units and Local Workforce Development Boards should provide
a detailed description of how meaningful stakeholder involvement and community engagement was achieved
when developing the Regional and Local Plans. This summary should be included as an attachment to both the
Regional and Local Plans.
Summary of
Mode of Target of Comments
Attendance
Outreach Outreach
Email distribution lists; All partners and See minutes. 11/6/2020
Public notice interested parties AJCC Partner meeting.
Email distribution lists; WDB members; partners; See minutes. 11/13/2020 Comment that small
Public notice interested parties full WDB meeting. businesses have been very
impacted by the pandemic
and system needs to assist
them.
Email distribution lists; WDB members; partners; See minutes. 2/26/2021
Public notice interested parties full WDB meeting.
Email distribution lists; GOHumCo website;
Public notice 3/26-4/26/2021
24Appendix B
Public Comments Received March 24 - April 26, 2021
Comment(s) Response(s)
Please include American Indian Thank you. American Indian
Demographic Data. Demographic Data has been added.
Please see pages 2-5.
25Appendix C
Program Administration and Plan Signatures
This regional four-year plan represents the North Coast Regional Planning Unit efforts
to maximize and coordinate resources available under Title I of the Workforce
Innovation and Opportunity Act.
This regional four-year plan is submitted for the period of July 1, 2021 through June 30,
2025 in accordance with the provisions of the Workforce Innovation and Opportunity
Act.
Humboldt County Workforce
Development Board Chair Chief Elected Official
Signature Signature
Dena McCullough Michelle Bushnell
Name Name
4/28/21
Date Date
26You can also read