Northeast and Mid-Atlantic Residential Lighting Strategy: 2015 Update - December 2015
←
→
Page content transcription
If your browser does not render page correctly, please read the page content below

Northeast and Mid-Atlantic Residential
       Lighting Strategy: 2015 Update
                              December 2015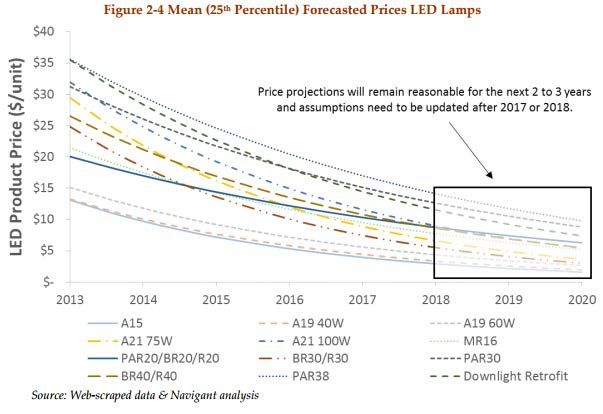
Table of Contents
Acknowledgements ....................................................................................................................................................4
About NEEP.................................................................................................................................................................5
Executive Summary ....................................................................................................................................................6
Introduction ................................................................................................................................................................8
Technology and Market Characterization ..................................................................................................................9
   Technological Trends and Movements Analysis ....................................................................................................9
   Market Status in the Northeast ........................................................................................................................... 11
   Federal and State Standards, Policies, and Voluntary Programs ........................................................................ 12
   Regional Program Administrator Activity ............................................................................................................ 14
   Regional Evaluation and Research ...................................................................................................................... 16
   Potential for Energy Savings ................................................................................................................................ 17
   Key Market Barriers ............................................................................................................................................. 21
   Market Opportunities to Leverage ...................................................................................................................... 26
Regional Strategy to Achieve Market Transformation ............................................................................................ 30
   Long-term Market Transformation Goal ............................................................................................................. 30
   Theory of Change ................................................................................................................................................ 30
   Tracking Market Transformation Progress .......................................................................................................... 31
Strategy Implementation Plan and Recommendations .......................................................................................... 33
   Program Administrator Strategies....................................................................................................................... 33
   Regional Strategies beyond Programs................................................................................................................. 34
Conclusion ............................................................................................................................................................... 35
Appendix A: Smart Lighting Product Details............................................................................................................ 36
Appendix B: List of Residential Lighting Details in Program Plans .......................................................................... 38

Table of Tables
Table 1: Description of Current Trends and Key Factors for Residential Lighting Technologies and Applications ....9
Table 2: Planned 2015 Program Promotion of Retail Residential Lighting Program, By State ............................... 15
Table 3: Planned 2015 Retail Residential Lighting Percentages of CFL, LED, and Specialty Bulbs .......................... 15
Table 4: Gross Annual Potential State Savings for General Service Lamps (in GWh).............................................. 19
Table 5: Delta Watt Values in 2015 TRMs by State for Retail Residential Lighting Programs ................................ 24

Northeast Residential Lighting Strategy: 2015 Update | 2

Table 6: Delta Watt Table, both Gross and Net for Standard CFLs and LEDs .......................................................... 25
Table 7: Ranking of Lighting Technologies by Various Measures/Features ............................................................ 27
Table 8: Comparison of Residential Lighting Market Tracking Metrics................................................................... 32

Table of Figures
Figure 1: NEMA Shipping Data Lamp Indices, A-Line .............................................................................................. 11
Figure 2: Market Snapshot from The State of our Sockets ...................................................................................... 12
Figure 3: Regional Potential Program Savings from General Service Lighting, All LEDs in Program Scenario ........ 18
Figure 4: Regional Potential Program Savings, General Service Lighting, 50% of LEDs Attributed to Programs .... 18
Figure 5: Approximated Potential Regional Program Savings from Specialty LED Support (GWh) ........................ 20
Figure 6: Residential Lighting Socket Saturation with or without Program Intervention ....................................... 21
Figure 7: Forecasted LED Lamp Prices from Navigant ............................................................................................. 22
Figure 8: Price Comparison of Different Technologies and Lamp Types from Navigant......................................... 23
Figure 9: Information on Linear Fixture Technology Market Share, for both Residential and Commercial ........... 28
Figure 10: Residential Lighting Theory of Change for Market Interventions to Transform the Market ................. 31

Northeast Residential Lighting Strategy: 2015 Update | 3
Acknowledgements
The Northeast Residential Lighting Strategy was published to address the role of high efficiency lighting products
in capturing all cost-effective energy efficiency in the region while also providing broad energy, economic, and
environmental benefits. This document provides regional and national updates to the original document
finalized in March 2012, the 2012-2013 Update finalized in December 2012, the 2013-2014 Update finalized in
October 2013, and the 2014-2015 Update finalized in December, 2014. This report reflects the invaluable
contributions of multiple individuals. Claire Miziolek, NEEP’s Market Strategies Program Manager, served as the
report’s project manager and lead author. NMR, led by Chris Russell, contributed the Market Adoption Model
analysis.
This report reflects the opinion and judgments of the NEEP Staff developed in consultation with the Leadership
Advisory Committee (LAC) and does not necessary reflect those of NEEP Board members, NEEP Sponsors, or
projects participants and funders. NEEP would like to recognize and thank the LAC members for their
participation in the update of the Residential Lighting Strategy. The industry experts listed below provide
important input into the creation of this document.
         Apex Analytics                                    Scott Dimetrosky
         Cadmus in support of EPA/ENERGY STAR              Sean Nyhan
         Cape Light Compact                                Briana Kane
         CLEAResult                                        Stan Mertz and Chris Narowski
         Cree                                              Stephen Ritson and Jon Vollers
         District of Columbia Sustainable Energy Utility   Stacy Glatting and Michael Russom
         Efficiency Vermont                                Lara Bonn, Emily Clark, Lauren Morlino, and Jenna Pugliese
         Energy Futures Group                              Glenn Reed
         EPA/ENERGY STAR                                   Dan Cronin and Taylor Jantz-Sell
         Eversource CT                                     Jesus Pernia
         Eversource MA                                     Kristen Pomer
         Eversource NH                                     Katherine Peters
         GE                                                Lisa McLeer
         Globe Electric                                    Gillian Saidman
         The Home Depot                                    Mike Cook
         ICF International in support of EPA/ENERGY STAR   Marianne Graham
         Liberty Utilities                                 Margaret Curran
         Lockheed Martin                                   Michele Guerin and Dan Krasowsky
         Lowes                                             Laura Kiernan and Mark Beck
         Lutron                                            Pekka Hakkarainen and Ranga Sapthasayee
         National Grid                                     Laurie Acone and Angela Li
         New York State Research & Development Authority   Ryan Moore
         NMR Group                                         Lynn Hoefgen and Lisa Wilson-Wright
         Osram Sylvania                                    Christopher Lubeck
         Philips Lighting                                  Rene Burger
         PSEG-Long Island                                  Dimple Gandhi and Linda Schwantner
         TechniArt                                         Adam Tardif
         The United Illuminating Company                   Maritza Estremera and Marissa Westbrook

Northeast Residential Lighting Strategy: 2015 Update | 4
The following NEEP staff provided feedback, input, and edits: David Lis, Director of Market Strategies; Samantha
Bresler, Market Strategies Associate; Patrick Wallace, EM&V Forum Manager, and John Otterbein, Marketing
Communications Associate.

About NEEP
NEEP was founded in 1996 as a non-profit whose mission is to serve the Northeast and Mid-Atlantic to
accelerate energy efficiency as an essential part of demand-side solutions that enable a sustainable regional
energy system. Our vision is that the region will fully embrace next generation energy efficiency as a core
strategy to meet energy needs in a carbon-constrained world.
Disclaimer: NEEP verified the data used for this white paper to the best of our ability. This paper reflects the
opinion and judgments of the NEEP staff and does not necessarily reflect those of NEEP Board members, NEEP
Sponsors, or project participants and funders.

Northeast Residential Lighting Strategy: 2015 Update | 5

Executive Summary
It has been a long journey working to transform the residential lighting market. NEEP’s 2015 Update to the
Northeast and Mid-Atlantic Residential Lighting Strategy presents the progress to-date in a market
transformation framework and charts a path forward to complete transformation of this market. Using the
August 2015 resource The State of our Sockets as a launching off point, this update summarizes key research and
progress, trends and advances, and includes new analysis of the remaining savings opportunity for this market.

Efficient residential lighting, one of the longest standing efficiency program measures, saw several ground-
shifting market developments since last year’s analysis. Most notably, the introduction of lower-lifetime LEDs
disrupted the market with their significantly lower price points and rocked the residential lighting world in the
second half of 2015. Smart lighting products also are coming to market with exciting features and creating new
market opportunities. Furthermore, the discussion of market trends has been clarified to speak not only to
different technologies, but also to different applications and lamp-types, as not all trends apply to all products.

An update on the state of the market in the Northeast showed gaining socket saturation for LEDs and halogen
products. Another layer of influence affecting the market is that of federal standards, EPA’s ENERGY STAR
program, and California Energy Commission state standards; 2015 was a significant year for activities from all of
those agencies. Program Administrators also had a banner year, with a heightened number of programs
promoting LEDs and over 13 million efficient lighting products promoted in the region in 2015. Along with the
success of programs comes new evaluations and a deeper understanding of the impact program administrators
are having on the market.

Looking forward, there are significant quantities of remaining savings in the residential lighting market. Through
a Market Adoption Model analysis, we found that in aggregate, with a regional gross annual savings potential in
the 2-3 TWh range, the regional savings from a transformed residential lighting market would have the
equivalent annual impact of nearly 600 wind turbines installed or taking over half of a coal-fired power plant
offline.

Achieving that significant level of regional savings means overcoming market barriers to accelerated adoption of
efficient residential lighting. Presented in this update are the barriers that emerged as the greatest challenge for
regional stakeholders as well as insight and analysis on each of the following barriers.

    •    Consumer confusion in selection of lighting products
    •    High comparative price of efficient alternatives
    •    Negative consumer perception about high efficiency lighting
    •    Efficiency program barriers, including misunderstandings across program lighting assumptions,
         inaccurate delta watt savings assumptions, and regulatory pushback based on limited understanding of
         EISA legislation
There are also several market opportunities to leverage at this time to transform the market, including:

    •    LEDs are exciting and desired
    •    Smart lighting

Northeast Residential Lighting Strategy: 2015 Update | 6
• ENERGY STAR Luminaire’s Specification: new bulb in a box savings opportunity
• Linear Fluorescent: Potential opportunities for improved efficiency
• National efforts moving forward
By working through these barriers and leveraging these opportunities, the region can achieve market
transformation. The regional goal NEEP is putting forward is to reach a socket saturation of 80-90 percent
efficient quality lighting by 2022. Over the course of the next 5 years, that could add up to over 15 TWh of total
savings for the region in the timeframe. Socket saturation was selected as the metric by which to chart progress
because it continues to be regularly measured with reliable evaluations and ultimately reflects the final impact
on home energy consumption.
Using theory of change methodology, we built a timeline for
Regional Goal: market transformation on which a series of market
“Reach a socket saturation of 80-90% interventions can be represented. These are designed to
efficient quality lighting by 2022. Over either overcome existing market barriers or leverage emerging
market opportunities to accelerate the adoption of efficient
the course of the next 7 years, that
residential lighting and effectively transform the long term
could add up to over 15TWh of total
market in the Northeast and Mid-Atlantic. Market
savings for the region.”
transformation, as established in our goal, is achievable by
following the eight recommended strategies:
1. Continued PA support for energy efficient residential lighting
2. PAs transition portfolios in short term towards LEDs and in longer term towards specialty
3. PAs target LEDs in hard-to-reach markets
4. PAs consider including smart lighting in portfolios
5. PAs explore opportunities in residential linear products
6. Regional collaboration on residential lighting research
7. Regional coordination on data collection and sharing
8. Regional discussions on savings calculation inputs to ensure appropriate attribution
NEEP continues to see cost-effective savings from residential lighting products. The residential lighting market is
far from transformed, and there is a lot of work to do to ensure customers are selecting the most efficient
lighting products over their inefficient counterparts. NEEP’s role in the regional market transformation of
efficient residential lighting will be to chart progress towards the goal as well as to report on market
developments as they come.
Northeast Residential Lighting Strategy: 2015 Update | 7Introduction
Welcome to the 2015 Update to the Northeast Residential Lighting Strategy. Take your seats and help us to
chart a path to achieve transformation of the residential lighting market from antiquated, inefficient technology
to one where efficient lighting dominates. This Update accompanies several previously published reports,
starting with the original Residential Lighting Strategy released in 2012. With this third update to that original
report, we are making some changes to the format and how information is presented to clearly demonstrate
how the market is transforming.
In 2015, we saw many changes to the efficient lighting market. The price point for LEDs dropped significantly,
new products such as smart LEDs and lower-lifetime LEDs started to enter the market, and regulators in the
Northeast started to push back on program plans to aggressively promote efficient residential lighting as some
perceived the market to be “transformed” after decades of promotion. To help address the latter issue, NEEP
authored a paper called The State of our Sockets: a Regional Analysis of the Residential Lighting Market 1. This
analysis focused on the impact of the Energy Independence and Securities Act (EISA) and what regulators and
program administrators should expect from residential lighting in the short and long term. A few of our major
findings are as follows:
• Inefficient lighting still fills the majority of sockets in the Northeast.
• Using the best available data, we found that EISA 2020 applies to less than half of the sockets in a home,
and is not in place until 2020. Though important, it will not be the panacea for residential lighting
market transformation.
• As efforts continue in this space, there is a strong need
for better and more consistent data to track progress to
“EISA 2020 applies to less than half of
allow policy makers and program administrators to
the sockets in a home, and is not in
make more informed decisions.
place until 2020. Though important, it
• Efficiency programs have an important role to help
transform this market in both the short and long term,
will not be the panacea for residential
especially for products not impacted by the EISA lighting market transformation.”
legislation.
Given this evidence that the market has not been transformed, the 2015 RLS Update sets out to chart where we
are along the residential lighting market transformation curve and provide actionable strategies to continue on
our way to transformation. The RLS identifies remaining barriers to be overcome and new opportunities to
exploit in order to achieve full market transformation. We developed tools, recommendations, and strategies,
and honed our goal for what a transformed market would look like in residential lighting. We also determined
the metrics to be tracked and the savings opportunity to be gained through a transformed market.
The information provided in this strategy, along with the previous iterations, can continue to provide value to
the residential lighting market and stimulate collaborative relationships to accelerate the transformation of the
residential lighting market in the Northeast and Mid-Atlantic.
1
The State of our Sockets, NEEP, August 2015. http://www.neep.org/state-of-our-sockets
Northeast Residential Lighting Strategy: 2015 Update | 8Technology and Market Characterization
Technological Trends and Movements Analysis
While the residential lighting market has long been characterized, by NEEP and many others, with this update it
seemed necessary to review the available lighting technologies as well as provide some basic updates on
standards and test procedures. Table 1 shows the available lighting technologies and residential lighting
applications. Represented by arrows in this analysis is the trending information regarding that product’s market
penetration as either growing (up arrow), staying stable (side arrow), or shrinking (down arrow). Excluded from
this analysis is linear fluorescent lighting which makes up about 10% 2 of the market and will be addressed in the
Market Opportunities to Leverage section. As retail is the primary channel for residential lighting sales, most of
the trends described apply to retail sales.
3
Table 1: Description of Current Trends and Key Factors for Residential Lighting Technologies and Applications
Technology/ Omnidirectional/General Service (approx. 60% of Directional (approx. Decorative (approx. 16% of
Application sockets) 13% of sockets) sockets)
4
Incandescent Inefficient Inefficient Inefficient
Regulated by EISA (impacted in Phase 1: 2012- Regulated by DOE. Not regulated
2014) Not very widespread
Relatively common and low-
as halogen is
Still have significant socket penetration, but cost option
preferred alternative
mostly off of store shelves except for those
exempted by EISA
Halogen Inefficient Inefficient Inefficient
Regulated by EISA (impacted in Phase 2: 2020) Meet regulations Not very widespread as
incandescents are not
Gaining market share and socket penetration. Widespread
regulated and remain the
Lowest cost option for customers
common alternative
Compact Efficient Efficient Efficient
Fluorescent
Regulated by EISA (likely not impacted until Phase Technology is not a Technology is not a great fit
Lamps (CFL)
3: 2025), currently covered by ENERGY STAR. New great fit for directional for most decorative
DOE Test Procedure underway applications. Many applications. Many
programs moving programs moving away
Northeast socket saturation around 30%, but
away from support as from support as LED
gains beyond that have been very challenging
LED provides a better provides a better alternative
Common bulb. Relatively low price point. alternative
Shrinking but still prominent role in efficiency
program portfolios until 2017/2018
2
The State of our Sockets, NEEP, August 2015. http://www.neep.org/state-of-our-sockets
3
Images from Natural Resources Defense Council, http://www.nrdc.org/energy/lightbulbs/files/lightbulbguide.pdf
4
As defined in The State of our Sockets and consistent with EISA, “inefficient” refers to products that are 45lpw or less, with “efficient”
referring to products that higher than 45lpw.
Northeast Residential Lighting Strategy: 2015 Update | 9Light Emitting Efficient Efficient Efficient
Diodes (LEDs)
Regulated by EISA Phase 2/3 but most products Technology well Technology well suited for
are unlikely to be impacted. Can be covered by suited for this this application
ENERGY STAR. New DOE Test Procedure application
New products are coming to
underway.
Price points are market with dropping price
Gaining in market share, Northeast socket dropping, but still points, but still relatively
saturation between 1-10% relatively low market low market penetration
penetration
Bulb is gaining in popularity in retail channels. Included in efficiency
2015 saw introduction of several low-cost non- Included in efficiency programs and may be for
ENERGY STAR LEDs that have disrupted the programs and may be the longer term
market. for the longer term
As Table 1 demonstrates, this market is very dynamic. Even between technologies and applications, there are
fissures in the market. For example, the penetration of LEDs in retail channels varies significantly between lamp
types, with directional having the greatest penetration of LEDs at 18%, and decorative bulbs with lower rates of
penetration, at 3% 5. Another example that took hold in 2015 was the lower-lifetime omnidirectional LED (also
referred to as the “value,” “basic,” or “ish” bulbs). This trend gained momentum through the spring and into the
summer of 2015, spurred by the release of Philip’s 60W equivalent LED rated for 10,000 hours in May at a
previously unforeseen price point of 2 bulbs for $4.97 6. Within a few months, many more familiar LED
manufacturers joined this trend by releasing LEDs in the $2.50-$3.50 range without an incentive. 7 Although each
of these products is slightly different, they are all aligned in that none of them met ENERGY STAR’s Lamps V1.1
requirement for a 25,000 hour rated life. Many of these products have lifetime claims of 10,000 or 15,000 hours.
Beyond missing the ENERGY STAR criterial for rated life, some also do not meet the omnidirectional or power
factor thresholds. While not a requirement of ENERGY STAR, none of the lower-lifetime LEDs are dimmable.
With ENERGY STAR’s December release of the Draft Final Specification for the updated Lamps 2.0 8, however,
ENERGY STAR is taking a step to adapt the specification that would allow lower-lifetime omnidirectional
products to earn certification. This growing trend has been a disrupter in 2015 in the residential lighting
market 9, but ENERGY STAR’s steps, discussed further in the Federal and State Standards, Policies, and Voluntary
Programs section, will go a long way to ensure that most LEDs on the market are ENERGY STAR certified, are
high quality, and remain eligible for efficiency program rebates.
Another trend, which will be explored more in the Market Opportunities to Leverage section, is the growth of
smart and/or connected lighting. This is an exciting advancement, not only for the residential lighting market,
but more broadly as these lights intersect with Home Energy Management Systems and mobile devices.
Between these trends, it is becoming clear that there are at least three classes of LED products that may be
available from the same manufacturer such as: smart products equipped with aps and advanced features sitting
5
From Nov 17 presentation at DOE Market Development workshop,
http://energy.gov/sites/prod/files/2015/11/f27/carmichael_ledadoption_portland2015_r.pdf
6
http://www.wired.com/2015/04/philips-cheap-led-bulbs/
7
http://switchboard.nrdc.org/blogs/nhorowitz/the_led_lighting_revolution_is_1.html
8
https://www.energystar.gov/sites/default/files/ENERGY%20STAR%20Lamps%20V2%200%20Draft%20Final%2012-04-2015.pdf
9
http://www.icfi.com/insights/white-papers/2015/crossroads-of-residential-dsm-lighting-programs
Northeast Residential Lighting Strategy: 2015 Update | 10at the highest price point, fully-equipped ENERGY STAR LEDs with great dimming (with potential color tuning
features) for a modest price point, and now a class of basic functionality LEDs at lower price points. The latter
class of low-cost, basic-functionality LEDS have emerged as a competitor to CFLs and halogen products. With
ENERGY STAR’s Draft Final Specification for Lamps 2.0, it is hoped that manufacturers will see this as an
opportunity to continue engaging with ENERGY STAR, offering omnidirectional LEDs with basic functionality at
low price points with quality assurance such that these products could be eligible for efficiency program rebates.
Ensuring high quality for all LED lamps is critical for long-term consumer acceptance for the technology.
However, depending on the application and the customer, if products within each class are meeting the quality
standards set forth in ENERGY STAR, they each have a valuable role in the market.
10
Figure 1: NEMA Shipping Data Lamp Indices, A-Line
Charting the development of these three classes of LEDs will be a new challenge. Sources such as the National
Electrical Manufacturers Association (NEMA’s) lamp indices which show quarterly shipping data of NEMA
member manufacturers group by technology type. As such, while the LED category continues to grow as seen in
Figure 1 with data through the first quarter of 2015, the rate of growth for smart LEDs, or lower-lifetime LEDs is
not differentiated.
Market Status in the Northeast
As reported in The State of our Sockets, the Northeast has long been active in promoting efficient lighting. As
such, the market for CFLs and LEDs is quite mature. In Figure 2, we show a snapshot from The State of our
10
http://www.nema.org/news/Pages/First-Quarter-Proves-to-be-a-Mixed-Bag-for-Consumer-Lamp-Indexes.aspx
Northeast Residential Lighting Strategy: 2015 Update | 11Sockets of the residential lighting markets from years 2011-2014 for shipping, sales 11, and socket saturation 12. Each market data source—shipping, sales, and socket saturation—has insights and shortcomings, but many trends can be seen in all three. Most notably, inefficient technologies (halogen and incandescent) are still the dominating technology. In some cases CFLs are growing and in other cases staying stagnant. In all three perspectives, however, LED and halogen are technologies on the rise. While these perspectives are primarily focused on General Service Lighting, many of these trends are observed through all residential lighting applications. As conveyed in The State of our Sockets, this snapshot shows that the residential lighting market has not been transformed. Figure 2: Market Snapshot from The State of our Sockets Federal and State Standards, Policies, and Voluntary Programs There are several activities underway on the Federal and State level. Six critical efforts to be aware of that had movement in 2015 are as follows: EISA 2020 As NEEP reported in The State of our Sockets, the Energy Independence and Securities Act (EISA) 2020 rulemaking is still underway. In late 2014, DOE released a Preliminary Technical Support Document (PTSD) for the General Service Lighting Standard 13 enacted by EISA in 2007. This PTSD proposed several efficacy levels for 11 Disclaimer regarding the Regional Limited Sales Data: The information contained herein is based in part on data reported by IRI through its Advantage service for, and as interpreted solely by LightTracker Inc. Any opinions expressed herein reflect the judgment of LightTracker Inc. and are subject to change. IRI disclaims liability of any kind arising from the use of this information 12 The State of our Sockets, NEEP, August 2015. http://www.neep.org/state-of-our-sockets 13 https://www1.eere.energy.gov/buildings/appliance_standards/rulemaking.aspx?ruleid=83 Northeast Residential Lighting Strategy: 2015 Update | 12
general service lighting products, all of which would be such that currently only LEDs and CFLs would qualify. The
Notice of Proposed Rulemaking (NOPR), the last stage in the process, is expected in December of 2015. At this
time, a congressional budget rider restricting DOE from enforcing EISA is still in place; whether that will be
removed before the standard goes into effect in 2020 is unknown. NEEP, through our Appliance Standards
initiative, continues to monitor and provide comments when appropriate to this rulemaking.
DOE LED Test Procedure
In June, 2015, DOE released a Supplemental Notice of Proposed Rulemaking (SNOPR) on a Test Procedure for
LED Lamps 14. This test procedure is important as it will set consistent testing parameters for LEDs as they
continue to enter the market. The proposed tests would include lifetime, stress testing, color maintenance,
standby mode power, power factor, lumen output, CCT, and CRI. DOE is expected to release the final rule before
the end of 2015.
DOE CFL Test Procedure
Hot on the heels of the LED Test Procedure, DOE released a NOPR 15 for a CFL Test procedure in July, 2015. Since
a test procedure for CFLs has been in place, this NOPR proposed to expand the scope and include updates to
better align with current products and updates to the ENERGY STAR specification. The test procedure covers
many of the same parameters as the LED proposed Test Procedure, though the testing methodologies are
largely different based on technological differences. DOE is expected to release the final rule before the end of
2015.
The California Energy Commission’s LED State Standards
California has been working to establish a state standard for General Services LED Lamps and Small Diameter
Directional Lamps. 16 In October, the California Energy Commission (CEC) released a staff report analysis of the
efficiency opportunities, and proposed several metrics for the state standard, to take effect in 2017. These
included a minimum 10,000 hour lifetime, efficacy minimums tied to the CRI of the product, as well as other
metrics. The proposed standard will limit the LEDs allowed to be sold within California significantly and may
have impacts on LEDs produced for the rest of the country.
ENERGY STAR Luminaires Specification Update
Version 2.0 of the ENERGY STAR Luminaires Specification 17 was finalized in May 2015 and will be effective in
June of 2016. This updated specification included efficacy increases across the board. Another significant change
was allowing ENERGY STAR Certified Luminaires to ship with an ENERGY STAR Certified Lamp which would not
have to be integrated or pin-based as discussed further within the Market Opportunities to Leverage section.
This shift is based off the logic that ENERGY STAR Lamps have consumer appreciation enough that a consumer
can be expected to keep the lamp the product was shipped with and not replace it with an inefficient
alternative. The Luminaires specification also included opportunities for connected luminaires to gain

14
   http://www.regulations.gov/#!docketDetail;D=EERE-2011-BT-TP-0071
15
   http://www.regulations.gov/#!documentDetail;D=EERE-2015-BT-TP-0014-0001
16
   http://www.energy.ca.gov/appliances/2015-AAER-06/rulemaking/
17
   https://www.energystar.gov/products/spec/luminaires_specification_version_2_0_pd

Northeast Residential Lighting Strategy: 2015 Update | 13
recognition even if they use a small amount of energy in standby power. This opens up the opportunities for
luminaires to better integrate with other smart home technologies and home energy management systems.
ENERGY STAR Lamp Specification Update
In February, 2015, ENERGY STAR released the first draft of the Lamp Specification Version 2.0 18. Since then, this
specification has gone through several iterations as the needs of stakeholders and the state of the market have
changed considerably in 2015. In November, ENERGY STAR released a proposed revisions document 19 in lieu of a
draft 4 specification. EPA scheduled several stakeholder calls to have targeted discussions on issues of efficacy,
power factor, omnidirectionality, and LED lifetime. The need for such continued discussion largely came out of
the lower-lifetime LEDs and their disruption of the omnidirectional LED market. In December, ENERGY STAR
released the Final Draft Specification for Lamps 2.0, which had significant changes from the original draft. One
significant change was lowering the lifetime requirement for omnidirectional LEDs to 15,000 hours (from 25,000
hours), which greatly opens up the pool of products that might seek ENERGY STAR certification, while still
offering a consumer a lightbulb that will last them over a decade 20. The specification also significantly increased
the efficacy requirements for all lamps from the 1.1 specification; an analysis of the current qualified products
list 21 found no CFLs in any category qualifying to the new specification, which is proposed to go into effect in
January, 2017. This will have a significant impact on program promotions, in 2017 and beyond, however
ENERGY STAR will host an archived list of CFLs that had qualified to the 1.1 specification which programs could
potentially use to reference for continued promotion of CFLs. The changes to the specification include allowing
connected products to qualify, as well as slight adjustments in omnidirectionality requirements; these were
made “to allow greater product design flexibility for cost reductions” 22. EPA ran an experiment to assess the
consumer experience of omnidirectionality and found no
discernable different between the propose Draft Final
Specification omnidirectionality requirements and the                    “lowering the lifetime requirements…
version 1.1 requirements 23. The specification is expected to          opens up the pool of products that might
be finalized and allow products to start certifying to it in early      seek ENERGY STAR certification, while
January, 2016, though given testing requirements, it is not            still offering a consumer a lightbulb that
expected that lower-lifetime LEDs would quality to the                        will last them over a decade”
ENERGY STAR Specification until mid-2016 at the earliest.

Regional Program Administrator Activity
Efficiency programs across the region have a long history of being very active in promoting efficient lighting.
Program administrators (PAs) have successfully worked through federal and voluntary standards to promote
ENERGY STAR certified Lamps and Luminaires while accounting for the impact of EISA in their savings baselines.
This year in particular has been dynamic for efficient lighting programs. We have seen several programs move

18
   https://www.energystar.gov/products/spec/lamps_specification_version_2_0_pd
19
   https://www.energystar.gov/sites/default/files/ESLamps2%200InterimProposal_0.pdf
20
   15,000 hours of lamp lifetime equates to 13.7 years based on 3 hours of use per day
21                                                                       th
   Qualified product list downloaded from energystar.gov on December 4 , 2015
22
   https://www.energystar.gov/sites/default/files/ENERGY%20STAR%20Lamps%20V2%200%20Draft%20Final%2012-04-2015.pdf
23
   Report available at http://www.energystar.gov/sites/default/files/EPA%20LED%20Light%20Distribution%20Study_Final.pdf

Northeast Residential Lighting Strategy: 2015 Update | 14
away from support of specialty CFLs over the course of the year (including New Hampshire, Connecticut, the
District of Columbia, and Vermont), as well as all programs making a move towards greater adoption of LEDs. On
another front, the largest state in our region, New York, undertook a significant change through their Reforming
the Energy Vision (REV) proceeding. One immediate impact of the REV was that NYSERDA stopped offering
incentives on residential lighting products altogether. Throughout the rest of the region however, we have seen
significant uptake in program activity and decreases in incentives as the cost of LEDs continues to go down. In
Table 2, you can see a state-by-state comparison of the 2015 planned program promotion for retail residential
lighting programs (note Massachusetts’s numbers represent a year to date sales through October).
Table 2: Planned 2015 Program Promotion of Retail Residential Lighting Program, By State

                              #          # Specialty            #        # Specialty
                                                                                                         #              Bulbs/
        State             Standard          CFLs/           Standard        LEDs/           Total
                                                                                                     Households        Household
                            CFLs          Fixtures            LEDs        Fixtures
         CT              1,179,199         225,383           780,987       631,359       2,816,928    1,392,677            2.0
         DC               221,000           15,000           100,000       20,000         356,000      257,220             1.4
MA (Year to Date)        2,164,920         279,460          1,297,772     1,081,302      4,823,454    1,998,335           2.4 24
         NH               123,537             0              152,144       26,241         301,922       707,856            0.4
     NY (PSEG LI)        1,000,000         450,000           470,340       548,730       2,469,070      999,172            2.5
          RI              705,802          241,970           225,000       128,500       1,301,272      425,083            3.1
          VT              405,300          101,132           287,000       185,350        978,782       309,019            3.2

In addition to their 2015 plans, besides NYSERDA, all NEEP sponsor programs expect to continue robust
promotion of residential lighting in 2016. In fact, in 2015, both Massachusetts and Connecticut filed three year
plans for 2016-2018 that included strong support for residential lighting, especially pushing programs to
transition from CFL to LED in the next three years. More details on the filed plans for residential lighting can be
found in Appendix B: List of Residential Lighting Details in Program Plans.
Table 3: Planned 2015 Retail Residential Lighting Percentages of CFL, LED, and Specialty Bulbs

                                                                                          Percentage Specialty (Both LED and
        State              Percentage CFL (all)             Percentage LED (all)
                                                                                                    CFL Specialty)
      CT                            50%                            50%                                   30%
      DC                            66%                            34%                                   10%
MA (Year to Date)                   51%                            49%                                   28%
      NH                            41%                            59%                                   9%
     NY (LI)                        59%                            41%                                   40%
       RI                           73%                            27%                                   28%
      VT                            52%                            48%                                   29%

24
  The numbers presented here for Massachusetts are year to date through October, 2015. For comparison, a rate of 2.4 bulbs/household
from January-October would extrapolate out to 2.9 bulbs/household by the end of 2015.

Northeast Residential Lighting Strategy: 2015 Update | 15
As a further point of comparison, Table 3 shows the level of planned promotion of CFLs, LEDs, and all specialty
products. Most programs are getting closer to a one-third to one-half level of LED promotion. The percentage of
specialty products promoted, including fixtures, varies considerably between states. Moving forward, the
specialty product promotion will be a larger focus for remaining savings.
Regional Evaluation and Research
In 2015, many research and evaluation reports were published focused on residential lighting in the Northeast.
By focusing analysis on some of the lingering questions pertaining to residential lighting, program administrators
through the region have a better understanding of their impact on the residential lighting market.
• Lighting Market Assessment and Saturation Stagnation Overall Report 25: This Massachusetts report
summarizes results from three studies (2014 Market Assessment Study, 2015 Market Assessment Study,
and 2014 Saturation Stagnation Study) which explored market reactions to interventions within the MA
Residential Lighting Program. The interventions were providing incentives for participating in the
program, and program support for general service Light Emitting Diode (LEDs) bulbs and expanding
program activity in retail channels and with specific "hard-to-reach" (HTR) consumers.
• Multistage Lighting Net-to-Gross Assessment: Overall Report 26: The purpose of this Massachusetts
report is to describe approaches that estimated net-to-gross (NTG) or net-of-free ridership and to
explain the consensus building process undertaken to develop and finalize the NTG estimates, both
retrospectively for 2014, and prospectively for 2016-2018.
• Massachusetts Upstream Lighting Program Net‐to‐Gross Ratio Estimates Using Supplier Self‐Report
Methodology 27: This report presents the Residential Evaluation Team’s estimates of net‐to‐gross (NTG)
ratios for CFL and LED bulbs sold through the Massachusetts ENERGY STAR upstream lighting program in
2013 using the supplier self‐report methodology.
• Efficient Bulb Saturation Comparison of Massachusetts, California, and New York 28: This report
compares estimates for efficient lighting saturation with an eye on the circumstances and strategies that
may have been most effective in boosting California's saturation while Massachusetts and New York saw
a plateau.
• Supplier and Retailer Perspectives on the Massachusetts Residential Lighting Market Final Report 29: This
report summarizes findings from retailer and supplier interviews conducted in 2014 to support the
comprehensive assessment and monitoring of recent trends, new opportunities, and lingering barriers in
the Massachusetts residential lighting market and the Massachusetts ENERGY STAR Lighting Program.
25
http://ma-eeac.org/wordpress/wp-content/uploads/Lighting-Market-Assessment-and-Saturation-Stagnation-Overall-Report.pdf
26
http://ma-eeac.org/wordpress/wp-content/uploads/Multistage-Lighting-Net-to-Gross-Assessment-Overall-Report.pdf
27
http://ma-eeac.org/wordpress/wp-content/uploads/Upstream-Lighting-Net-to-Gross-Estimates-Using-Supplier-Self-Report-
Methodology.pdf
28
http://www.neep.org/sites/default/files/resources/Efficient-Bulb-Saturation-Comparison-of-Massachusetts-California-and-New-York-
Final-Report1.pdf
29
http://ma-eeac.org/wordpress/wp-content/uploads/Supplier-Retailer-Perspectives-on-Residential-Lighting-Market-Summary-of-Year-
2014-Interviews-Final-Report-.pdf
Northeast Residential Lighting Strategy: 2015 Update | 16• Results of the Massachusetts On-site Lighting Inventory 2014 30: This report includes the results of on‐
site lighting socket inventories performed from May through August of 2014 conducted to understand
the market for energy‐efficient light bulbs in Massachusetts.
• Final Draft Report of Massachusetts LED Market Effects: Baseline Characterization 31: This study aimed to
provide a market baseline for LED saturation, market share, availability, price, awareness, and customer
attitudes in Massachusetts to inform future studies about the state of the LED market.
• Massachusetts Point of Sale Modeling 32: This report summarizes the findings of the Massachusetts
Point‐of‐Sale (POS) modeling research to inform the Saturation Stagnation investigation and the
Multistage Lighting Net‐to‐Gross (NTG) research.
• Residential Lighting Interactive Effects Memo 33: This Connecticut study reports the effects of upgrading
to more efficient lighting on heating and cooling system usage. The results of the study showed a
significant impact to heating system interaction with efficient lighting.
In addition to the completed studies, there are several important residential lighting studies and pieces of
research that are near-completion.
• Currently in draft form, the Connecticut LED Lighting Study Report (R154) is expected to be released in
late 2015. While not yet final, the draft released in November showed significant increases in LED socket
saturation. Another part of this analysis was to look at the different products within a home and break
out which products are decorative, directional, linear, impacted by EISA, or EISA Exempt. This will be a
great next step to the analysis presented in The State of our Sockets which was put together based
largely on shelf stocking surveys.
• A forthcoming Vermont Single Family Housing Baseline Study will include lighting measures to better
understand how lighting is used in Vermont homes.
• Another forthcoming report is the Vermont Smart Lighting/Home Energy Management Systems
Interaction study, report expected late 2015. This study looked at the interaction between smart
lighting, HEMS, and smart plugs in 15 Vermont homes in 2015.
• Forthcoming from Massachusetts is an LED Incremental Cost analysis, which should help explore and
clarify recent developments in the costs of LEDs.
• Finally, a forthcoming White Paper from CLEAResult focuses on the lower-lifetime LEDs is expected by
the end of 2015. This white paper is expected to be an important contribution to the understanding of
the impact these products are having on the efficient lighting market.
Potential for Energy Savings
Understanding the savings opportunity for residential lighting is critical when justifying continued investment in
this product category. Since residential lighting offers a prominent amount of savings for efficiency programs,
we analyzed the amount of remaining potential savings available to all states in the Northeast and Mid-Atlantic
region as programs continue to re-shape the residential lighting market. For general service lighting, which
30
http://ma-eeac.org/wordpress/wp-content/uploads/On-Site-Lighting-Inventory-Final-Results.pdf
31
http://ma-eeac.org/wordpress/wp-content/uploads/LED-Market-Effects-Baseline-Characterization-Final-Draft.pdf
32
http://ma-eeac.org/wordpress/wp-content/uploads/Residential-Point-of-Sale-Modeling-Final-Report.pdf
33
http://www.energizect.com/sites/default/files/Residential Lighting Interactive Effects %28R67%29 Final Report%2C 12-20-14.pdf
Northeast Residential Lighting Strategy: 2015 Update | 17reflects just a portion of the market, we ran a Market Adoption Model analysis given various market conditions
and found the following ranges of gross annual savings as seen in Figure 3 and Figure 4. The first scenario was
anticipating a ramp down in CFL support between now and 2018 with robust LED support until 2020. The second
scenario took into account the lower-lifetime LEDs entering the market and assumed 50% of all LEDs sold in the
market would not be ENERGY STAR and therefore programs would not be able to claim savings for their sale. We
included all states in the region 34 to show the entire potential that a transformed residential lighting market
could have.
Figure 3: Regional Potential Program Savings from General Service Lighting, All LEDs in Program Scenario (in GWh)
2000
Potential Regional Savings (GWh)
1750
1500
1250
1000 CFL
LED
750
Total
500
250
0
2015 2016 2017 Time 2018 2019 2020
Figure 4: Regional Potential Program Savings for General Service Lighting, 50% of LEDs Attributed to Programs Scenario (in GWh)
2000
CFL
Potential Regional Savings (GWh)
1750
LED
1500 Total
1250
1000
750
500
250
0
2015 2016 2017 Time 2018 2019 2020
34
Including: DC, MD, DE, NJ, NY, PA, RI, CT, MA, VT, NH, and ME.
Northeast Residential Lighting Strategy: 2015 Update | 18Between the two scenarios presented, there is a significant decrease in potential savings if many LEDs purchased
in the market are not included in programs. With the Draft Final version of ENERGY STAR’s Lamps 2.0
Specification lowering omnidirectional lifetime requirements, it is expected that many of the LEDs currently in
the market that do not meet ENERGY STAR will earn certification with minimal engineering changes in 2016.
Manufacturers would be motivated by program incentives to earn the ENERGY STAR certification, and
customers will reap the benefits of more quality
assurance in their lighting choices. Even so, the full
impact of lower-lifetime LEDs on the market and “higher program promotion caused baselines to
programs is yet to be appreciated. rise such that each additional bulb results in
We also ran these analyses looking at two different fewer kWh savings. While this is consistent with
rates of program activity to represent the range of how most programs are currently evaluated, it
programs within the Northeast and Mid-Atlantic. suggests the opportunity for new EM&V
What we found noteworthy was that the programs methodology that could recognize and reward
with the lower (though still significant) activity levels programs for their market transformation
had larger opportunities for savings, as the higher
impacts, rather than penalizing future savings
program promotion caused baselines to rise such
based on successful promotion today”
that each additional bulb results in fewer kWh
savings. While this is consistent with how most
programs are currently evaluated, it suggests the
opportunity for new EM&V methodology that could recognize and reward programs for their market
transformation impacts, rather than penalizing future savings based on successful promotion today. Using the
same modeling tool, we ran an analysis for specific states, listed in Table 4, assuming the majority of LEDs in the
market went through efficiency programs and assuming an annual rate of purchase of 2.7 total
lightbulbs/person. We ran this scenario for the medium level of program activity and adjusted for each state’s
population. It is clear that significant savings remain available in residential lighting.
Table 4: Gross Annual Potential State Savings for General Service Lamps (in GWh)
2016 Potential Savings 2017 Potential Savings 2018 Potential Savings
State
(in GWh) (in GWh) (in GWh)
CT 108 95 64
DC 20 17 12
MA 203 178 120
NH 40 35 24
NY (ALL) 595 521 351
Long Island (only) 30 26 18
RI 32 28 19
VT 19 17 11
Most publically available data on residential lighting reports one of two things; the relative share of the different
technologies (but not differentiating between decorative, directional, etc.), or details on the general service
lamp category. For decorative and directional lighting products, which have long be referred to as “specialty”
products by efficiency programs, reliable market share data is not publically available. It is therefore very
Northeast Residential Lighting Strategy: 2015 Update | 19challenging to accurately project the savings potential for these product categories without an accurate baseline
of what is currently installed into decorative and directional sockets in homes. That being said, in The State of
our Sockets analysis, we found that about 16% of sockets were decorative and about 13% of sockets were
directional. A recent MA evaluation 35 provided some evidence to support this, showing that in 2014, 65% of
specialty bulbs were either incandescent or halogen showing a large amount of remaining savings available in
this category. Determining an accurate saving differential between efficient and inefficient is very complex as
both the decorative and directional product categories have a large diversity of product types and wattages for
different applications; however, within the market, is it likely that an LED directional lamp is replacing a halogen
alternative, whereas an LED decorative lamp is likely replacing an incandescent. To determine potential savings
from specialty LEDs, we selected the same starting socket saturation and LED delta watt baselines for decorative
and directional as we had for general service lighting; this is quite conservative considering CFLs are widespread
in the general service lighting baseline but not as common in directional and decorative. We also continued this
analysis beyond 2020, as specialty products are not impacted by the 2020 EISA legislation. Given these
assumptions, we would expect to see savings approximately as shown in Figure 5.
Figure 5: Approximated Potential Regional Program Savings from Specialty LED Support (GWh)
Specialty LED
1250
1000
Potential Savings GWh
750
500
Specialty LED
250
0
2015 2016 2017 2018 2019 2020 2021 2022
Time
In aggregate, with a regional gross annual savings potential in the 2-3 TWh range, the regional savings from a
transformed residential lighting market would have the equivalent annual impact of nearly 600 wind turbines
installed or taking over half of a coal-fired power plant offline 36. In Figure 6, we see that without program
intervention, the residential efficient lighting market would grow, but at a much slower pace than with program
intervention. While Figure 3 through 5 demonstrate the potential savings for efficiency programs, translating
that to socket saturation with or without program intervention provides a different perspective. Especially as
35
From table 59 of “Results of the Massachusetts On-Site Lighting Inventory 2014 FINAL”, published March 2015, http://ma-
eeac.org/wordpress/wp-content/uploads/On-Site-Lighting-Inventory-Final-Results.pdf
36
http://www2.epa.gov/energy/greenhouse-gas-equivalencies-calculator
Northeast Residential Lighting Strategy: 2015 Update | 20the first price of LEDs is still significantly higher than halogens (even for the new lower-lifetime LEDs), program
intervention is necessary to accelerate market transformation.
Figure 6: Residential Lighting Socket Saturation with or without Program Intervention
100
90
Socket Saturation of Efficient Lighting
80
70
60
50
40
Business as Usual
30
Market Intervention
20
10
0
2015 2016 2017 2018 2019 2020 2021 2022
Time
Key Market Barriers
While a great amount of activity has taken place in the residential lighting market, there are still some remaining
barriers that obstruct the regional from accelerating adoption of efficient residential Lighting transforming this
market. We are going to focus on the barriers that emerged as the greatest challenge for regional stakeholders
and provide some insight and analysis for each one.
Consumer Confusion in Selection of Lighting products
While education and awareness has been the cornerstone of all residential lighting efficiency programs,
consumers continue to see lighting as a low-investment, commodity product. In a recent exercise as part of the
2015 Northeast Residential Lighting Workshop, participants reported that consumer education and awareness
was the largest barrier to market transformation (tied with price, described below). As we break down the
residential lighting market further, we find several lingering points of confusion:
• Not all sockets within a home can even take the same lightbulbs; while most general service lamps are
medium screw based, several decorative products use candelabra screw bases, and then some products
are pin based, such as linear fluorescent, MR-16, or any fixtures with a GU-Base.
• Lighting products include complex details from CCT to CRI to providing the lumen output to including the
equivalent wattage as well as the actual wattage.
• Will this new lightbulb be compatible with the current dimmer? Can it be used in an enclosed fixture? In
most cases, LEDs are not fully compatible with legacy dimmers designed for incandescent lamps, though
many ENERGY STAR certified LEDs are dimmable and work with specified dimmers. Furthermore, finding
Northeast Residential Lighting Strategy: 2015 Update | 21the small print to determine enclosed fixture compatibility can be a significant challenge for the average
consumer.
• Even for those who want to think things through, labeling information such as “2700K” and “9W=60W”
are counter intuitive (“Why are these products getting so hot? How can 9 be equal to 60?”).
Education and clear marketing can help overcome consumer confusion points to some extent, but the market is
still very complex. In addition to the dozens of lamp shapes and four possible technologies, even for consumers
who want to be efficient, it can be hard to select the correct product.
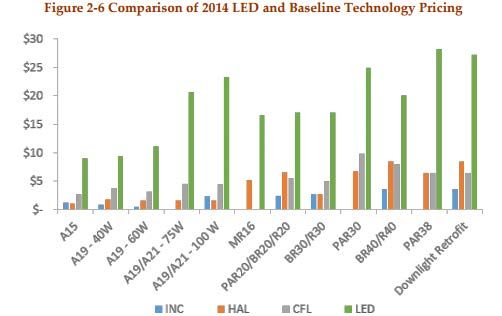
High Comparative Price of Efficient Alternatives
While prices for all LEDs have gone down, they have not done so evenly. Several products, most notably the
decorative and directional, are still very expensive for consumers. While the standard LED price has gone down
dramatically, especially for 60W and 40W equivalent, it is still significantly more expensive than the halogen
alternative. CFL prices have stayed level for several years and are close to halogen, however without an
incentive, the CFL is still typically a more expensive product than the halogen. As detailed in Navigant’s recent
analysis of the LED Lighting Trends in California 37, prices for all LEDs have decreased. However, as much
attention has been paid to the general service lighting products, the reduction in prices has not been even
across product categories. As show in Figure 7 from the Navigant report, the slopes for the A-bulbs are general
the steepest, with flatter curves being seen for the directional products researched.
Figure 7: Forecasted LED Lamp Prices from Navigant
37
http://www.calmac.org/publications/LED_Study_Report_FINAL_201510029.pdf
Northeast Residential Lighting Strategy: 2015 Update | 22You can also read