NTRACK - Property Efficiency Report - Western Cape Government

Page created by Chester Stewart
 
CONTINUE READING
NTRACK - Property Efficiency Report - Western Cape Government
NTRACK

Property                              Updates on
                    Bicycle project                             Blue Dot
Efficiency Report                     infrastructure projects

Transport and Public Works newsletter | ISSUE #25 APRIL 2021
                                                     ON TRACK              1
NTRACK - Property Efficiency Report - Western Cape Government
Contents                                                         IN THIS ISSUE                                      Foreword from the
                                                                                                                        Head of Department
                                                                3      Message from the Head of
                                                                       Department                                                 The Department of Transport             Masiphumelele, and Retreat.
                                                                                                                                  and Public Works is committed
                                                                4      Roads infrastructure update                                                                        In April, and in every other month
                                                                                                                                  to continue to share progress
                                                                                                                                  made in the maintenance of roads        of the year, traffic and road
                                                                6      Health infrastructure update
                                                                                                                                  and infrastructure projects in the      safety officers of the Department
                                                                8      Property Efficiency Report                                 Western Cape during the National        of Transport and Public Works
                                                                                                                                  State of Disaster.                      will be hard at work making our
                                                                12     Bicycle project                                                                                    roads safer. But road safety is
                                                                                                                                  Infrastructure development is           everyone’s responsibility. Whether
                                                                13     Blue Dot Taxi project                                      critical for transforming the           we use the road as drivers,
                                                                                                                                  provincial economy and for              passengers, cyclists, motorcyclists
                                                                14     Join the Conradie Game                                     stimulating economic growth and         or pedestrians, every one of us
                                                                       changers                                                   creating jobs. In this edition, we      should take personal responsibility
                                                                                                                                  feature the good work being done        for our behaviour as road users.
                                                           4                                                                      by our Provincial Public Works          Let us all strive to #BeTheChange
                                                                                                                                  branch to provide top-quality           we want to see on Western Cape
                                                                                                                                  health, education and general           roads.
                                                                                                                                  infrastructure to residents of the
                                                                                                                                  Western Cape.                           By doing their important work, all
                                                                                                                                                                          our staff help to enable citizens
                                                                                                                                  After regulations under the             to lead dignified lives. As a
                                                                                                                                  Disaster Management Act to              Department, we are continually
                                                                                                                                  contain the spread of COVID-19          striving to improve what we do.
                                                                                                                                  came into effect in March               I know that we are moving in the
                                                                                                                                  2020, many of DTPW’s built-             right direction and are actually
                                                                                                                                  environment activities had to be        achieving something which others
                                                                                                                                  delayed. However, many have             appreciate and acknowledge.
                                  6                        12                                                                     come back on stream under
                                                                                                                                  Alert Level 1. Construction,            Jacqui Gooch,
                                                                                                                                  refurbishment and repair works          Head of Department
                                                                VISION:                                                           continue on roads, schools,
                                                                Enabled communities leading dignified lives.                      clinics, hospitals and general
                                                                #JUSTdignity.                                                     infrastructure. Of course, we have
                                                                                                                                  all had to adapt the way we work
                                                                MISSION:                                                          so that the wearing of masks,
                                                                To tirelessly pursue the delivery of infrastructure               social distancing, washing and
                                                                and transport services that is: inclusive, safe and               sanitising of hands have become
                                                                technologically relevant, seeking to heal, skill, in-             a part of life. This will be the case
                                                                tegrate, connect, link and empower every citizen                  for the foreseeable future.
                                                                in the Western Cape, driven by passion, ethics                    In partnership with the Bicycle
                                                                and a steadfast commitment to the environment                     Consortium (Qhubeka, Pedal
                                                                and people as our cornerstone.                                    Power Association and Ben Bikes),
                                                                                                                                  the Department launched the
                                                                EDITORIAL TEAM:                                                   first round of bicycle distribution
                                                                Head of Communication: Jandré Bakker                              in November 2020. This is a
                                                           13   Design: Sylvanus du Plessis and                                   flagship project of the Provincial
                                                                Hantie Engelbrecht                                                Sustainable Transport Programme.
                                                                Contributors: Thabiso Mazosiwe, Stephen                           The goal was to distribute up to
    CONTACT THE ON TRACK TEAM:                                  Heyns, Marion De Vries, Daniel J Nugent,                          400 bicycles to community-based
    Telephone: 086 021 2414                                     Faizel Williams, Charlton Botha, Simon Blyth,                     organisations (CBOs) in the six
    Email: Transport.Publicworks@westerncape.gov.za             Louwrens Mostert, Karl-Robert Gloeck and                          Western and Southern hotspot
    Website: www.westerncape.gov.za | Twitter: @WCGovTPW        Wimbayi Kadzere.                                                  areas: Atlantis, Dunoon, Langa,
    Please send us your feedback and suggestions.                                                                                 Grassy Park and surroundings,

2   ON TRACK                                                                                                                                                                                     ON TRACK       3
NTRACK - Property Efficiency Report - Western Cape Government
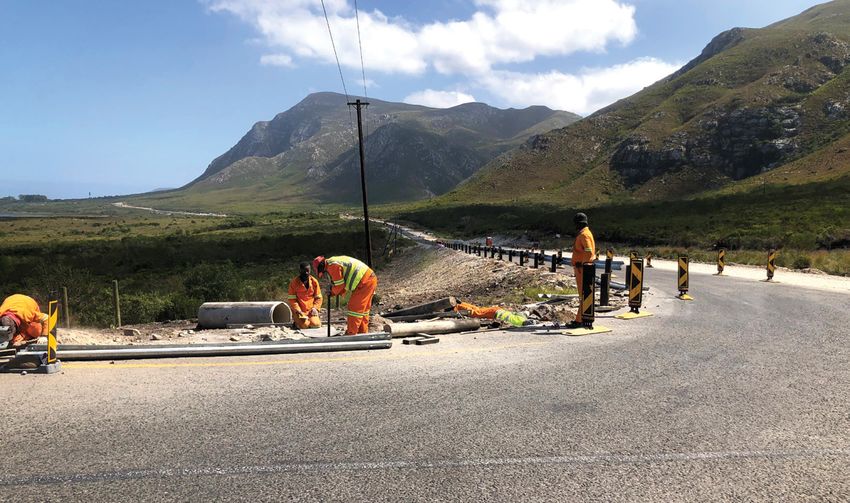
in each direction. There will be two
                                                                                                                                                                                                                closures for 3 km in each direction,
                                                                                                                                                                                                                with a gap of 3 km between closures.
                                                                                                                                                                                                                At least one lane in each direction will
                                                                                                                                                                                                                remain open at all times. To ensure
                                                                                                                                                                                                                the safety of the travelling public and
                                                                                                                                                                                                                the construction workers, the speed
                                                                                                                                                                                                                limit will be reduced to 60 km/h. The
                                                                                                                                                                                                                closures will be clearly signposted
                                                                                                                                                                                                                and pre-warning signs will also be
                                                                                                                                                                                                                erected.

                                                                                                                                                                                                                Wellington to Windmeul and

    Improvements to our
                                                                                                                                                                                                                Bainskloof Pass roadworks
                                                                                                                                                                                                                The contract for repairing and
                                                                                                                                                                                                                resurfacing Bainskloof Pass was
                                                                                                                                                                                                                awarded to Base-Line Civils Pty.

    road network
                                                                                                                                                                                                                Ltd in September 2020. The work is
                                                                                                                                                                                                                expected to be complete in January
                                                                                                                                                                                                                2022. The project includes repairing
                                                                                                                                                                                                                areas where the road has failed,
                                                                                                                                                                                                                and the provision of a new asphalt
                                                                                                                                                                                                                surfacing. Work will also include
                                                                                                                                                                                                                the general improvement of the
    The Department builds, repairs                                                                                                                                                                              drainage in the pass. The project
    and upgrades provincial and                                                                                                                                                                                 will also address the stabilisation of
    national roads in the Western                                                                                                                                                                               unstable slopes in the pass as well
    Cape to meet its vision of enabled                                                                                                                                                                          as the upgrading of certain existing
    communities leading dignified lives                                                                                                                                                                         rest areas.
    #JUSTdignity. Well-maintained roads
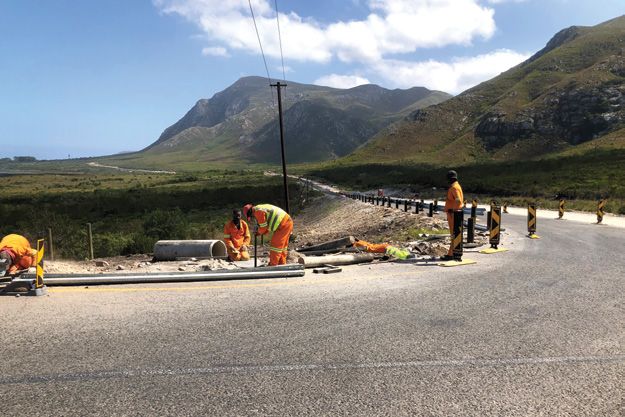
    are important social goods that                                                                                                                                                                             Upgrading the road between
    support the economic growth of the                                                                                                                                                                          Stanford and Hermanus
    Western Cape by enabling the rapid                                                                                                                                                                          The TR28/2 trunk road which
    movement of people and goods. They                                                                                                                                                                          provides a direct 43 km link between
    also provide access to opportunities                                                                                                                                                                        the towns of Hermanus and Stanford
    for residents. The Department                                                                                                                                                                               is being upgraded, including work
    understands that roadworks are                                                                                                                                                                              on the Klein River Bridge. Although
    frustrating for motorists, but the                                                                                                                                                                          there were delays due to Alert Level
    result will be a better and safer road                                                                                                                                                                      5 restrictions under the National
    for the benefit of all residents of the                                                                                                                                                                     State of Disaster, the project is still
    province.                                                                                                                                                                                                   expected to be complete in October
                                              announced in March 2021 that 41%        on all our ongoing projects from       involves removing existing asphalt       West and Stellenbosch commenced           2021.
    Our work on roads is focused on           (R3.7 billion) of the budget for the    periodic maintenance on the N1,        surfacing, undertaking repairs,          on 31 August 2020. The completion
    preserving surfaced roads, gravel         2021/22 financial year had been         to upgrading roads in the Cape         patching and sealing cracks where        date is expected to be March              Resealing the road between Hermon
    roads, and bridges. Spending              allocated to building, upgrading and    Winelands, West Coast and Overberg,    this is necessary, and resurfacing the   2021. Structural works include the        and Malmesbury
    priorities are determined by, among       maintaining our provincial roads. The   and rehabilitation and repairs on      pavement with an ultra-thin friction     maintenance of the Steynsrust             The R46 is a provincial route in South
    other things, road condition, date        Provincial Minister also emphasised     Bainskloof Pass.                       course (UTFC) top layer. The contract    Bridge over MR27, concrete lining         Africa that connects Malmesbury
    of last refurbishment, the nature         that 7 500 job opportunities would                                             with Triamic Construction (a division    of an Armco culvert near Corboda,         with Touws River, via Riebeek-Kasteel,
    and volume of traffic, safety             be created through road and other       Construction works on 11 km of the     of Haw & Inglis) and consulting          and maintenance to the crib wall near     Tulbagh and Ceres. This road also
    considerations, the number of             infrastructure projects.                N1 begin                               engineers SMEC South Africa also         Somerset West.                            links with the R44 between Gouda
    people a road serves, the economic                                                Work on the R71 million Department     includes work on some of the ramps                                                 and Hermon. Resealing the road
    importance of a road, and the             The R22 million De Beers Avenue         of Transport and Public Works          and service road intersections along     R33 between Vredenburg and                between Hermon and Malmesbury
    availability of alternative routes. For   bridge over the N2 at Somerset          periodic maintenance project to        the route.                               Saldanha to be resealed                   started in March 2021, and this
    the citizen, this means better access     West was completed and officially       repair and resurface the N1 between                                             The R33 between Vredenburg and            project is expected to be complete
    to work opportunities, economic           opened in February 2021. Despite        the Black River bridge interchange     Easing high traffic volumes between      Saldanha is due to be resealed            in June 2021.
    opportunities, and social amenities.      the challenge of the COVID-19           and the Plattekloof Road interchange   Stellenbosch and Somerset West           soon. The work is expected to be
                                              pandemic and associated safety          commenced on 20 January 2021, with     A R61 million periodic maintenance       completed at the end of June 2021.
    The Western Cape Minister of              restrictions, our team has persevered   the expected completion date being     project on the high-volume, dual         To enable resealing to take place, lane
    Transport and Public Works                and made tremendous progress            the end of July 2021. The project      carriageway R44 between Somerset         closures of one lane will be required

4   ON TRACK                                                                                                                                                                                                                               ON TRACK        5
NTRACK - Property Efficiency Report - Western Cape Government
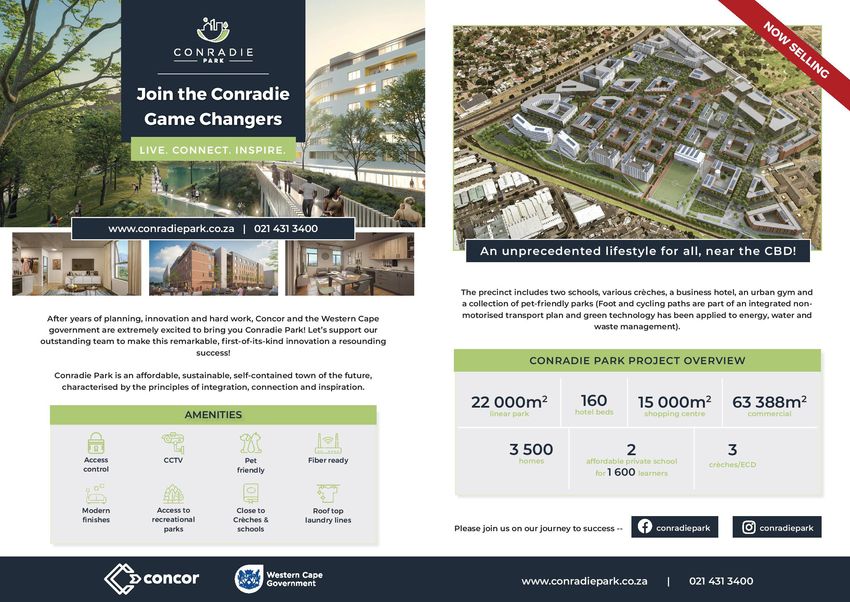
Helderberg Hospital                                                                                                       New satellite clinic at Abbotsdale
                                                                                                                              A new satellite clinic has been
                                                                                                                              built in the growing community
                                                                                                                                                                    booth) accessed directly from the
                                                                                                                                                                    main waiting area. A medicine
                                                                                                                                                                    store, which will operate as a
                                                                                                                                                                                                           as well as secure parking for staff.
                                                                                                                                                                                                           The alignment of the building
                                                                                                                                                                                                           ensures that existing pedestrian

    upgrade and additions                                                                                                     of Abbotsdale, just outside
                                                                                                                              Malmesbury in the Swartland
                                                                                                                                                                    medicine dispensary, as well
                                                                                                                                                                    as reception area and records
                                                                                                                                                                                                           paths are not significantly
                                                                                                                                                                                                           disturbed, and that the facility fits
                                                                                                                              Municipality, West Coast District.    room, are located next to the          into the existing community.
    Helderberg Hospital, located on          The design was conceived as a             the site for a period in 2020. As      This fully fledged clinic facility    main entrance on the western
    the corner of Lourensford Road           partially prefabricated model             work recommenced under less            is supplementing the primary          side of the clinic. A staff area,      The gable end roofs acknowledge
    and Irene Avenue, Somerset West,         using lightweight steel-framed            severe Disaster Management Act         healthcare service delivered from     which includes auxiliary space for     the style of the surrounding
    provides a comprehensive Level 1         and -cladded construction. This           regulations, there were additional     the community hall. The project       equipment and cleaning storage,        domestic historical architecture
    service package of care. Demands         makes it possible to disassemble          occupational health and safety         was opened by Provincial Minister     is situated in a controlled access     whilst providing a contemporary
    on the hospital have surpassed           the structure and potentially reuse       compliance requirements, e.g. the      of Health Dr Nomafrench Mbombo        portion of the clinic. Public          feel to the facility as a whole. The
    the capacity of the existing facility,   it in another location if required.       provision of personal protective       on 21 October 2020.                   ablutions (including universally       double volume space above the
    primarily due to the changes of          This design also maximises space          equipment and other infection                                                accessible ablutions) can be           waiting area promotes the healthy
    demography and disease profile of        efficiency by utilising less floor        control measures, including fewer      A community meeting was held          accessed directly from the waiting     principles related to ventilation
    the hospital catchment area. The         area than traditional masonry             labourers on site at one time. Other   in August 2018 to inform local        area.                                  and allows light to be brought into
    original Emergency Centre carried        construction. A phased approach           hindrances to the completion           stakeholders about the pending                                               the deeper parts of the building
    the bulk of this service pressure.       to construction was adopted so            of critical portions of the work       development, tender processes,        The outside waiting area               courtesy of glass bricks which are
    While it is due for replacement in       that the hospital could get the           included pandemic-induced              and Expanded Public Works             includes built-in seating and          located at high level and require
    the next 10 years, the Emergency         benefit of early occupation of            material supply shortages.             Programme (EPWP) targets and          was intentionally developed            no maintenance. This ensures that
    Centre Upgrade and Additions             completed sections.                                                              processes. Although the COVID-19      to make the best use of the            even the consulting rooms on
    project set out to alleviate these                                                 Quality control is managed by          National State of Disaster caused     northern aspect and views along        the south of the building receive
    capacity constraints on the current      The project started two years             the Department, the professional       unexpected delays, the project        the main road. The aim was to          natural light, resulting in a more
    infrastructure and services.             before the COVID-19 National              team and the contractor                was successfully completed in         encourage patients to use the          salutogenic (health-promoting)
                                             State of Disaster came into               through comprehensive quality          August 2020 and a significant         well-established practice of           space for both clinicians and
    The project scope comprised of           effect. The regulations closed            management plans.                      amount of money was spent on          sitting outside to reduce the risk     patients.
    extensive upgrades and additions                                                                                          providing short-term jobs for local   of infection. Encouraging the use
    to the Emergency Centre with a                                                                                            labourers and work for contractors    of external spaces has become          The service currently operates
    new main public entrance, waiting,                                                                                        while construction was underway.      even more appropriate since            three days a week, and it has the
    reception and triage areas, as           Project Information                                                                                                    the outbreak of COVID-19. The          capacity to expand working hours
    well as extensions to the existing                                                                                        The clinic is comprised of three      position of the building on the site   as the need increases.
    maternity ward to include a 12-bed                                                                                        consultation rooms and a prep         ensures the most effective usage
                                              Contractor:                                  Buildaway
    mother kangaroo unit. Non-clinical                                                                                        room (with external sputum            of area, easy access for the public,
    components of the project scope           Tender acceptance (Letter of Award):         26 March 2018
    included new fencing along the            Site handover:                               25 April 2018
    eastern boundary to address
                                              Original construction period:                20 Months
    recurring security concerns,
    increasing the secure parking area        Initial practical completion date:           26 November 2019                   Replacement satellite clinic at       October 2020.                          employment on the project as well
    by 91 bays, and improvements to           Revised practical completion date:           21 October 2020*                   Chatsworth                                                                   as skills training and on-the-job
    vehicular and pedestrian circulation      Anticipated practical completion date:       January 2021*                      The new replacement satellite         A similar process was followed         training in construction.
    on the property. The domestic                                                                                             clinic at Chatsworth was based on     for establishing community
                                              Approved project budget:                     R53,180,400                                                                                                     While the design template used
    water supply was also upgraded,                                                                                           the design template developed         participation and local stakeholder
    and the hot water system of the           Contract Participation Goal (CPG)            Black economic empowerment         for rural satellite clinics and       involvement before the project         the Chatsworth Satellite Clinic
    entire facility replaced.                 Targets                                      subcontractors 30%                 implemented in Abbotsdale only        began. A tender clarification          is the same as the one used in
                                                                                                                              25 km away. Lessons learned           meeting was held in Chatsworth.        Abbotsdale, the design was
                                                                                                                              from building the satellite           A local community liaison officer      optimised for local conditions
                                                                                                                              clinic at Abbotsdale enabled          (CLO) was appointed in line            and constraints. This necessitated
                                                                                                                              contractors to complete the           with Expanded Public Works             placing the parking area and some
    New emergency facilities for the         Caledon Hospital. By enabling             from the existing EMS centre were      Chatsworth Satellite Clinic more      Programme requirements and             services in different places, but
    Overberg District                        the coordination and dispatch of          permitted. The second was that         quickly. Challenges like delays in    targets established in terms of the    ensuring that existing pedestrian
    A R9 million Department of               rescue, police and fire services          there was minimal allowance for        securing electricity connections      Empowerment Impact Assessment          access routes were not disturbed.
    Transport and Public Works               in the Overberg District, the ECC         personnel to be decanted during        in rural areas were anticipated       (EmpIA) were outlined. This
    project to build a new Emergency         facilitates an effective pre-hospital     construction. The teams had            and mitigated. Even though the        process helped to ensure that the      The service at Chatsworth clinic
    Communication Centre (ECC)               emergency service to residents.           extensive engagement with end          project in Chatsworth began           project had a positive impact on       also runs three days a week and
    and Disaster Management Centre           The design and construction teams         users to establish an approach         three months later than the one       the local community both during        has provided community members
    in Caledon has been completed.           had to overcome two constraints to        that would work for all parties.       in Abbotsdale, both facilities        implementation, and after the          with a facility they can be proud of.
    The facilities are housed in a           successfully complete the project.        The project started on 3 June 2019     were completed at the same time       facility was opened. A total of
    new extension to the Emergency           The first was that no interruptions       and was completed on 27 October        and both were opened by the           23 local people including eight
    Medical Services (EMS) unit of           to ambulance services operating           2020.                                  Provincial Minister of Health on 21   youths benefited from short-term

6   ON TRACK                                                                                                                                                                                                                        ON TRACK       7
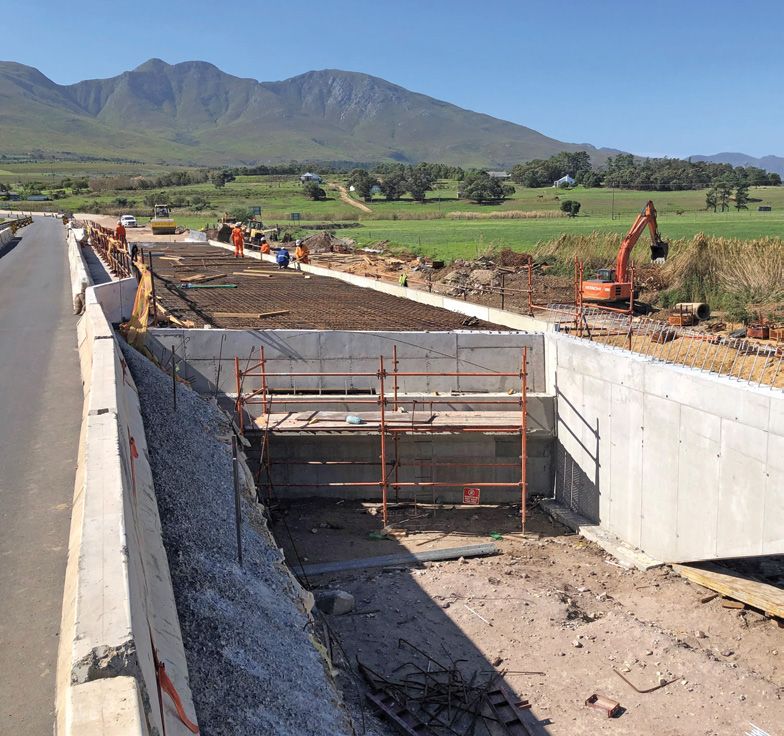
NTRACK - Property Efficiency Report - Western Cape Government
2018/2019                                                                                                                   2019/2020

                                                                                                                                            All         All                  Non-                                                                    All                              All                                              Non-
                                                                                                                              All WCG                             CBD                       Private                   All WCG                                                                                  CBD                                          Public
                                                                                                                                          leased      owned                  CBD                                                                   leased                           owned                                              CBD
                                                                                                                               offices                           offices                    sector                     offices                                                                                offices                                       sector
                                                                                                                                         buildings   buildings              offices                                                               buildings                        buildings                                          offices

                                                                                                          WC portfolio
                                                                                                                              214 506     69 580      144 926     148 118    66 388                            -      208 658                           69 468                        139 190                 144 571                 64 087                             -
                                                                                                          net area
                                                                           Although the final portfolio
    Property Efficiency                                                    target of 139.7 kWh/m²/        WC portfolio
                                                                                                                               211 037    69 580       141 457   144 649     66 388                            -      205 388                           69 468                       135 920                  143 203                   62 185                           -
                                                                           pa was not met, we remain      performance data
    Report 2019/2020                                                       committed to reducing our      Accommodated
                                                                                                                                11 168      3 633       7 535     7 902          3 266                       -                 9 139                       3 070                          6 069                   6 633                     2 506                        -
                                                                           energy consumption.
    Executive Summary
                                                                                                          office staff

                                                                                                          Cost/m²               3 037       2 842       3 222     3 205          2 861           2 907                         2 319                           2 692                        2 129                 2 653                     1 550             2 127
    An annual publication that demonstrates the Western Cape Gov-          Leased buildings showed
    ernment’s commitment to managing and improving the efficiency,         a reduction of 55% over the    Cost/FTE             59 716      55 187       61 921   58 669         62 437                       -                52 119                     60 915                       47 669                     57 283                 38 451

    effectiveness and sustainability of its property holdings.             last four years from
                                                                                                          m²/FTE                    19         19           19        18            22                       -                       22                               23                          22                           21              25                        -
                                                                           1.46 kL/m2/pa to
    Issue No. 9.
                                                                           0.65 kL/m²/pa. This is a       m²/Desk                   17          17          17        16            20                   15                              19                           20                          19                       18                  22                       16
                                                                           remarkable achievement.
                                                                                                          Energy kWh
                                                                                                          consumed per          2 893       3 619       2 520      3 237         1 647                       -                2 749                        3 988                          2 940                  3 809                      1 923                        -

                   39 = 208 658 m2
                                                                                                          FTE/pa

                                                                                                          Water kL
                                                                                                          consumed per              11         14           9         10            14                       -                           12                           13                           11                          11               12                       -
                   buildings
                                                                                                          FTE/pa

                                                                                                          Energy kWh/m²/pa        150         186          131       177           90                  231                          146                              176                          131                    176                   77                 222

            28 Owned
               buildings                           11 Leased
                                                      buildings
                                                                           For the fourth successive
                                                                           year, the WCG portfolio
                                                                                                          Water kL/m²/pa         0.63        0.73        0.47       0.54          0.76            0.94                             0.54                         0.64                         0.50                       0.53                 0.56                 0.84

                                                                           outperformed the private
                                                                           sector’s electricity
            15     Non-
                   CBD      11 CBD 02 EXCLUDED     03 Non-
                                                      CBD     08 CBD       consumption benchmark of
            54 828 m2       81 092 m2   3 270 m2   7 357 m2   62 111 m2    222 kWh/m2/pa, and this
                                                                           year by approximately 34%.
                                                                                                                         Environmental                                Water performance per kL/m2 per annum

                                                                                                                         performance                                                     1.20
                                                                                                                                                                                                        Water performance per kL/m2 per annum

                          Total electricity consumption per
                                                                                                                                                                                         1.00

                          kWh/m2/pa decreased by 2.6% from                                                64% of the water consumption
                                                                                                                                                                                         0.80

                                                                                                          analysis is from the portfolio’s
                                                                                                                                                                                         0.60

                                                                                                                                                                                                        1.14

                                                                                                                                                                                                                                          1.14
                          150 to 146 kWh/m²/pa over the 2019/2020

                                                                                                                                                                                                               1.10

                                                                                                                                                                                                                                                                            1.08

                                                                                                                                                                                                                                                                                                          1.03

                                                                                                                                                                                                                                                                                                                        0.94
                                                                                                                                                                                                                                                        0.89
                                                                                                                                                                                                                                                 0.91

                                                                                                                                                                                                                                                                                          0.86

                                                                                                                                                                                                                                                                                                                                                    0.84
                                                                                                                                                                                                                      0.80
                                                                                                                                                                                         0.40
                                                                                                          remote meters, 28% is from the

                                                                                                                                                                                                                                                                                   0.69
                          reporting period.

                                                                                                                                                                                                                                                                                                                 0.63

                                                                                                                                                                                                                                                                                                                                             0.54
                                                                           The operating cost for the                                                                                    0.20

                                                                           portfolio under review is
                                                                                                          monthly bills received from the
                                                                                                                                                                                         0.00

                          Water consumption decreased from                 R70/m², which is 6% higher     local municipalities, and 8% of                                   Targeted
                                                                                                                                                                                                       2015/2016
                                                                                                                                                                                                          1.14
                                                                                                                                                                                                                                         2016/2017
                                                                                                                                                                                                                                            1.14
                                                                                                                                                                                                                                                                           2017/2018
                                                                                                                                                                                                                                                                              1.08
                                                                                                                                                                                                                                                                                                        2018/2019
                                                                                                                                                                                                                                                                                                           1.03
                                                                                                                                                                                                                                                                                                                                      2019/2020

                                                                           than the SAPOA benchmark       the portfolio was excluded due
                          0.63 to 0.54 kL/m²/pa, a 14% decrease,           of R66/m². Leased buildings
                                                                                                                                                                            Actual
                                                                                                                                                                            Private sector
                                                                                                                                                                                                          1.10
                                                                                                                                                                                                         0.80
                                                                                                                                                                                                                                            0.91
                                                                                                                                                                                                                                           0.89
                                                                                                                                                                                                                                                                             0.69
                                                                                                                                                                                                                                                                             0.86
                                                                                                                                                                                                                                                                                                          0.63
                                                                                                                                                                                                                                                                                                          0.94
                                                                                                                                                                                                                                                                                                                                            0.54
                                                                                                                                                                                                                                                                                                                                            0.84
                          during the 2019/2020 reporting period.           in the portfolio outperform
                                                                                                          to inaccurate or unavailable data.
                                                                           the SAPOA benchmark by
                                                                           6% for the same period.
                                                                                                                           The owned buildings’
                          The portfolio achieved an average                                                                consumption of                             Electricity performance per kWh/m2 per annum

                          desk space of 19m², an increase from                                                             131 kWh/m2/pa is 25%                                  300
                                                                                                                                                                                                 Electricity performance per kWh/m2 per annum

                          17m² compared to the same period last year.                                                      better than the leased                                                                                                                                                  EPC benchmmark 185
                                                                                                                                                                                  250
                                                                                                                           buildings’ consumption
                                                                                                                           of 176 kWh/m2/pa.                                     200

                                                                                                                                                                                  150
                          Extensive analysis has been done on the

                                                                                                                                                                                                       273

                                                                                                                                                                                                                                         249

                                                                                                                                                                                                                                                                           247

                                                                                                                                                                                                                                                                                                        237
                                                                           The solar energy yield has

                                                                                                                                                                                                                                                                                                                                      231

                                                                                                                                                                                                                                                                                                                                                                  222
                                                                                                                                                                                                                                                                                                                                                      139
                                                                                                                           The CBD portfolio                                      100

                                                                                                                                                                                                 191
                          portfolio’s total occupancy cost per square

                                                                                                                                                                                                                                   168

                                                                                                                                                                                                                                                                     158
                                                                           increased from 26 MWh in

                                                                                                                                                                                                                                                                                                                                150

                                                                                                                                                                                                                                                                                                                                                            146
                                                                                                                                                                                                                                                                                                  145

                                                                                                                                                                                                                                                                                                                          154
                                                                                                                           (176 kWh/m2/pa)                                        50
                          metre, and we are delighted to report that the

                                                                                                                                                                                                                                                               182

                                                                                                                                                                                                                                                                                            171
                                                                                                                                                                                           191

                                                                                                                                                                                                                             191
                                                                           2016/2017 to 3 201 MWh
                                                                           in 2019/2020, and the cost                      outperformed the private                                0

                          total cost has decreased by nearly 25%           savings increased over the                      sector benchmark                            Targeted
                                                                                                                                                                                          2014/2015
                                                                                                                                                                                                 191
                                                                                                                                                                                                                        2015/2016
                                                                                                                                                                                                                                   191
                                                                                                                                                                                                                                                         2016/2017
                                                                                                                                                                                                                                                                     182
                                                                                                                                                                                                                                                                                           2017/2018
                                                                                                                                                                                                                                                                                                  171
                                                                                                                                                                                                                                                                                                                        2018/2019
                                                                                                                                                                                                                                                                                                                                154
                                                                                                                                                                                                                                                                                                                                                    2019/2020
                                                                                                                                                                                                                                                                                                                                                            139

                          over the 2019/2020 reporting period              corresponding period from                       (220 kWh/m2/pa) by                          Actual
                                                                                                                                                                       Private sector
                                                                                                                                                                                                191
                                                                                                                                                                                                273
                                                                                                                                                                                                                               168
                                                                                                                                                                                                                               249
                                                                                                                                                                                                                                                                 158
                                                                                                                                                                                                                                                                 247
                                                                                                                                                                                                                                                                                                  145
                                                                                                                                                                                                                                                                                                  237
                                                                                                                                                                                                                                                                                                                                150
                                                                                                                                                                                                                                                                                                                                231
                                                                                                                                                                                                                                                                                                                                                           146
                                                                                                                                                                                                                                                                                                                                                           222
                          from R3 097 to R2 319/m².                        R32 000 to R4 252 626pa.                        more than 20%.

8     ON TRACK                                                                                                                                                                                                                                                                                                                      ON TRACK                                 9
NTRACK - Property Efficiency Report - Western Cape Government
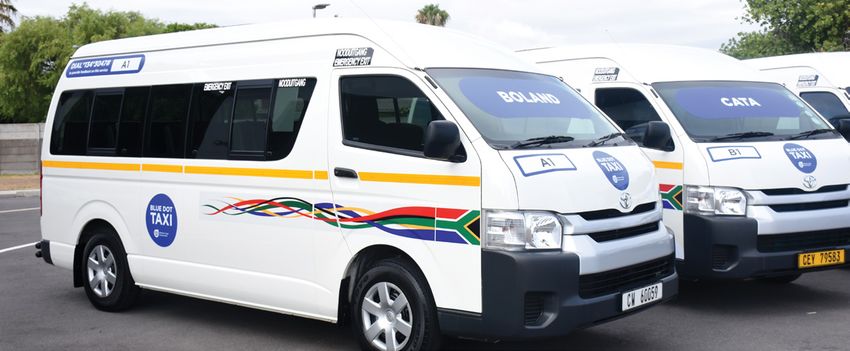
Portfolio - m2 per desk                                    CBD buildings - m2 per desk
                                                                                                                                        Portfolio - m2 per desk
                                                                                                                                                                                                                                        Operating                              Municipal charges                                             Repairs and
                       Space                                                                                                        19
                                                                                                                                                  16
                                                                                                                                                            18
                                                                                                                                                                                               16 Global public sector benchmark
                                                                                                                                                                                                                                        cost analysis                          •    Electricity
                                                                                                                                                                                                                                                                                                                                             maintenance

                       utilisation
                                                                                             Combined CBD                      17                                                                                                                                              •    Municipal charges                                        •    Air conditioning
                                                                                          All buildings                                                     18
                                                                                                                                    19
                                                                                                                                                      27                      24                                                                                               •    Rates and taxes                                          •    Building fabric
                                                                                                                                                           18                                                                                                                  •    City Improvement District                                •    Elevators / escalators
                                                                                                                                            22
     Space efficiency of the                                                                 CBD owned
                                                                                  Combined non-CBD
                                                                                                                                     20          15                                                                                     Operating costs have become a               (CID) levies where applicable                            •    Tenant installation costs
                                                                                                                                       21                       19
                                                                                                                                                                                                                                        crucial concern for commercial                                                   Operating
     CBD buildings is 12% less                                                                                                                                        31 22
                                                                                                                                                                                                                                        property owners and tenants
     efficient than the public                                                                                                16
                                                                                                                                    18                           19
                                                                                                                                                                  16 Global public sector benchmark
                                                                                                                                                                                                                                                                                                                           costs
                                                                                     CombinedCBD
                                                                                              CBDleased                                                17                                                                               throughout the world. Analysing
                                                                                                                                   18
     sector benchmark of                                                                                                                     24
                                                                                                                                                       17
                                                                                                                                                                 20
                                                                                                                                                                                                                                        the various components that
                                                                                                                                                                                                                                                                               Soft services                                             Other operating costs
     16 m²/desk.                                                                                         0   0        5             5 10               15 10                       20     15   25           30
                                                                                                                                                                                                             20             35     25
                                                                                                                                                                                                                                        make up operating costs assists
                                                                                                                                                                                                                                                                               •    Cleaning                                             •       Property management fees
                                                                                                         2019/2020      2018/2019                 2017/2018                   2016/2017                                                 both tenants and landlords to                                                                    •       Facilities management fees
                                                                                                              2019/2020    2018/2019               2017/2018                  2016/2017                                                                                        •    Gardens / landscaping
                                                                                                                                                                                                                                        identify those components that         •    Security                                             •       Leasing fees and commissions
                                                                                                                                                                                                                                        have the most influence on the                                                                   •       Insurance, bad debts and other

                                                                                                                                                                                                                                        cost of occupying a space.

                       Performance                                                                       The total cost has decreased by nearly 25% over
                                                                                                         the reporting period from R3 097 to R2 319/m².
                       measurement cost
          All buildings - cost per m²                                                                                                                       Spending on all CBD                                                                          Non-CBD combined                                                Spending on all CBD
                                                                        All buildings - cost per m²                                                         properties dropped from                                                                      properties reduced their                                        properties dropped from
                                                              2 319                                                                                         R3 205 to R2 653/m² in                                                                       costs from R2 861 to                                            R3 205 to R2 653/m² in
                                                                                                                                                            2019/2020.
                                                                                                                                                                                                                                                                                                                         2019/2020.
                                                                         3 097
              All buildings
                                              All buildings - cost per 3m²
                                                                         807
                                                                                                                                                                                                                                                         R1 550/m² in 2019/2020.
                                                                  2 691
                                            2 319
                                                           2 129
                                                       3 097                                 2 127 Private sector benchmark
       All buildings
                                                              3 807        3 222
      All owned buildings                          2 691
                                                                                  4 291
                                           2 129
                                                        3 222     2 798                                                                                                                                                                    Operating cost by cost category (%)
All owned buildings
                                                           4 291
                                                                 2 692
                           #N/A                                          2 127 Private sector benchmark
                                                                      2 842                                                                            Non-CBD combined                                                                                                        Operatingcost
                                                                                                                                                                                                                                                                              Operating  costby
                                                                                                                                                                                                                                                                                              bycost
                                                                                                                                                                                                                                                                                                 costcategory
                                                                                                                                                                                                                                                                                                      category(%)
                                                                                                                                                                                                                                                                                                               (%)
      All leased buildings                         2 692                                                                                                                                                                                                                      Operating cost by cost category (%)
All leased buildings
                                                    2 842               2 953                                                                          properties reduced their                                                           70
                                                                                                                                                                                                                                         70%
                                                      2 953                       3 606                                                                                                                                                  70%                       62
                                                              3 606                                                                                    costs from R2 861 to
                                                                                                                                                                                                                                          60
                                                                                                                                                                                                                                         60%                       62
                       0
                                  0        500
                                          1 000
                                                        1 000
                                                                2 000
                                                                        1 500        2 000
                                                                                      3 000
                                                                                                 2 500       3 000
                                                                                                         4 000
                                                                                                                      3 500
                                                                                                                          5 000
                                                                                                                                   4 000         4 500
                                                                                                                                                       R15 000
                                                                                                                                                           550/m² in 2019/2020.
                       2019/2020            2018/2019                 2017/2018            2016/2017                                                                                                                                     60%             51
                                      2019/2020                2018/2019                  2017/2018           2016/2017
                                                                                                                                                                                                                                          50
                                                                                                                                                                                                                                         50%             51   45
                                                                                                                                                                                                                                         50%        41        45
                                                                                                                                                                                                                                          40
                                                                                                                                                                                                                                         40%        41
                                                                                                                                                                                                                                         40%
                                                                                                                                                                                                                                          30

                              9
                                                                                                                                                                                                                                         30%                                   25                                         26
                                                                                                             9 Dorp Street municipal vs. basement water (kL/m2/pa)                                                                                                                                                  25         24

                                              Dorp
                                                                                                                                                                                                                                         30%                                                                              26                                   22
                                                                                                                                                                                                                                                                               25                                   25         24                                             19
                                                                                                                                                                                                                                          20
                                                                                                                                                                                                                                         20%                                                17                                                                 22
                                                                                                                     9 Dorp Street municipal vs. basement water (kL/m2/pa)                                                                                                                                                                                                    19
                                              Street                                                                                                                                                                                     20%                                                17                                                                        13
                                                                                                                                                                                                                                                                                                                                    11                   10
                                                                                                             0.60                                                                                                                                                                                  8                                                                  13
                                                                                                                                                                                                                                          10
                                                                                                                                                                                                                                         10%                                                                                        11                   10
                                                                                                                                                                                                                                         10%                                                       8
                                                                                                             0.50                                                                                                                                  41    51   45   62          25      11   17     8                25    26   24    11                   10    22     13     19
                                                                                                                              0.20                                                                                                         0
                                                                                                                                                                                                                                          0%                                            1
                                                                                                             0.40
         The building showed a reduction                                                                                                                              0.20                                                                0%       Municipal
                                                                                                                                                                                                                                                   Municipal charges
                                                                                                                                                                                                                                                             charges         Repairs & maintenance                  Soft services
                                                                                                                                                                                                                                                                                                                    Soft  services                        OtherOp
                                                                                                                                                                                                                                                                                                                                                          Other Opcosts
                                                                                                                                                                                                                                                                                                                                                                    costs
                                                                                                             0.30                                                                                                                                  Municipal charges         Repairs & maintenance                  Soft services                         Other Op costs
         of approximately 41% in its use                                                                                                                                                        0.17                                                                       Allowned
                                                                                                                                                                                                                                                                          All  owned     Allleased
                                                                                                                                                                                                                                                                                        All  leased          Allbuildings
                                                                                                                                                                                                                                                                                                            All  buildings      SAPOA
                                                                                                                                                                                                                                                                                                                               SAPOA
                                                                                                             0.20                                                                                                                                                         All owned     All leased          All buildings      SAPOA
         of municipal water over the                                                                                          0.34
                                                                                                                                                                      0.26
         three-year period 2017/2018 to                                                                      0.10                                                                               0.20

                                                                                                             0.00
         2019/2020, from 0.34 kL/m²/pa
                                                                                                                          2017/2018                             2018/2019                  2019/2020
         to 0.20 kL/m²/pa.                                                                                                                                                                                                                                                            Department of Transport and Public Works
                                                                                                                              Municipal water                            Basement water
                                                                                                                                                                                                                                                                                      Head Office, 9 Dorp Street, Cape Town, 8001.
                                                                                                                                                                                                                                                                                      Tel: 021 483 6639
                                                                                                                                                                                                                                                                                      www.westerncape.gov.za

10     ON TRACK                                                                                                                                                                                                                                                                                                                                                       ON TRACK     11
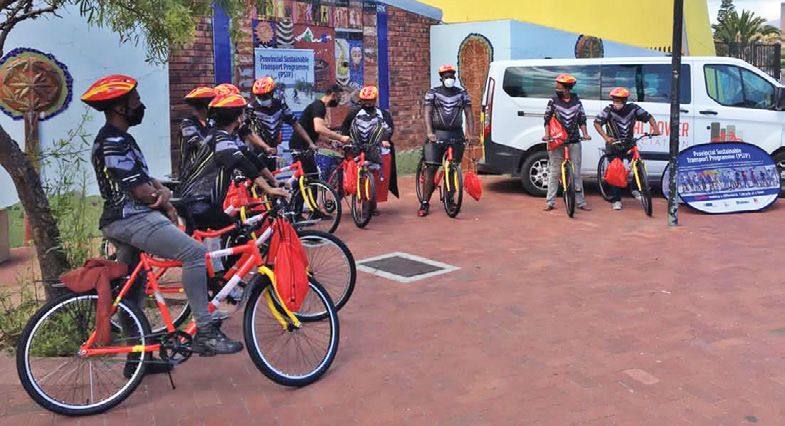
NTRACK - Property Efficiency Report - Western Cape Government
Department
     hands over
     bicycles
     for use by
     CBOs
     The Western Cape Department
     of Transport and Public Works
     (DTPW) launched the first round
     of bicycle distributions as part of
                                                                                                                           Blue Dot taxi                                              travelling by taxi. The second was to curb illegal
                                                                                                                                                                                      operations and eradicate taxi violence. Most
     the flagship Provincial Sustainable
     Transport Programme (PSTP).
     So far, 265 bicycles have been
                                                                                                                           pilot project is                                           importantly, these efforts aimed to empower and
                                                                                                                                                                                      transform the minibus taxi industry.

     handed over and another 130 are
     still to be delivered.                                                                                                launched                                                   During the COVID-19 pandemic, DTPW established
                                                                                                                                                                                      the Red Dot and Red Dot Lite transport services in
                                                                                                                                                                                      partnership with SANTACO Western Cape. Red Dot
     The bicycle distribution project                                                                                                                                                 provided safe transport to and from quarantine and
     will distribute almost 400 bicycles                                                                                   The Blue Dot taxi service is a new Department of           isolation facilities, and Red Dot Lite provided essential
     to community-based organisations       the Red Zone Neighbourhood              based in Woodstock whose goal          Transport and Public Works pilot programme to              public sector health workers with transport home
     (CBOs) in hotspot areas.               Watch in Grassy Park.                   is to increase the use of public       reward improved minibus taxi driving behaviour,            during the hard lockdown.
                                                                                    and non-motorised transport,           reduce the incidence of illegal operations, and bring
     The project aims to remove             This neighbourhood watch helps          distributed the bicycles to local      down the level of violent conflict. This is a first for    Following the success of Red Dot, and to help give
     the transport barrier to help          to fight crime in the area through      community-based organisations.         South Africa and it marks a significant milestone in the   effect to the spirit of the National Taxi Lekgotla, the
     local community organisations          the work of 17 active patrollers,                                              empowerment and transformation of the industry. The        Blue Dot taxi service pilot was launched in Cape Town
     maximise their reach and meet the      ten of which will be using bicycles.    Providing a bicycle to each of 20      Department is looking forward to improvements in taxi      on 4 March 2021 by Premier Alan Winde, the Provincial
     needs of their beneficiaries more      The bicycles will reduce personal       CBOs will reduce the transport         operations, and passengers can look forward to better      Minister of Transport and Public Works, SANTACO
     effectively. In communities where      costs and allow speedy assistance       barriers they face so that they can    safety and comfort.                                        Western Cape, and members of the minibus taxi
     most of the population can barely      to be rendered.                         maximise their reach and better                                                                   industry.
     afford to use taxis, bicycles are a                                            meet the needs of the people           Minibuses are the country’s biggest provider of public
     more efficient way than walking to     Twelve bicycles were delivered to       they serve. Bicycles are a more        transport. The industry delivers an essential service      “Our response throughout COVID-19 has been
     deliver services that are essential    Inspire Life, a training organisation   efficient of travelling than walking   that is vital to the functioning of the economy and the    innovative, agile and responsive and the Red Dot
     to the community.                      equipping the youth with film           to deliver essential community         ability of people to access services. Blue Dot services    Service has been a shining example of that,” said
                                            production skills to tell their         services. Bicycles and other forms     are carefully monitored with onboard vehicle trackers      Premier Winde. “The Blue Dot service shows this
     This initiative helps to give          stories and have a positive             of non-motorised transport also        and monitoring in the field. Passengers are able to give   government’s commitment to continuing to deliver
     effect to the PSTP’s citizen-          impact on their communities.            have the environmental benefit of      feedback from their cellphones using the USSD code         services innnovatively, and in a way that contributes to
     centric promotion of non-              They also have programmes that          travel without carbon emissions.       *134*3047# or WhatsApp 073 249 2152.                       the key pillars of our recovery – jobs, safety and dignity,
     motorised, environmentally             are dedicated to feeding the                                                                                                              and well-being. This will not only provide safer, more
     friendly transport. The PSTP also      community and helping alcohol           Open Streets will distribute           About 1 300 taxis will be participating in the Blue Dot    dignified transport, but will also allow people to travel
     assists municipalities to plan         and drug addicts learn new habits.      one bicycle to a CBO volunteer         pilot. Eight new companies have been established           to work and to access economic opportunities while
     infrastructure improvements such                                               engaged in delivering services in      by the province’s regional taxi councils, along with       supporting jobs in the taxi industry.”
     as sidewalks, bicycle lanes, traffic   Inspire Life has 21 volunteers with     each of 20 different communities.      Umanyano Travel Services. Umanyano was established
     calming and safe crossings to          12 currently active. The bicycles       This person will be a champion         by the Western Cape branch of the South African            We are striving to fundamentally shift the industry’s
     better protect vulnerable road         will increase the group’s capacity      for people using bicycles. These       National Taxi Council (SANTACO) to participate in          existing economic drivers which incentivise fare-
     users.                                 to deliver supplies to the soup         volunteers will be tracked and         DTPW’s earlier Red Dot taxi initiative.                    chasing, competition, recruitment of illegal operators,
                                            kitchens and hold motivational          will have to keep a bicycle diary                                                                 and route contestation. We have gathered to celebrate
     On 14 and 15 April DTPW in             sessions for at-risk youth.             to capture their experiences. The      In October 2020, the National Department of                a great milestone for public transport and the minibus
     partnership with the Bicycle                                                   data from these diaries will be        Transport, provincial transport departments and            taxi industry. Our engagements with the industry’s
     Consortium (Qhubeka, Pedal             DTPW also handed 20 bicycles            collected and used to promote          representatives of the taxi industry participated          provincial and regional structures have been extremely
     Power Association and Ben Bikes)       over to the Open Streets                cycling in urban environments.         in the National Taxi Lekgotla. The first aim of this       positive, and the enthusiasm expressed for the project
     handed over 27 bikes to two            organisation in March 2021. Open                                               long-standing collaboration with the industry was          has been heartening to witness in these challenging
     CBOs: Inspire Life in Langa, and       Streets, a non-profit organisation                                             to improve the quality of service and the safety of        times.

12   ON TRACK                                                                                                                                                                                                                       ON TRACK        13
NTRACK - Property Efficiency Report - Western Cape Government
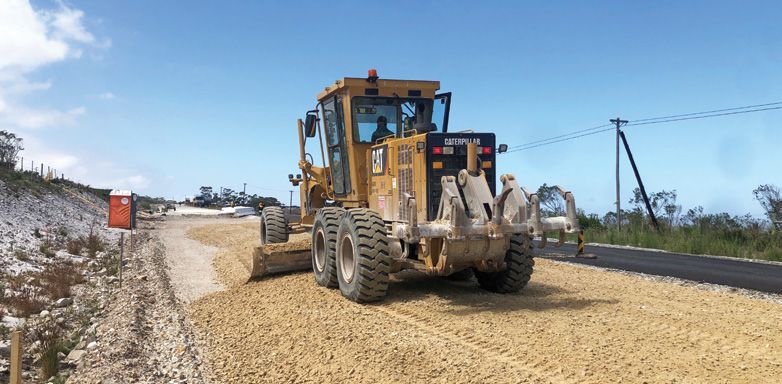
14   ON TRACK   ON TRACK   15
NTRACK - Property Efficiency Report - Western Cape Government
All children under three years’ old
must be strapped into a car seat when
    travelling in a motor vehicle.
Fact: Studies revealed that child safety seats that are correctly installed for use by
children age 0-4 years can reduce the need for hospitalisation by 69% after a road
crash. Restraining the children and other passengers in a motor vehicle will:
• Reduce the risk of contact with the interior of the vehicle and reduce the severity
   of injuries if a crash occurs
• Distribute the force of a crash over the strongest parts of the body
• Prevent the occupant from being ejected from the vehicle on impact
• Prevent injury to other occupants (for example in a front crash, unbelted rear-
   seated passengers can be thrown forward and hit other occupants).

                                       Be alert. Stay alive. 365.
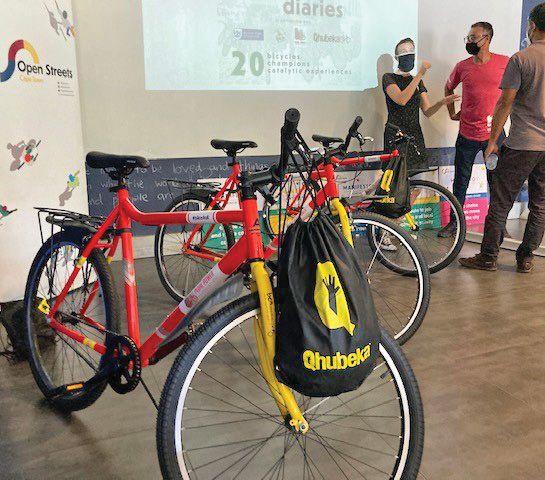
NTRACK - Property Efficiency Report - Western Cape Government
You can also read