Nuclear Power in a Post-Fukushima World - 25 YEARS AFTER THE CHERNOBYL ACCIDENT THE WORLD NUCLEAR INDUSTRY STATUS REPORT 2010-2011
←
→
Page content transcription
If your browser does not render page correctly, please read the page content below
THE WORLD NUCLEAR INDUSTRY STATUS REPORT 2010–2011

Nuclear Power in a
Post-Fukushima World
25 YEARS AFTER THE CHERNOBYL ACCIDENT

Mycle Schneider
Antony Froggatt
Steve Thomas

                                                     Mycle Schneider Consulting

                                                                                  V3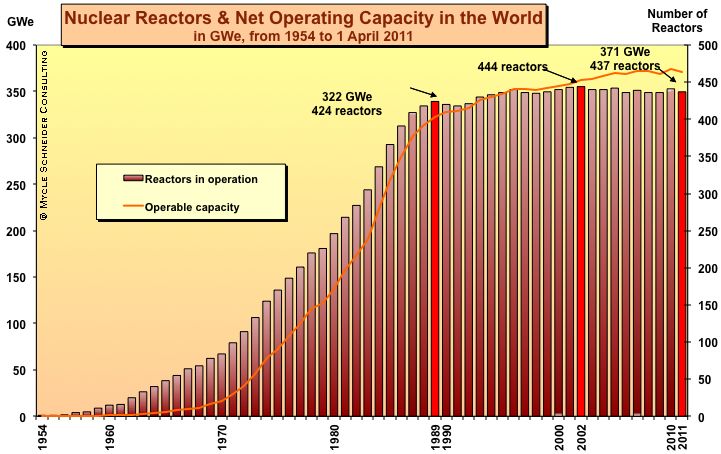
       THE WORLD NUCLEAR INDUSTRY STATUS REPORT 2010–2011

                  Nuclear Power in a
                 Post-Fukushima World
                     25 Years After the Chernobyl Accident

                                             By

                                    Mycle Schneider
            Independent Consultant, Mycle Schneider Consulting, Paris (France)
                          Project Coordinator and Lead Author

                                    Antony Froggatt
                          Independent Consultant, London, U.K.

                                      Steve Thomas
                  Professor for Energy Policy, Greenwich University, U.K.

                                Modeling and Graphic Design
                                       Julie Hazemann
                          Director of EnerWebWatch, Paris, France

                                            Editing
                                         Lisa Mastny
                        Worldwatch Institute, Washington, D.C., U.S.A.

                          Paris, Berlin, Washington, April 2011

                               Commissioned by
                  Worldwatch Institute, Washington, D.C., U.S.A.
                                   with the support of
                       the Greens-EFA in the European Parliament
About the Authors


Mycle Schneider is an independent international consultant on energy and nuclear policy based in
Paris. He founded the Energy Information Agency WISE-Paris in 1983 and directed it until 2003.
Since 1997, he has provided information and consulting services to the Belgian Energy Minister, the
French and German Environment Ministries, USAID, the International Atomic Energy Agency,
Greenpeace, the International Physicians for the Prevention of Nuclear War, the Worldwide Fund for
Nature, the European Commission, the European Parliament’s Scientific and Technological Option
Assessment Panel and its General Directorate for Research, the Oxford Research Group, and the
French Institute for Radiation Protection and Nuclear Safety. Since 2004, Mycle has been in charge of
the Environment and Energy Strategies lecture series for the International MSc in Project
Management for Environmental and Energy Engineering Program at the French Ecole des Mines in
Nantes. In 1997, along with Japan’s Jinzaburo Takagi, he received the Right Livelihood Award, also
known as the “Alternative Nobel Prize.”

Antony Froggatt works as independent European energy consultant based in London. Since 1997, he
has worked as a freelance researcher and writer on energy and nuclear policy issues in the EU and
neighboring states. He has worked extensively on EU energy issues for European governments, the
European Commission and Parliament, environmental NGOs, commercial bodies, and media. He has
given evidence to inquiries and hearings in the parliaments of Austria, Germany, and the EU. He is a
part time senior research fellow at the Royal Institute of International Affairs – Chatham House in
London. Antony works intensively with environmental groups across Europe, particularly on energy
markets and policy and helped to establish a network on energy efficiency. He is a regular speaker at
conferences, universities, and training programs across the region. Prior to working freelance, Antony
served for nine years as a nuclear campaigner and co-coordinator for Greenpeace International.

Steve Thomas is a professor of energy policy at the Public Services International Research Unit
(PSIRU) of the University of Greenwich, where he has been senior researcher since 2001. He holds a
BSc (honors) degree in Chemistry from Bristol University and has been working in energy policy
analysis since 1976. His main research interests are reforms of energy industries, economics, and
policy toward nuclear power, and corporate policies of energy industry companies. Recent clients
include Public Services International, the European Federation of Public Service Unions, the
Nonproliferation Policy Education Center (USA), Energywatch (UK), and Greenpeace International.
---------------------------------------------------------------------------------------------------------------------------
Acknowledgments
The authors wish to thank Amory B. Lovins, Rebecca Harms, and Chris Flavin for their support for
this project. The project coordinator wishes to express his sincere gratitude to his co-authors for their
invaluable contributions, creative thinking, and impeccable reliability. Thank you also to M.V.
Ramana and Walt Patterson for their useful comments on a draft version of the report. Special thanks
to Julie Hazemann who has not only contributed the fundamental database work but who has been
throughout a permanent, rock-solid support under insupportable conditions. Finally, a big thanks to
Lisa Mastny for her editing efforts under impossible time constraints.

                                                       Contacts

                                                     Publisher
                                                 Worldwatch Institute
                                                 www.worldwatch.org

                                       © Mycle Schneider consulting 2011

                                                        Authors
                        Mycle Schneider             Antony Froggatt                 Steve Thomas
                    Phone: +33-1-69 83 23 79 Ph: +44-20-79 23 04 12             Ph: +44-208 331 9056
                  Email: mycle@orange.fr    E: a.froggatt@btinternet.com    E: stephen.thomas@greenwich.ac.uk

M. Schneider, A. Froggatt, S. Thomas                 World Nuclear Industry Status Report 2010-2011                       2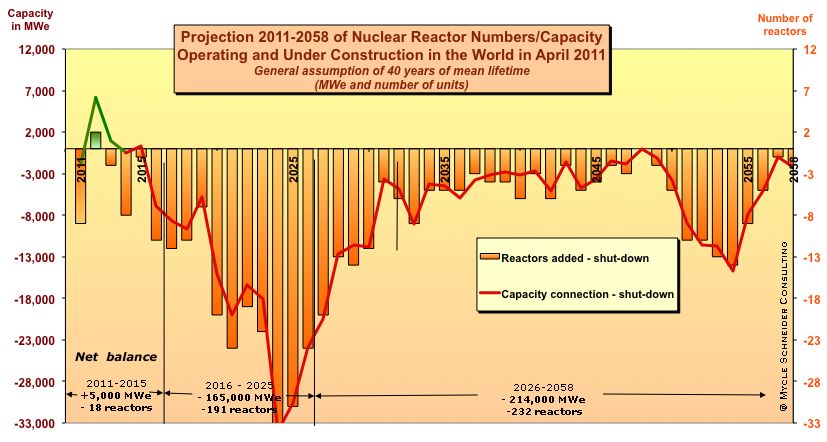
Table of Contents
Foreword ................................................................................................................................................ 3
Executive Summary .............................................................................................................................. 7
Introduction ........................................................................................................................................... 9
General Overview Worldwide ........................................................................................................... 11
Overview of Operation, Power Generation, Age Distribution...................................................... 11
Overview of Current New Build ................................................................................................... 14
Potential Newcomer Countries .......................................................................................................... 19
Power Plants Under Construction ................................................................................................. 21
Contracts Signed ........................................................................................................................... 22
Decisions Announced by Industry and Governments ................................................................... 23
Nuclear Economics .............................................................................................................................. 25
Reactor Licensing and Economics ................................................................................................ 25
Implementation Costs of Nuclear Power Plants ........................................................................... 27
Developments in 2010 .................................................................................................................. 32
Conclusion on Economics ............................................................................................................. 34
Nuclear Power vs. Renewable Energy Development ....................................................................... 34
An Economic Comparison ............................................................................................................ 35
Rapid and Widespread Deployment ............................................................................................. 37
Are Nuclear and Renewables Compatible? .................................................................................. 40
Post-3/11 Developments in Selected Countries (as of April 2011) ................................................. 41
Asia ............................................................................................................................................... 41
Middle East ................................................................................................................................... 44
Europe ........................................................................................................................................... 44
Non-EU Europe............................................................................................................................. 47
The Americas ................................................................................................................................ 47
Annex 1. Overview by Region and Country ..................................................................................... 50
Annex 2. Status of Nuclear Power in the World (1 April 2011)...................................................... 72
Annex 3. Nuclear Reactors in the World Listed as “Under Construction” (1 April 2011) .......... 73
Endnotes…………………………………………………………………………………...……………...…....75
Figures and Tables
Figure 1. Nuclear Power Reactor Grid Connections and Shutdowns, 1956–2011 ............................................... 12
Figure 2. World Nuclear Reactor Fleet, 1954–2011 ............................................................................................. 12
Figure 3. Nuclear Power Generation by Country, 2009 ....................................................................................... 13
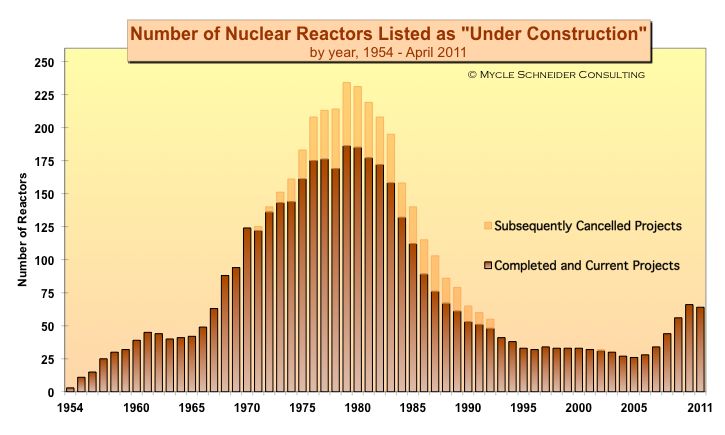
Figure 4. Number of Nuclear Reactors under Construction ................................................................................. 14
Figure 5. Age Distribution of Operating Nuclear Reactors, 2011 ........................................................................ 16
Figure 6. Age Distribution of Shutdown Nuclear Reactors, 2011 ........................................................................ 16
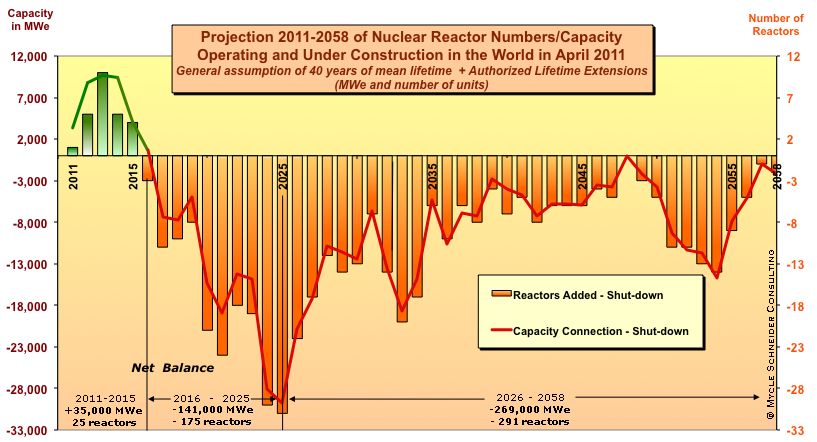
Figure 7. The 40-Year Lifetime Projection .......................................................................................................... 17
Figure 8. The PLEX Projection ............................................................................................................................ 18
Figure 9. Forty-Year Lifetime Projection versus PLEX Projection ..................................................................... 19
Figure 10. Start-ups and Closures of National Nuclear Power Programs, 1950–2010 ........................................ 19
Table 1. Newcomer Countries in Nuclear Power, by Level of Interest, 2008 and 2010 ...................................... 20
Table 2. Reactor Designs Currently Under Review in the United States ............................................................. 26
Figure 11. Government Research and Development Budgets across IEA countries 1986–2008 ......................... 36
Figure 12. Solar and Nuclear Costs: The Historic Crossover ............................................................................... 36
Table 3. Construction Time of Nuclear Power Plants Worldwide, 1965–2010 ................................................... 37
Figure 13. Net Additions to Global Electricity Grid from New Renewables and Nuclear, 1990–2010 .............. 38
Table 4. Renewable Energy Investment, Top 10 Countries, 2009 versus 2010 ................................................... 39
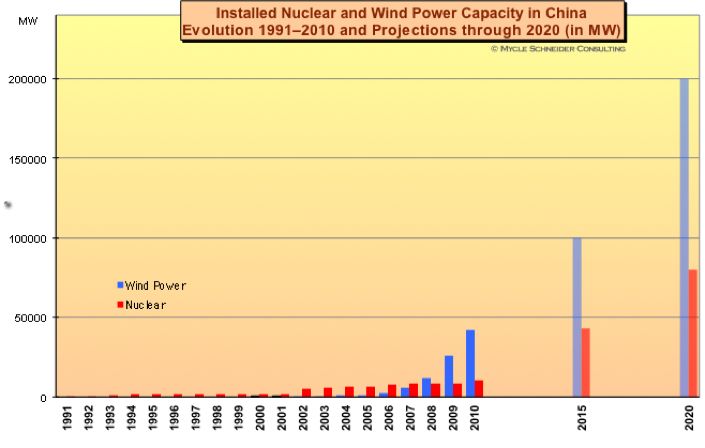
Figure 14. Installed Nuclear and Wind Power Capacity in China, 1991–2010 and Projections to 2020 ............. 39
Figure 15. Cumulative Electricity Additions in the European Union, by Energy Source, 2000–10 .................... 40
Figure 16. Fortunes of Nuclear and Clean Energy Companies, January–March 2011………………………….…………..49
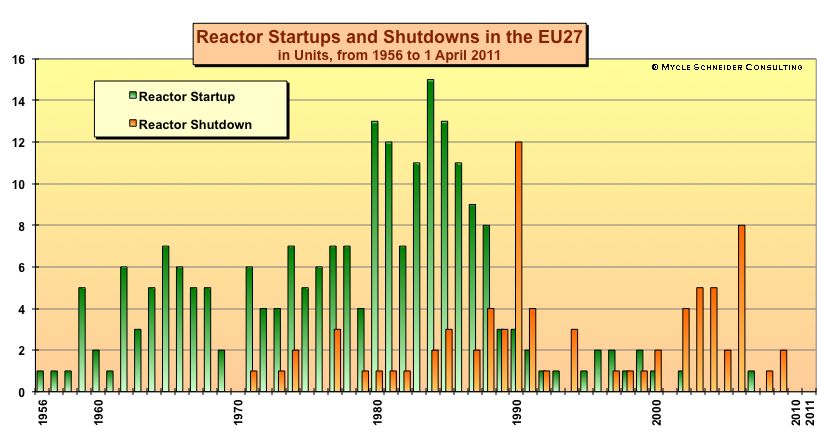
Figure 17. Nuclear Reactors Startups and Shutdowns in the EU27, 1956–2011 ................................................. 59
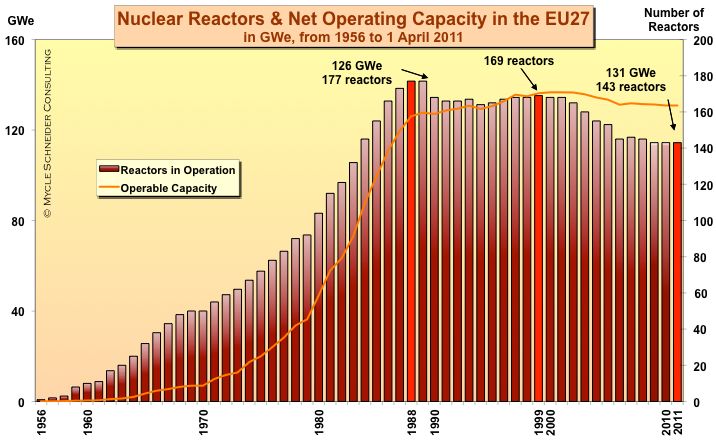
Figure 18. Nuclear Reactors and Net Operating Capacity in the EU27, 1956–2011 ........................................... 59
M. Schneider, A. Froggatt, S. Thomas World Nuclear Industry Status Report 2010-2011 3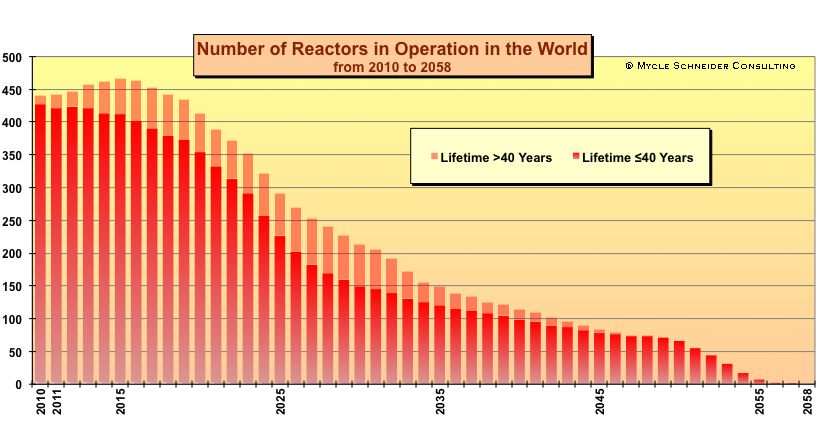
Foreword
Mycle Schneider, Antony Froggatt, and Steve Thomas have again performed a vital public service by
preparing this uniquely independent, thorough, and timely assessment of the global status of nuclear
power, both before and after the Fukushima disaster began to unfold on March 11, 2011.

From Beijing and London to Tokyo and Washington, energy bureaucracies have for decades been
pervaded by nuclear enthusiasm. The past few years, for the first time in history, also saw most major
governments led by advocates of nuclear power. The media are saturated with a skilled, intensive, and
effective advocacy campaign by the nuclear industry and its powerful allies. With disinformation
increasingly prevalent and wholly counterfactual accounts of nuclear power’s status and competitive
landscape widely believed by otherwise sensible people, this report’s objective assessment is vital to
informed discourse and prudent choice.

The facts disclosed here, stated correctly and cited carefully to reputable sources, unravel the dense
curtain of myths surrounding this deeply troubled industry. Readers may be surprised to learn, for
example, that every nuclear power plant under construction in the world was chosen by central
planners: not one was a free-market purchase fairly competed against or compared with alternatives.

By contrast, renewable electricity generators rule the marketplace, providing half the world’s new
generating capacity in 2008–09. But while wind and solar power boom, nuclear and coal-plant orders
wither. Their cost and risk dissuade investors. Any new U.S. nuclear plants are 100-percent
subsidized and more, but even in the three pre-crash years starting in August 2005, with the strongest
capital markets, political support, and public acceptance in history, they couldn’t raise a penny of
private capital (nor have they since) because they have no business case. Moreover, they have four
daunting risks:

First, an accident can swiftly transform a multi-billion dollar generating asset into a larger cleanup
liability. The Fukushima accident has just vaporized the balance sheet of the world’s #4 power
company, TEPCO. A 2007 earthquake had cost the company perhaps $20 billion; this one could cost
it $100-plus billion. TEPCO is now broke and is becoming, in whatever form, a ward of the state. And
with such an unforgiving technology, accidents anywhere are accidents everywhere. This report
documents how events at Fukushima, even if they don’t get worse, are sending widening shockwaves
through the energy and financial communities, and undermining the industry’s credibility.

Second, efficient use of electricity, which is already flattening industrialized countries’ demand and
slackening global demand, is getting ever bigger and cheaper. Integrative design is even turning
diminishing returns into expanding returns, making big savings cheaper than small ones. Efficiency is
rapidly spreading to developing countries and indeed becoming a core element of national strategy:
“Negawatts” are China’s top development priority.

Third, atrophied skills, overstretched supply chains, and sheer complexity keep nuclear capital costs
soaring. The threefold cost overruns of the previous U.S. nuclear binge devastated utilities’ balance
sheets: only 41 percent of ordered plants were built and survive. In the past five years, the estimated
capital cost for new reactors rose three- to eightfold, mainly because initial “variable-cost” estimates
gave way to firm- or fixed-cost commercial proposals that were many-fold higher because the vendor
bore some or all of the price risk. No country has demonstrated a nuclear learning curve. Even
France’s last plant was 3.5 times costlier and nearly twofold slower than its first.

Finally, innovation and mass production, not giant units, are making nuclear power’s renewable
competitors inexorably cheaper—wind turbines by one-fifth since 2007 (they now beat new nuclear
costs by two- to threefold) and solar by half. In spring 2009, a standard crystalline-silicon
photovoltaic (PV) module cost $4.20 per peak watt, today it is $1.70; its forward pricing is $1.35 for
the end of 2011 and $1.00 for mid-2012. (The other half of today’s utility-scale PV installations, the

M. Schneider, A. Froggatt, S. Thomas         World Nuclear Industry Status Report 2010-2011            4
non-module “balance of system” cost, is also in the process of being halved.) No wonder “micropow-
er”—CHP (cogeneration) plus renewables minus large hydropower—generated about 91 percent of
the world’s new electricity in 2008.

In 2010, all renewables excluding large hydro received $151 billion of global private investment
(nuclear got none) and surpassed nuclear power’s total global installed capacity. Within a few years,
they will exceed its output. Just new solar power that is buildable sooner than one new reactor would
outproduce and outcompete all 64 reactors that are currently under construction. The renewable
revolution already happened—yet the nuclear industry still doesn’t even acknowledge renewables as a
realistic competitor, claiming that wind and solar power’s variability disqualify these burgeoning
sources as unreliable. Just the opposite is true: they actually improve energy security and reliability
more than nuclear power ever could.

All power plants fail. When nuclear or coal plants fail—6–7 percent of the time without warning and
another 4–7 percent predictably—a billion watts vanish in milliseconds, often for weeks or months.
Physics makes suddenly stopped nuclear plants particularly hard to restart: when nine plunged from
100 percent to 0 percent output in the U.S. Northeast’s blackout of 2003, they were idled for days and
took two weeks to restore fully.

Fortunately, utility engineers have cleverly designed the grid so all these intermittent (unpredictably
failing) power stations back each other up. Variable renewables can do the same but fail more
gracefully. Achieving equal or better reliability even with 80–90 percent variable renewables takes
five steps: Diversify wind and solar by location (seeing different weather) and by type (responding
differently); forecast them; add other renewables that are dispatchable at need (small hydro,
geothermal, biomass/waste, solar-thermal-electric, etc); and integrate them with flexible demand and
supply. Four German states’ 2010 electricity was thus 43–52 percent powered by wind. Denmark is
one-fifth wind powered and has Europe’s most reliable electricity at its lowest pretax prices.

Just as computing no longer needs mainframes, electricity no longer needs giant power plants. A
diverse portfolio of mass-produced generators networked in microgrids can be as resilient as the
Internet, so the Pentagon prefers them. Onsite and local generation even bypass the 98–99 percent of
power failures that originate in the grid. As shown in detail in the Rocky Mountain Institute’s
Reinventing Fire (Chelsea Green, autumn 2011), nuclear power is neither economic nor necessary to
eliminate U.S. use of oil and coal (and reduce natural gas use) by 2050, led by business for profit,
without carbon pricing or new national laws.

Yet it is now China, not America or Europe, that leads the global revolution in renewable energy.
China is now #1 in five renewable technologies and aims to be in all. Thanks to private enterprise,
China passed its 2020 wind power target in 2010, and India has more wind power than nuclear power.
China’s 2006 renewables (excluding large hydro) had seven times nuclear’s capacity and were
growing sevenfold faster; by 2010 that gap had widened despite the world’s most ambitious nuclear
program.

The facts documented in this report make crystal clear that long before Fukushima, nuclear power was
dying of an incurable attack of market forces. The industry had long ago created the mythology that
only the 1979 Three Mile Island accident halted previous U.S. nuclear orders; in fact, they’d ceased
more than a year earlier. No doubt the next myth will be that Fukushima halted nuclear power’s
renaissance. Readers of this report will find that the renaissance itself had already fizzled over the
several preceding years.

Nuclear power’s latest failure to thrive despite the most lavish and ever-increasing taxpayer support is
actually an unequivocal blessing. For four decades we have known that modern energy systems could
threaten civilization in two ways—climate change and nuclear proliferation—so we must reject both
fates, not trade one for the other. Yet new nuclear build worsens both problems. It provides do-it-
yourself bomb kits in civilian disguise. It reduces and retards climate protection by saving 2–10 times

M. Schneider, A. Froggatt, S. Thomas         World Nuclear Industry Status Report 2010-2011            5
less carbon per dollar—and 20–40 times more slowly—than the superior low- and no-carbon
competitors that are soundly beating it in the global marketplace. But taking economics seriously and
buying those cheaper options instead can protect climate, peace, and profits.

Since new nuclear build is uneconomic and unnecessary, we needn’t debate whether it’s also
proliferative and dangerous. In a world of fallible and malicious people and imperfect institutions, it’s
actually both. But even after 60 years of immense subsidies and devoted effort, nuclear power still
can’t clear the first two hurdles: competitiveness and need. End of story.

Amory B. Lovins
Old Snowmass, Colorado, U.S.A.
April 17, 2011

Physicist Amory B. Lovins is Chairman and Chief Scientist of Rocky Mountain Institute (www.rmi.org) and an
advisor to major firms and governments worldwide. This Foreword is adapted from an essay first published
online by The Economist in April 2011.

M. Schneider, A. Froggatt, S. Thomas          World Nuclear Industry Status Report 2010-2011             6
Executive Summary


Four weeks after the beginning of the nuclear crisis on Japan’s east coast, the situation at the
country’s Fukushima Daiichi power plant remains far from stabilized. The damaged reactors continue
to leak radioactivity, and although it is impossible to predict the overall impact of the disaster, the
consequences for the international nuclear industry will be devastating.

The present World Nuclear Industry Status Report 2010–2011 was to be published at the occasion of
the 25th anniversary of the Chernobyl disaster in Ukraine. The report provides the reader with the
basic quantitative and qualitative facts about nuclear power plants in operation, under construction,
and in planning phases throughout the world. It assesses the economic performance of past and
current nuclear projects and compares their development to that of leading renewable energy sources.
An extensive annex provides a country-by-country analysis of nuclear programs around the world.

The report also includes the first published overview of reactions to the catastrophe in Japan. But
developments even prior to March 11, when the Fukushima crisis began, illustrate that the
international nuclear industry has been unable to stop the slow decline of nuclear energy. Not enough
new units are coming online, and the world’s reactor fleet is aging quickly. Moreover, it is now
evident that nuclear power development cannot keep up with the pace of its renewable energy
competitors.

Annual renewables capacity additions have been outpacing nuclear start-ups for 15 years. In the
United States, the share of renewables in new capacity additions skyrocketed from 2 percent in 2004
to 55 percent in 2009, with no new nuclear coming on line. In 2010, for the first time, worldwide
cumulated installed capacity of wind turbines (193 gigawattsa), small hydro (80 GW, excluding large
hydro) biomass and waste-to-energy plants (65 GW), and solar power (43 GW) reached 381 GW,
outpacing the installed nuclear capacity of 375 GW prior to the Fukushima disaster. Total investment
in renewable energy technologies has been estimated at $243 billion in 2010.

As of April 1, 2011, there were 437 nuclear reactors operating in the world—seven fewer than in
2002. The International Atomic Energy Agency (IAEA) currently lists 64 reactors as “under
construction” in 14 countries. By comparison, at the peak of the industry’s growth phase in 1979,
there were 233 reactors being built concurrently. In 2008, for the first time since the beginning of the
nuclear age, no new unit was started up, while two were added in 2009, five in 2010, and two in the
first three months of 2011b. During the same time period, 11 reactors were shut down.c

In the European Union, as of April 1, 2011, there were 143 reactors officially operationald, down from
a historical maximum of 177 units in 1989.

In 2009e, nuclear power plants generated 2,558 terawatt-hours (TWh) of electricity, about 2 percent
less than the previous year. The industry’s lobby organization the World Nuclear Association
headlined “another drop in nuclear generation”—the fourth year in a row. The role of nuclear power
is declining steadily and now accounts for about 13 percent of the world’s electricity generation and
5.5 percent of the commercial primary energy.


a
  1 gigawatt = 1,000 megawatts
b
  This figure includes the Chasnupp-2 reactor that was connected to the Pakistani grid on 14 March 2011, which did not
receive any media coverage.
c
  Including six Fukushima reactors.
d
  Including seven units that the German government ordered to be shut down after the Fukushima crisis started and that are
unlikely to come back on line after a three-month moratorium expires.
e
  The 2010 figure is not yet available.

M. Schneider, A. Froggatt, S. Thomas                                                                                                                                                                                                                     World Nuclear Industry Status Report 2010-2011   7
In 2010, 16 of the 30 countries operating nuclear power plants (one fewer than in previous years due
to the closure of the last reactor in Lithuania) maintained their nuclear share in electricity generation,
while nine decreased their share and five increased their share.a

The average age of the world’s operating nuclear power plants is 26 years. Some nuclear utilities
envisage reactor lifetimes of 40 years or more. Considering that the average age of the 130 units that
already have been closed is about 22 years, the projected doubling of the operational lifetime appears
rather optimistic. One obvious effect of the Fukushima disaster is that operating age will be looked at
in a quite different manner, as illustrated by the German government’s decision to suspend operation
of all reactors over 30 years old immediately following the start of the crisis.

One scenario in this report assumes an average lifetime of 40 years for all operating and in-
construction reactors in order to estimate how many plants would be shut down year by year. This
makes possible an evaluation of the minimum number of plants that would have to come on line over
the coming decades to maintain the same number of operating plants. In addition to the units under
construction, leading to a capacity increase of 5 GW (less than the seven German units currently off
line), 18 additional reactors would have to be finished and started up prior to 2015. This corresponds
to one new grid connection every three months, with an additional 191 units (175 GW) over the
following decade—one every 19 days. This situation has changed little from previous years.

Achievement of this 2015 target is simply impossible given existing constraints on the manufacturing
of key reactor components—aside from any post-Fukushima effect. As a result, even if the installed
capacity level could be maintained, the number of operating reactors will decline over the coming
years unless lifetime extensions beyond 40 years become the widespread standard. The scenario of
generalized lifetime extensions is getting less likely after Fukushima, as many questions regarding
safety upgrades, maintenance costs, and other issues would need to be more carefully addressed.

With extremely long lead times of 10 years and more, it will be practically impossible to maintain, let
alone increase, the number of operating nuclear power plants over the next 20 years. The flagship
EPR project at Olkiluoto in Finland, managed by the largest nuclear builder in the world, AREVA
NP, has turned into a financial fiasco. The project is four years behind schedule and at least 90 percent
over budget, reaching a total cost estimate of €5.7 billion ($8.3 billion) or close to €3,500 ($5,000) per
kilowatt.b

The dramatic post-Fukushima situation adds to the international economic crisis and is exacerbating
many of the problems that proponents of nuclear energy are facing. If there was no obvious sign that
the international nuclear industry could eventually turn empirically evident downward trend into a
promising future, the Fukushima disaster is likely to accelerate the decline.


a
 Based on the most recent figures available.
b
 In this report, conversions from Euros to U.S. Dollars were performed on 22 April 2011 using the exchange rate of 1 Euro
= 1.5 U.S. Dollars.

M. Schneider, A. Froggatt, S. Thomas                                                                                                                                                                                                                     World Nuclear Industry Status Report 2010-2011   8
Introduction
                                                                                                                                                                                                                                                                  “We can’t afford to have the Chinese have an accident,
                                                                                                                                                                                                                                                         something like Chernobyl, which would really set you way back.”

                                                                                                                                                                                                                                                                                                       Charles Newstead
                                                                                                                                                                                                                                                                                Senior Advisor, U.S. Department of State
                                                                                                                                                                                                                                                                                  Brookings Institution, 13 October 2010


The accident came where few expected it to happen. On 11 March 2011, triggered by the largest
earthquake in the nation’s history, a nuclear catastrophe of yet unknown proportions started unfolding
in the world’s preeminent high-tech country: Japan. “At [the Fukushima Daiichi plant], four reactors
have been out of control for weeks—casting doubt on whether even an advanced economy can master
nuclear safety.... We believe the Fukushima accident was the most serious ever for the credibility of
nuclear power.” This is how analysts at Swiss-based investment bank UBS summarized the likely
global impact of the tragic developments on Japan’s east coast in a report dated 4 April 2011.1a

Television viewers around the world witnessed massive hydrogen explosions that devastated reactor
buildings and spent fuel pools. The result was large-scale fuel damage, partial meltdown in at least
three reactors, and broken fuel elements in what remains of unit four’s spent fuel pool. Helpless
operators tried desperately to cool reactors and spent fuel with fire hoses and cement trucks, but short-
term responses turned into long-term nightmares. The injection of large amounts of seawater into the
reactor cores led to the accumulation of large volumes of salt at the bottom of the pressure vessels.
The salt crystallizes on hot surfaces to form a hard, insulating layer that prevents the fuel from being
cooled. Salt crystals will likely also hinder the operation of valves.

At the same time, the huge quantities of water that were injected and sprayed onto the reactors—an
estimated 100 cubic meters per hour—became severely contaminated and must be collected
somehow. The problem was so acute that the operator decided to discharge water with “lower”
contamination levels into the sea to provide space for more highly affected water. In an unprecedented
confrontation broadcasted by Japanese television, the Chairman of the National Fisheries Union told
the chairman of Fukushima owner TEPCO: “You’ve trampled on the nation-wide efforts of fishery
operators.... Despite our strong demand to cease the flow of contaminated water into the ocean as
soon as possible, just a few hours later [more] water was dumped without consulting us—you pushed
through. We were really ignored. We wonder if you had ever heard us. This is an affront to us and
truly an unforgivable act.”2

After four weeks of uncertainty and a constantly worsening outlook, the nerves of some of Japan’s
seemingly endlessly patient people are raw. Tens of thousands of evacuees are waiting for clear
information about when—if ever—they can return home. Dogs and cows that were left behind wander
along empty roads. Measurements in schools as far as 40 kilometers from the Fukushima plant show
extremely high levels of radiation well outside the 20-kilometer (later 30-kilometer) evacuation zone.
People don’t know what they can safely eat or drink.

Although the accident scenario is different and the people speak a different language, much of the
Japanese drama calls to minds an event that took place on the European continent exactly 25 years
prior. On 26 April 1986, a hydrogen explosion followed by a power excursion (a massive liberation of
energy)b entirely destroyed unit four of the nuclear power plant in Chernobyl, Ukraine, then part of
the Soviet Union. For over a week, the burst-open reactor was burning, sending large amounts of
radioactivity into the sky and across Europe.


a
        Endnotes are grouped by section and begin on page 75.
b
        It has been estimated that the reactor reached about 100 times its nominal capacity within four seconds.

M. Schneider, A. Froggatt, S. Thomas                                                                                                                                                                                                                      World Nuclear Industry Status Report 2010-2011               9
Twenty-five years after what former Soviet President Mikhail Gorbachev now calls “one of the worst manmade disasters of the twentieth century,” the consequences remain visible. The cost to human health, the environment, and the economies of the three former Soviet republics of Ukraine, Belarus, and Russia—the regions that experienced the greatest exposure from Chernobyl—has left deep scars.3 Chernobyl is still present in Western Europe, too. In October 2009, the Council of Ministers of the European Union decided to extend by at least 10 years the monitoring system for potentially contaminated food. In the United Kingdom, more than 150,000 sheep that were raised on contaminated pastures remain under slaughter restriction; they have to be moved to “clean” fields for a few months until the radioactivity levels in the meat drop below legal limits. In 2006, 18 Norwegian municipalities newly restricted the raising of sheep after the meat was found to be contaminated at seven times above EU limits. And in Germany, radioactive mushrooms still lead to the ban of contaminated game meat like wild boar. Yet for the most part, Chernobyl and its horrific consequences appear to be forgotten, downplayed, and ignored. In December 2010, the oldest Ukrainian reactor, Rovno-1, was granted a 20-year lifetime extension, and by 2030 the country projects a doubling of the installed nuclear capacity. Belarus plans to enter into an agreement with Russia to build its first nuclear power plant.4 And Russia has officially 11 reactors under construction, the second largest number in the world behind China. Prior to the events in Japan, it appeared that the international nuclear industry had successfully overcome the “Chernobyl syndrome.” According to the International Atomic Energy Agency (IAEA), “some 60 countries have turned to the IAEA for guidance” as they consider introducing nuclear power. One IAEA expert estimates that “probably 11 or 12 countries...are actively developing the infrastructure for a nuclear power program.”5 Today, there are more units under construction worldwide now than in any year since 1988 (except for 2010), and 13 more than at the beginning of 2010. Fifteen new building sites were initiated in 2010—more than in any year since the pre-Chernobyl year of 1985, which saw 20 construction starts. Is this, finally, what the industry has been calling for a decade the “nuclear renaissance”? Or is the phenomenon limited to only some countries, with China alone counting for 60 percent of the new projects?6 How do new grid connections compare with plant life extensions? And what are the latest economic trends of the nuclear option? These are questions that the World Nuclear Industry Status Report analyzed in the previous (2009) edition published by the German government and analyzes in the present version.7 The first World Nuclear Industry Status Report was released in 1992—nearly 20 years ago—by the Worldwatch Institute, Greenpeace International, and WISE-Paris. Today—the year 2011—is a timely undertaking to assess where the industry is standing. The 25th anniversary of Chernobyl—“a horrible event” (in the words of Mikhail Gorbachev)8 that disrupted the revival of an industry that had barely overcome the shock of the Three-Mile-Island meltdown in 1979—comes just one month after the start of Japan’s Fukushima disaster. In addition to describing the state of the industry today, the report provides the first country-by-country assessment of the effects of Fukushima on the industry and an outlook that compares nuclear power to its main competitor: decentralized renewable energy. M. Schneider, A. Froggatt, S. Thomas World Nuclear Industry Status Report 2010-2011 10
General Overview Worldwide
“Another Drop in Nuclear Generation.”
World Nuclear News
Headline on 5 May 20109
As of 2010, a total of 30 countries were operating nuclear fission reactors for energy purposes—one
fewer than in previous years. Lithuania became the third country ever to revert to “non-nuclear
energy” status, following Italy, which abandoned nuclear power after Chernobyl, and Kazakhstan,
which shut down its only reactor in 1999.
Nuclear power plants generated 2,558 Terawatt-hours (TWh or billion kilowatt-hours) of electricity in
2009.10a World nuclear production fell for the third year in a row, generating 103 TWh (nearly 4
percent) less power than in 2006. This decline corresponds to more than the domestic annual nuclear
generation in four-fifths of the nuclear power countries. The gap between the public’s perception of
an increasing role for nuclear power and reality seems to be widening.
The main reasons for nuclear’s poor global performance are linked to technical problems with the
reactor fleets of larger nuclear players, with the small producers remaining more or less stable.
Between 2008 and 2009, nuclear generation declined in four of the “big six” countries—France,
Germany, South Korea, and the United States. In Japan, the industry had been slowly recovering from
the 2007 Kashiwasaki earthquake, and in Russia, production remained stable. These six countries
generate nearly three-quarters (73 percent in 2009) of the world’s nuclear electricity, a share that
increased in 2009. In 2010, the nuclear role of four of the “big six” remained stable while two
(Germany and South Korea) declined.
Many countries are now past their nuclear peak. The three phase-out countries (Italy, Kazakhstan, and
Lithuania) and Armenia generated their historical maximum of nuclear electricity in the 1980s.
Several other countries had their nuclear power generation peak in the 1990s, among them Belgium,
Canada, Japan, and the UK). And seven additional countries peaked between 2001 and 2005:
Bulgaria, France, Germany, India, South Africa, Spain, and Sweden.
Among the countries with a remarkably steady increase in nuclear generation are China, the Czech
Republic, Romania, Russia and the United States (except for 2009 when production dropped by
almost 10 TWh). Considering the size of the U.S. program, the rather continuous improvement of the
load factor is impressive (88 percent in 2009). 11 Russia is also generally on an upward trend
(78.3 percent), and South Korea is fluctuating at a very high level (90.3 percent). France (at a
70.6 percent load factor), Japan (66.2 percent), and Germany (69.5 percent), which are already on the
lower end of the performance indicator, for varying reasons, have exhibited a further downward trend
over the past few years.12
Overview of Operation, Power Generation, Age Distribution
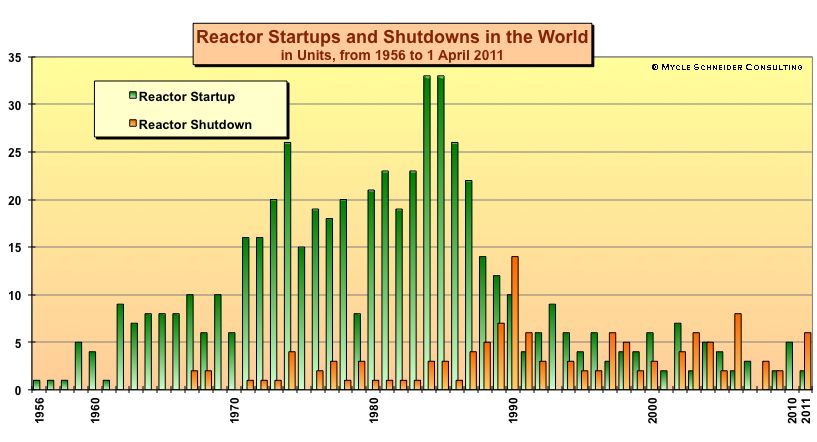
There have been two major waves of grid connections since the beginning of the commercial nuclear
age in the mid-1950s.13 (See Figure 1.) A first wave peaked in 1974, with 26 reactor startups. The
second wave occurred in 1984 and 1985, the years preceding the 1986 Chernobyl accident, reaching
the historical record of 33 grid connections in each year. By the end of the 1980s, the uninterrupted
net increase of operating units had ceased, and in 1990 for the first time the number of reactor
shutdowns outweighed the number of startups.
a
The 2010 figure is not available yet.
M. Schneider, A. Froggatt, S. Thomas World Nuclear Industry Status Report 2010-2011 11Figure 1. Nuclear Power Reactor Grid Connections and Shutdowns, 1956–2011
Source: IAEA-PRIS, MSC, 2011
As of April 1, 2011, a total of 437 nuclear reactors were operating in 30 countries, down seven from
the historical maximum of 444 in 2002. Since then, 25 units were started up and 32 were disconnected
from the grid, including six units at the Fukushima plant in Japan. These are very conservative
numbers since it is unlikely that the seven units that have been “provisionally” shut down in Germany
following the Fukushima events will ever start up again.
The current world reactor fleet has a total nominal capacity of about 370 gigawatts (GW or thousand
megawatts).14 (See Figure 2 and Annex 2 for details.)
Figure 2. World Nuclear Reactor Fleet, 1954–2011
Source: IAEA-PRIS, MSC, 2011
M. Schneider, A. Froggatt, S. Thomas World Nuclear Industry Status Report 2010-2011 12The world installed nuclear capacity has decreased three times since the beginning of the commercial
application of nuclear fission—in 1998, 2008, and 2009; in 2010, it increased by 5.5 GW. Despite
seven fewer units operating in 2011 compared to 2002, the capacity is still about 8 GW higher. This is
a combined effect of larger units replacing smaller ones and, mainly, technical alterations at existing
plants, a process known as “uprating.” At least 1.8 GW of the capacity increase in 2010 is due to
uprating.
In the United States, the Nuclear Regulatory Commission (NRC) has approved 135 uprates since
1977. These included, in 2009–10, 10 minor uprates between 1.4 and 1.6 percent and five “extended
uprates” of 15–20 percent. The cumulative additional approved uprates in the United States alone
total 5.8 GW. Most of these already have been implemented, and applications for an additional
4.4 GW in increases at 13 units are pending.15 A similar trend of uprates and lifetime extensions of
existing reactors can be seen in Europe. It is obvious that the main incentive for lifetime extensions is
their considerable economic advantage over new-build.
The capacity of the global nuclear fleet increased by about 3 GW annually between 2000 and 2004,
much of it through uprating. Between 2004 and 2007, however, this dropped to 2 GW annually, and
in 2008 and 2009 uprates were offset by plant closures, resulting in net declines in world nuclear
capacity of about 650 MW and 860 MW, respectively.
The use of nuclear energy has been limited to a small number of countries, with only 31 countries, or
16 percent of the 192 members of the United Nations, operating nuclear power plants in 2009.16 (See
Figure 3.) One country, Lithuania, shut down its last reactor in 2009, so that currently only
30 countries operate nuclear power plants. Half of the world’s nuclear countries are located in the
European Union (EU), and they account for nearly half of the world’s nuclear production. France
alone generates close to half of the EU’s nuclear production.
As previously noted, there was no growth in nuclear electricity generation in 2009. The 2,558 TWh of
nuclear energy produced corresponded to about 13 percent of the world’s commercial electricity.
Figure 3. Nuclear Power Generation by Country, 2009
Source: IAEA-PRIS, MSC, 2011
M. Schneider, A. Froggatt, S. Thomas World Nuclear Industry Status Report 2010-2011 13Overview of Current New Build
Currently, 14 countries are building nuclear power plants, and most of the sites are accumulating
substantial and costly delays. As of April 1, 2011, the IAEA listed 64 reactors as “under
construction,” nine more than at the end of 2009. This compares with 120 units under construction at
the end of 1987, and a peak of 233 such units—totaling more than 200 GW—in 1979. 17 (See
Figure 4.) The year 2004, with 26 units under construction, marked a record low for construction
since the beginning of the nuclear age in the 1950s.
Figure 4. Number of Nuclear Reactors under Construction
Source: IAEA-PRIS, MSC 2011
The total capacity of units now under construction is about 62.5 GW, with an average unit size of
around 980 MW. (See Annex 3 for details.) A closer look at currently listed projects illustrates the
level of uncertainty associated with reactor building:
• Twelve reactors have been listed as “under construction” for more than 20 years. The U.S. Watts
Bar-2 project in Tennessee holds the record, with an original construction start in December 1972
(subsequently frozen), followed by the Iranian Bushehr plant, which was originally started by
German company Siemens in May 1975 and is now slated to be finished by the Russian nuclear
industry. Other long-term construction projects include three Russian units, the two Belene units
in Bulgaria, two Mochovce units in Slovakia, and two Khmelnitski units in Ukraine. The
construction of the Argentinian Atucha-2 reactor started 30 years ago. In addition, two Taiwanese
units at Lungmen have been listed for 10 years.
• Thirty-five projects do not have an official (IAEA) planned start-up date, including six of the
11 Russian projects, the two Bulgarian reactors, and 24 of the 27 Chinese units under
construction.
• Many of the units listed by the IAEA as “under construction” have encountered construction
delays, most of them significant. The remaining units were started within the last five years and
have not reached projected start-up dates yet. This makes it difficult or impossible to assess
whether they are running on schedule.
M. Schneider, A. Froggatt, S. Thomas World Nuclear Industry Status Report 2010-2011 14• Nearly three-quarters (47) of the units under construction are located in just four countries: China,
India, Russia, and South Korea. None of these countries has historically been very transparent or
reliable about information on the status of their construction sites.
The geographical distribution of nuclear power plant projects is concentrated in Asia and Eastern
Europe, extending a trend from earlier years. Between 2009 and April 1, 2011, a total of nine units
were started up, all in these two regions.
Lead times for nuclear plants include not only construction times but also long-term planning, lengthy
licensing procedures in most countries, complex financing negotiations, and site preparation. In most
cases the grid system also has to be upgraded—often using new high-voltage power lines, which bring
their own planning and licensing difficulties. In some cases, public opposition is significantly higher
for the long-distance power lines that move the electricity than for the nuclear generating station
itself. Projected completion times should be viewed skeptically, and past nuclear planning estimates
have rarely turned out to be accurate.
Past experience shows that simply having an order for a reactor, or even having a nuclear plant at an
advanced stage of construction, is no guarantee for grid connection and power supply. French Atomic
Energy Commission (CEA) statistics on “cancelled orders” through 2002 indicate 253 cancelled
orders in 31 countries, many of them at an advanced construction stage. (See also Figure 4.) The
United States alone accounts for 138 of these cancellations.18 Many U.S. utilities suffered grave
financial harm because of reactor-building projects.
In the absence of any significant new build and grid connection over many years, the average age
(since grid connection) of operating nuclear power plants has been increasing steadily and now stands
at about 26 years.a Some nuclear utilities envisage average reactor lifetimes of beyond 40 years and
even up to 60 years. The OECD’s World Energy Outlook 2010 recently gave a timeframe of 45–55
years, up five years from the 2008 edition of the report.
In the United States, reactors are usually licensed to operate for a period of 40 years. Nuclear
operators can request a license renewal for an additional 20 years from the Nuclear Regulatory
Commission. More than half of operating U.S. units have received this extension. Many other
countries, however, have no time limitations to operating licenses. In France, where the country’s first
operating PWR started up in 1977, reactors must undergo an in-depth inspection and testing every
decade. The French Nuclear Safety Authority (ASN) evaluates on a reactor-by-reactor basis whether a
unit can operate for more than 30 years. At this point, ASN considers the issue of lifetimes beyond
40 years to be irrelevant, although the French utility EDF has clearly stated that, for economic
reasons, it plans to prioritize lifetime extension over massive new build.
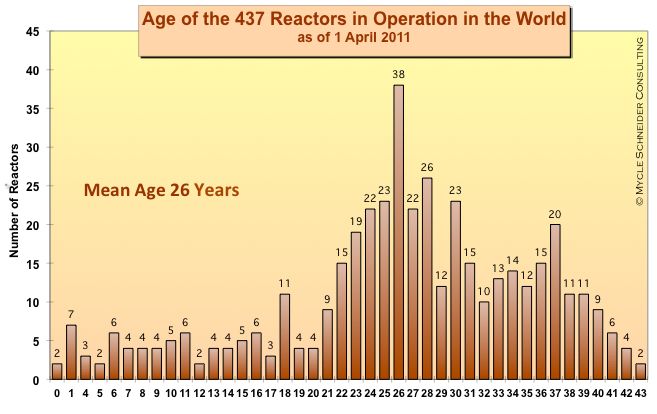
In assessing the likelihood of reactors being able to operate for up to 60 years, it is useful to compare
the age distribution of reactors that are currently operating with those that have already shut down.19
(See Figures 5 and 6.) At present, 12 of the world’s operating reactors have exceeded the 40-year
mark.b As the age pyramid illustrates, that number will rapidly increase over the next few years. Nine
additional units have reached age 40 in 2011, while a total of 165 units have reached age 30 or more.
The age structure of the 130 units already shut down confirms the picture. In total, 32 of these units
operated for 30 years or more; and within that subset, 16 reactors operated for 40 years or more. (See
Figure 6.) The majority of these were Magnox reactors located in the U.K., most of which had been
used to generate weapons-grade plutonium. These were all small reactors (50–225 MW) that had
operated with very low burn-up fuel, and therefore are not comparable to large 900 MW or 1,300 MW
commercial reactors that use high burn-up fuel that generates significantly more stress on materials.
a
Here, reactor age is calculated from grid connection to final disconnection from the grid. In this report, “startup” is
synonymous with grid connection and “shutdown” with withdrawal from the grid.
b
We count the age starting with grid connection, and figures are rounded by half years.
M. Schneider, A. Froggatt, S. Thomas World Nuclear Industry Status Report 2010-2011 15While many units of the first generation have operated for only a few years or less, even the operating
experience beyond 30 years is very limited. And considering that the average age of the 130 units that
have already shut down is about 22 years, plans to nearly double the operational lifetime of large
numbers of units seem rather optimistic.
Figure 5. Age Distribution of Operating Nuclear Reactors, 2011
Sources: IAEA-PRIS, MSC, 2011
Figure 6. Age Distribution of Shutdown Nuclear Reactors, 2011
Sources: IAEA-PRIS, MSC, 2011
M. Schneider, A. Froggatt, S. Thomas World Nuclear Industry Status Report 2010-2011 16After the Fukushima disaster, it is obvious that operating age will get a second look. The troubled
Fukushima-I units (1 to 4) were initially connected to the grid between 1971 and 1974. The license
for unit 1 was extended for another 10 years only in February 2011. Four days after the beginning
of the drama in Japan, the German government ordered the shutdown (for a three-month period) of
seven reactors that had started up before 1981. It is increasingly clear that the political climate in
Germany makes a restart of these reactors highly unlikely. Other countries might follow in a less
dramatic manner, but it is obvious that recent events are having an impact on previously assumed
extended lifetimes.
For the purposes of capacity projections, we have still assumed an average lifetime of 40 years for
operating reactors, with a few adjustments. To remain conservative, we have considered, for
example, that all 17 German units will be operated according to the current German legislation
with remaining lifetimes between 8 and 14 years.20 Similarly, there are several individual cases
where earlier shutdowns have been officially decided.21 (See Figure 7.)
Figure 7. The 40-Year Lifetime Projection
Sources: IAEA-PRIS, WNA, MSC 2011
The lifetime projections make possible an evaluation of the number of plants that would have to come
on line over the next decades to offset closures and maintain the same number of operating plants.
Besides 56 units under construction as of April 1, 2011a, and while capacity would increase by 5 GW
(less than the seven German units currently off line), 18 additional reactors would have to be finished
and started up prior to 2015. This corresponds to one new grid connection every three months, with an
additional 191 units (175 GW) over the following 10-year period—one every 19 days. This situation
has hardly changed from previous years
Achievement of the 2015 target is simply impossible given existing constraints on the fabrication of
key reactor components—aside from any post-Fukushima effect. As a result, the number of reactors
in operation will decline over the years to come (even if the installed capacity level could be
maintained) unless lifetime extensions beyond 40 years become a widespread standard. The scenario
of generalized lifetime extensions is getting even less likely after Fukushima, as many questions
regarding safety upgrades, maintenance costs, and other issues would need to be much more carefully
a
Under the present scenario, 8 of the 64 units currently listed as under construction will enter operation after 2015.
Respective start-up dates have been compiled by MSC.
M. Schneider, A. Froggatt, S. Thomas World Nuclear Industry Status Report 2010-2011 17You can also read