ON THE MARRIAGE WAGE PREMIUM - BRENDON MCCONNELL UNIVERSITY OF SOUTHAMPTON ARNAU VALLADARES-ESTEBAN
←
→
Page content transcription
If your browser does not render page correctly, please read the page content below
On the Marriage Wage Premium∗
                                          Brendon McConnell†
                                         University of Southampton

                                       Arnau Valladares-Esteban‡
             University of St. Gallen and Swiss Institute for Empirical Economic Research

                                              March 8, 2021

                                                  Abstract

           We use a novel instrument based on local social norms towards marriage to present
       a new finding: being married has a positive causal effect on the wages of both men and
       women. Despite the striking changes in the labor market and the composition of families
       that occurred over the past decades, the positive effect of marriage on the wages of men has
       remained largely unchanged. Conversely, while marriage decreased the wages of women until
       the 1980s, we document the emergence of a causal positive effect from the mid-2000s onward.
       The main hypotheses discussed in the literature to explain the positive relationship between
       being married and the wages of men rely on the idea that married men are able to devote
       more resources to their careers than their single counterparts because their wives specialize
       in home work. The fact that marriage also increases the wages of women challenges these
       explanations.

Keywords— Wage, Marriage, Gender, Causal Inference, Marriage Wage Premium.
JEL Codes— J11, J12, J16, J30.
   ∗
     We thank Effrosyni Adamopoulou, Alex Armand, Libertad González, Nezih Guner, Ezgi Kaya, Michael
Knaus, Michael Lechner, Attila Lindner, Joan Llull, Shelly Lundberg, Jaime Millán-Quijano, Richard Murphy,
Imran Rasul, Anna Raute, and seminar participants at the Berlin Applied Micro Seminar, the Swiss Macro
Workshop, the University of Bristol, the University of Nottingham, the University of St. Gallen, the University
of York, and the Online Discrimination and Disparities Seminar for valuable comments. All errors are ours.
   †
     b.i.mcconnell@soton.ac.uk.
   ‡
     arnau.valladares@gmail.com.

                                                      1
1 Introduction
Over the past decades, the United States, along with many other countries, has experienced a remarkable
shift in the structure of families and the role of women. If one looks at this transformation from the
perspective of the family, the patterns of marriage, divorce, fertility, and assortative mating have all
dramatically changed.1 Placing the lens on gender, the labor market outcomes of women have also
evolved significantly. From labor force participation to wages, a wide range of indicators show that the
economic role of women in the labor market is more prominent now than ever before.2 One aspect of
this transformation that has received little attention is the evolution of the relationship between wages
and being married.3 While some authors document that married men earn higher wages than their single
counterparts, the so-called Marriage Wage Premium (MWP), there is much less work on this relationship
for women.4
We use Current Population Survey (CPS) data from 1977 to 2018 to show that, while until the mid
1980s being married causally led to a wage penalty for women, since the mid 2000s there has been a
marriage wage premium. Interestingly, the causal effect of marriage on the wages of men has remained
markedly stable over the same period. The MWP for women is crucial to understand the secular changes
that have taken place over the past decades. A large portion of the changes in the economic role of women
are, in fact, a reflection of the transformation in the economic role of married women. For example, most
of the increase in female labor force participation that occurred after the Second World War can be
accounted for by the growth in the employment of married women. Hence, it is crucial to analyze the
relationship between wages and marriage in order to understand the social transformation of the past
decades. Moreover, the theories that have been proposed to explain the MWP for men often rely on
intra-household arguments. In particular, the literature considered the hypothesis that the origin of the
MWP of men is related to within-household specialization.5 The underlying idea is that married men are
able to devote more resources to their careers than their single counterparts because their wives specialize
in home production. However, the fact that being married causally increases the wages of both women
and men in recent years is at odds with this hypothesis.6
Establishing a causal effect of marriage on wages presents three main challenges.7 First, for women,
there is a sizable part of the population that does not participate in employment. The underlying economic
decision that generates this outcome implies that the sample of women for whom we observe wages is
not a random draw from the population. Hence, the estimated coefficients in the wage equation might
suffer sample-selection bias. Second, there may be unobservable variables that affect both the propensity
to be married and wages. That is, the estimated coefficients on being married in the wage equation may
suffer from omitted-variable bias. Third, there may be an issue of reverse causality if wages also affect
the probability of being married. In our main specification, we tackle all three issues simultaneously by
1
See Lundberg and Pollak (2007) and Greenwood, Guner, and Vandenbroucke (2017).
2
There is a vast literature studying the evolution of the labor market outcomes of women. See Attanasio, Low,
and Sánchez-Marcos (2008), Blau and Kahn (2007, 2017), Goldin (2014), Fernández (2013), and Olivetti (2006).
3
Some authors study the relationship between marriage and other outcomes. For example, Choi and Valladares-
Esteban (2018, 2020) or Guner, Kulikova, and Llull (2018).
4
See Hill (1979), Korenman and Neumark (1992), Loughran and Zissimopoulos (2009), Ginther and Sundström
(2010), Juhn and McCue (2016, 2017), and Pilossoph and Wee (2019).
5
See Korenman and Neumark (1991), Loh (1996), Cornwell and Rupert (1997), Ginther and Zavodny (2001),
Stratton (2002), Antonovics and Town (2004), Krashinsky (2004), Ahituv and Lerman (2007), Bardasi and Taylor
(2008), and Killewald and Gough (2013).
6
Another hypothesis discussed in the literature poses that the MWP for men might be generated or amplified
by positive employer statistical discrimination. The idea is that employers might believe that marriage is positively
associated with some determinants of productivity which are hard to observe and use marriage as a proxy for
those instead. In Appendix E, we adapt the approaches of Altonji and Pierret (2001) and Pinkston (2009) to the
case of marriage and show that statistical discrimination is not a relevant mechanism behind the marriage wage
premium of women and men.
7
Some authors analyze other aspects related to the relationship between marriage and wages. See Gray (1997)
and Maasoumi, Millimet, and Sarkar (2009).
2combining a Heckman (1979) sample-selection correction with a novel instrument for marriage based on
local social norms.8
To systematically proxy local social norms towards marriage, we use the share of married people
who have the same gender, live in the same state, and have the same values for the indicators of college
education and children, but are 6 to 15 years older than any given individual in our analysis. In order to
validate what the instrument captures, we use the General Social Survey (GSS) to measure the stances on
marriage, religious affiliation, and political preferences across time, geographical divisions, and education
levels, for all years with available data. The instrument presents a high positive correlation with favorable
views on marriage and religious affiliation, while it is not a good predictor of political and policy stances.9
We provide extensive evidence to support each of the identifying assumptions underlying the instru-
mental variable approach. Moreover, we comprehensively assess the consequences of a potential violation
to the exclusion restriction for our estimates and the inference we draw from them. The main challenge
to the exclusion restriction is that the instrument might not only capture social norms towards marriage
but also traditional gender norms, which can directly affect wages. The only plausible effect of traditional
gender norms on wages is that of increasing the wages of men, which implies that our estimates are up-
ward biased, while reducing those of women, a downward bias. For women, the existence of a downward
bias does not substantially change the main interpretation derived from our results. A downward bias
implies that the marriage penalty in the 1980s might have been smaller, the marriage premium could
have emerged sooner, and it’s likely to be even larger nowadays. In the case of men, if there exists an
upward bias in our estimates it suggests that the effect of marriage on wages may not be as large as the
coefficients indicate. To systematically evaluate the effects of violations to the exclusion restriction, we
use the plausibly exogenous method of Conley, Hansen, and Rossi (2012) and the imperfect instrumental
variable approach of Nevo and Rosen (2012). Both procedures confirm that the key patterns derived
from our results —the emergence of a premium for women and the sustained existence of a premium for
men— are robust to wide-ranging violations of the exclusion restriction.
These key patterns are also robust to a number of different deviations from our main specification. In
particular, we show that the causal positive effect of being married on the wages of men and, nowadays,
also on the wages of women holds when we relax the definition of the non-married group to include
divorced and separated individuals, when adding industry and/or occupation covariates, and when con-
trolling for state-by-year fixed effects. That is, our results are robust to the different trends in marital
outcomes across space and time.
We present evidence that the effect of marriage on wages is notably different across the distribution
of wages. For men, the MWP trends downward along the wage distribution. That is, for men at the
lower end of the wage distribution the effect of marriage on their wages is larger than for men at the
top. In the late 1970s and early 1980s this pattern was especially pronounced while it has flattened
over time. In recent years, the MWP of men is fairly similar along the wage distribution. The MWP
of women has experienced the opposite evolution over time. These patterns suggest that the within-
household-specialization channel, along with the degree of assortative mating, might have been relevant
to understand why women at the bottom of the wage distribution experienced a penalty until the early
2000s while men at the bottom enjoyed a larger premium than men at the top. However, neither the
emergence of a MWP for women at the top of the wage distribution in the early 1990s nor the current
patterns of the MWP for both genders are consistent with within-household specialization being the main
8
For women, we correct for sample-selection bias into employment using the age of the youngest child in the
household, which enables us to control for the presence of children in the wage equation. In Appendix B, we show
that our results are robust to not controlling for the presence of children in the household. That is, to consider
fertility outcomes part of marriage. In line with the existence of a fatherhood premium and a motherhood penalty,
when the presence of children is excluded from the wage regression, the effect of marriage on wages is higher for
men and smaller for women (i.e., there is a larger penalty in earlier years).
9
There is a growing literature that studies how social norms affect family outcomes. See Drewianka (2003),
Fernández and Fogli (2009), Adamopoulou (2012), Mourifié and Siow (2017), Adamopoulou and Kaya (2018),
and Vickery and Anderberg (2019).
3driver of the effect of being married on wages.
We make three key contributions. First, our analysis is the first to present causal evidence that,
nowadays, being married generates a positive effect on the wages of both men and women. We document
that, while marriage has increased the wages of men for several decades, the premium for women emerged
in recent years. The marriage wage premium is important to understand both the relationship between
the family and outcomes in the labor market, and the social transformation of the past decades. Second,
we provide evidence that the effect of marriage on wages is heterogeneous. This suggests that there may
be several mechanisms that bring about the positive effect of marriage on wages and that different people
might be impacted by different mechanisms. Third, to the best of our knowledge, there is no unifying
theory that explains the existence of the marriage premium and its evolution over the past decades. Our
paper establishes the key elements that a successful theory needs to reproduce.
The rest of the paper is organized as follows. In Section 2, we describe the data we use and the
sample restrictions we impose, as well as, presenting descriptive evidence on the relationship between
being married and wages over the past decades. In Section 3, we describe our instrument and present
the causal patterns of the effect of marriage on wages. In Section 4, we analyze the causal effect of being
married along the wage distribution. Section 5 discusses how to reconcile our results with the different
theories on the marriage wage premium. Finally, Section 6 concludes.
2 Descriptives
We use data from the March Supplement of the CPS from 1977 to 2018.10 Our sample consists of white
non-Hispanic civilians who are in their prime age (between 25 and 54 years old), not living in group
quarters, and for whom we have no missing data on relevant demographic characteristics. We further
exclude from the sample self-employed workers, individuals working in the private household sector, and
agricultural workers. The group of married individuals consists of people that declare to be married and
living with their spouse in the same household. The non-married group is composed only of never married
individuals to keep consistency with the literature on the MWP for men.11
Using the information on weeks worked last year and usual hours of work per week, we build a variable
that proxies the total number of hours worked last year for each individual on our sample. Then, we
divide non-allocated total labor income last year, expressed in 1999 US dollars, by the total number of
hours worked last year to obtain a measure of hourly wages. As it is common in the literature, we trim
the top and bottom 1% of our measure of hourly wages to limit the influence of outliers. We disregard the
hourly wage measure of those individuals that report less than 100 hours of work last year and consider
them never employed last year.12 We use the Annual Social and Economic Supplement weights in all the
analysis.
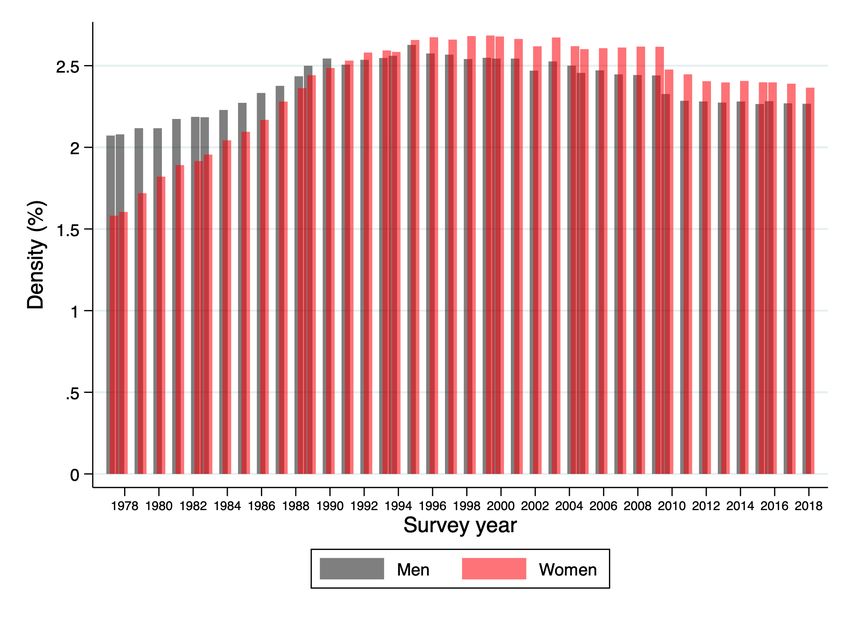
Our final sample contains 1,531,669 observations, 731,632 men and 800,037 women. Tables 1 and 2
present key descriptive statistics for men and women respectively. We divide the sample in seven-years
periods in order to study the evolution of the marriage wage premium over time. The observed patterns,
both for men and women, are consistent with well-documented trends in the US labor market during the
past decades. Namely, the decrease in the share of married individuals, the increase in female labor force
participation, the increase in educational attainment, and the reduction in the number of children.
10
The CPS data is made publicly available by Flood, King, Ruggles, and Warren (2015).
11
Separated, divorced, and widowed individuals are excluded from the sample. That is, we focus explicitly
on legally married individuals who live in the same household as their spouse. We ignore cohabitation which
is not subject to the legal and social obligations of marriage. In Appendix A, we reproduce our main analysis
using a sample in which the non-married group includes never-married, divorced, and separated individuals. The
coefficients estimated with this alternative definition of the non-married group are in line with our main results.
12
We experimented with restricting the definition of the employed to full-time full-year workers, that is, em-
ployed for at least 50 weeks in the past year for 35 or more hours per week. The key results are not substantively
different using this alternative specification.
4Table 1: Descriptive Statistics - Men
Means, Standard Deviations in Parentheses
1977- 1984- 1991- 1998- 2005- 2012-
1983 1990 1997 2004 2011 2018
Sample Size 121,172 120,080 112,404 129,390 137,634 110,952
Married 0.841 0.791 0.760 0.745 0.709 0.662
Hourly Wage (1999 Dollars) 19.81 19.29 18.40 19.63 19.81 19.81
(9.31) (9.94) (9.88) (10.71) (11.33) (11.82)
Age 37.55 37.13 38.05 39.27 39.53 39.10
(8.83) (8.38) (8.24) (8.40) (8.78) (8.93)
Highest Level of Education:
HS Dropout 0.168 0.116 0.085 0.070 0.062 0.051
HS Graduate 0.368 0.378 0.335 0.310 0.310 0.277
Some College 0.187 0.201 0.262 0.277 0.274 0.275
College Graduate 0.150 0.171 0.209 0.238 0.243 0.269
Advanced Graduate 0.126 0.134 0.110 0.105 0.111 0.129
Number Children, 0-4 0.297 0.296 0.268 0.248 0.250 0.238
(0.592) (0.599) (0.570) (0.557) (0.562) (0.549)
Number Children, 5-17 1.12 0.898 0.842 0.828 0.788 0.753
(1.29) (1.12) (1.08) (1.08) (1.07) (1.08)
Children, 18 and over 0.160 0.141 0.129 0.127 0.122 0.114
Notes: Data used: CPS, 1977-2018.
Table 2: Descriptive Statistics - Women
Means, Standard Deviations in Parentheses
1977- 1984- 1991- 1998- 2005- 2012-
1983 1990 1997 2004 2011 2018
Sample Size 132,308 130,154 121,247 142,474 152,620 121,234
Married 0.901 0.864 0.846 0.829 0.803 0.751
Employed 0.619 0.713 0.763 0.774 0.759 0.751
Hourly Wage (1999 Dollars) 11.91 12.86 13.65 15.18 15.79 16.26
(6.25) (7.24) (8.04) (9.08) (9.55) (10.14)
Age 37.80 37.28 38.19 39.44 39.80 39.31
(8.83) (8.39) (8.22) (8.34) (8.73) (8.92)
Highest Level of Education:
HS Dropout 0.162 0.104 0.073 0.053 0.045 0.037
HS Graduate 0.475 0.447 0.362 0.305 0.262 0.219
Some College 0.173 0.205 0.275 0.295 0.295 0.283
College Graduate 0.121 0.153 0.203 0.244 0.271 0.300
Advanced Graduate 0.068 0.091 0.087 0.103 0.126 0.161
Number Children, 0-4 0.270 0.288 0.272 0.252 0.261 0.255
(0.569) (0.589) (0.570) (0.559) (0.570) (0.564)
Number Children, 5-17 1.25 1.01 0.958 0.948 0.926 0.903
(1.30) (1.13) (1.10) (1.10) (1.11) (1.12)
Children, 18 and over 0.203 0.178 0.161 0.154 0.156 0.150
Notes: Data used: CPS, 1977-2018.
52.1 The Correlation between Marriage and Wages
We start by measuring the conditional correlation between being married and hourly wages over time
separately for men and women. Using OLS we estimate the following linear regression model:
0
yi = αMi + Xi β + θs + φt + i , (1)
where yi is the natural logarithm of hourly wages of person i, Mi is a dummy variable that equals 1 when
an individual reports to be married and living with their spouse, Xi is a set of demographic controls which
consists of education-category dummies, the number of children below the age of 5, the number of children
aged 5-17, a dummy for a child over the age of 18, and dummies for years of potential experience.13 θs
and φt are state and year fixed effects respectively. We cluster standard errors at the state level.
Figure 1 describes how the relationship between marriage and wages (α̂) has evolved over time for
men and women. We estimate Equation 1 for all years in our sample, from t = 1977 to t = 2018,
with a +/-3 year window around each year, and plot the resulting set of α̂ coefficients over time. The
conditional correlation between marriage and hourly wages has changed markedly for women (Figure
1b). At the beginning of the period, marriage was associated with a wage penalty of 4.3%. This penalty
linearly reduced over time until the mid 1980s. In the early 1990s, a positive correlation emerged and it
continued to increase until the end of the sample period. In the last period, marriage is associated with
a premium of 8.0%. This change in the correlation between being married and the wages of women is
especially important in the context of the evolution of female labor force participation and the decline
of marriage. For men, despite the remarkable changes in family structure that are documented in the
literature, such as the decrease in the marriage rate, the increase of divorce, the rise of assortative mating,
and the marked change in the role of married women in the economy, the conditional correlation between
being married and hourly wages has remained remarkably stable over the past four decades. As shown
in Figure 1a, the wages of married men are around 20% higher than those of their single counterparts.14
13
As it is standard in the literature, potential experience is computed as age minus years of education minus
seven.
14
A significant part of the literature on the MWP uses within-individual variation from panel data to identify
the effect of marriage. For example, Killewald and Lundberg (2017) and Ludwig and Brüderl (2018) find no
support for a positive effect of marriage on the wages of man using the National Longitudinal Survey of the Youth
1979 (NLSY79). In Appendix C, we provide a comprehensive comparison between our CPS-based results and
their counterparts in the NLSY79. One of the main advantages of using the CPS is that it enables us to analyze
the evolution of the effect of marriage on wages over more than four decades.
6Figure 1: OLS-estimated Marriage Wage Premium over Time
(a) Men. (b) Women.
Notes: The figures plot the OLS estimate α̂ from Equation 1, and 95% confidence intervals based on state-clustered
standard errors as the vertical spikes. Each point centered on year t is estimated using observations from year t − 3 to t + 3.
Control variables are as described in Section 2.1 above. Data used: CPS, 1977-2018.
3 The Causal Effect of Marriage on Wages
We think of marriage as being not only a product of economic factors, marriage market conditions,
preferences, and chance but also local social norms towards marriage. To measure the prevalence of these
norms on the propensity of being married, we proceed as follows. For each individual in our sample, we
compute the (weighted) share of married people of the same sex, who live in the same state, are observed
in the same survey year, and report the same coarse level of education and children in the household
but are 6 to 15 years older. That is, we use the marriage rate of people that have equal demographic
characteristics but are slightly older than the individuals in our sample to proxy the strength of local
social norms towards marriage. The intuitive idea is that, because these norms are persistent over time,
the marriage patterns of older cohorts are a consequence of norms that are still relevant for the marriage
decisions of the current cohort. Therefore, the marriage rate of the older cohort is a proxy for norms that
determine the propensity to being married of the current cohort. When we define the reference cohort we
balance two criteria. First, we require that the reference cohort is old enough to minimize competition in
the (age-based) marriage market. Second, the reference cohort needs to be close enough to the individual
in the sample so that norms that affect the marriage decisions of the reference cohort persist to affect
the marriage decisions of the individuals in our sample.
We use the marriage rate of older comparable cohorts to proxy local social norms towards marriage
because, to the best of our knowledge, there is no data set that combines rich information on labor supply
and income with more direct measures of social norms. To clarify what the instrument is capturing, we
use the GSS, which periodically asks a nationally-representative sample of individuals their stance on
several issues. In Table 3, we present the correlation between the instrument and the answers to several
questions related to marriage, religion, and politics and policy. To compute these correlations, we proceed
as follows. First, to ease interpretation, we normalize the coding of the responses to reflect a coherent
ideological inclination. For example, all answers which show a positive regard towards marriage are coded
with the same number. Second, we group respondents in year, division, and college-indicator categories.
Due to the sample sizes of the GSS, we cannot use finer cells. For each cell and question, we compute
the average answer and correlate it with the measure of our instrument for the corresponding cell.
The results in Table 3 show that the instrument has a strong positive correlation with favorable
7stances towards marriage and with religious affiliation. Given the role that religion has in the regulation
of marriage, it is not surprising that a positive valuation of marriage and religious affiliation come hand in
hand. For the purpose of our analysis, beyond the mechanism that may bring about social norms towards
marriage, the fact that the instrument is a strong predictor of other measures of these norms provides
further validation to our approach. Additionally, the instrument is not a particularly good predictor of
political and policy stances. That is, the instrument does not capture a strain of political conservatism
which happens to relate to marriage.
Table 3: Correlation Between Instrument and GSS Variables
Proportion Agreeing with Statement: Correlation
Marriage
Married People Generally Happier Than Unmarried .556
People Who Want Children Should Get Married .592
Husband Should Work, Wife Should Look After Home .1
Homosexuals Shouldn’t Have Right To Marry .397
Religion
Have Any Religious Faith .689
Have Christian-Based Faith .641
Attend Religious Service Monthly Or More .474
Strong Religious Affiliation .633
Pray Weekly Or More .243
Supreme Court Wrong To Ban Lord’s Prayer In Schools .147
Politics And Policy
Republican .087
Think Of Self As Conservative .103
We Spend Too Much On Welfare .215
We Spend Too Much On Childcare Assistance .061
We Spend Too Much On Foreign Aid .459
We Spend Too Much On The Military -.069
We Spend Too Much On Space Exploration .297
We Spend Too Much On Supporting Science -.276
Notes: Cells are division × college × year groupings of GSS and CPS respondents. Capitalized words in square brackets
denote the GSS variable from which the derived variable originates. Christian-based faith encompasses the following
religious preferences listed in the GSS: Protestant, Catholic, Christian and Orthodox-Christian. Given that cell size vary
by orders of magnitude, each cell is weighted by the sum of i. the proportion of CPS cell size to total sample size in CPS
and ii. the proportion of CPS cell size to total sample size in GSS. Data used: CPS and GSS.
3.1 Empirical Specification
For both men and women, we run the following two-stage least squares (2SLS) specification:
0
Mi = π1 ZM,i + Xi π2 + θ1s + φ1t + µi , (2)
0
yi = αMi + Xi β + θ2s + φ2t + i . (3)
Equation 2 is the first stage which models marriage as dependent on the covariates used in Section 2.1
and the instrument ZM,i . Equation 3 describes the second stage. It specifies how the logarithm of hourly
wages, yi , depends on marriage and the same covariates as in previous specifications.
For women, we also run a selection-corrected version of the 2SLS specification described in Equation
82 and Equation 3:
Ei = 1{κ1 ZE,i + κ2 ZM,i + Xi κ3 + θ1s + φ1t + ξi > 0} = 1{Zi κ + ξi > 0},
0 0
(4)
0 0
Mi = π1 ZM,i + Xi π2 + θ2s + φ2t + π5 λ(Zi κ) + µi , (5)
0 0
yi = αMi + Xi β + θ3s + φ3t + σ13 λ(Zi κ) + i . (6)
Because we treat marriage as an endogenous variable, we use the instrument ZM,i instead of the dummy
for marriage Mi in the employment equation (Equation 4). We start by estimating the employment
0
decision (Equation 4) using a probit. Then, we recover the estimated coefficients to compute λ(Zi κ) =
0 0
φ(Zi κ)/Φ(Zi κ). Finally, we estimate the two systems of equations, Equations 2-3 and Equations 5-6
using 2SLS. We bootstrap the standard errors in the selection-corrected 2SLS procedure.15
Given the extensive literature on the motherhood penalty and the fatherhood premium coupled with
the positive correlation between marriage and having children, it is important to control for children when
estimating the relationship between wages and marriage.16 A particularly common exclusion restriction
in the literature that studies the labor market outcomes of women is to use a dummy variable for the
presence of own children in the household.17 However, this option is not compatible with controlling for
children in the wage equation. If we think about the constraints that affect the employment decisions of
women, it seems clear that the time a mother needs/wants to devote to children is decreasing with the
age of the child. For example, a newborn requires more time (is more likely to affect the employment
margin) than a teenager. Given this insight, we use the age of the youngest own child in the household
as an exclusion restriction. To the best of our knowledge, our paper is the first to use this exclusion
restriction. We note two relevant points. First, the dummies for the age of the youngest child are jointly
significant in the probit employment equation. Secondly, the set of controls (Xi ) in the wage equation
includes the number of children below the age of 5, the number of children aged 5-17, and a dummy
for a child over the age of 18. Hence, because we already control for the presence of children, we think
it is safe to exclude ZE,i from the wage equation. The implicit assumption is that what affects wages
is whether there are young (0-4) and/or older (5-17) children in the household but not the age of the
youngest, which is only relevant for the employment decision.
We think marriage may have heterogeneous effects on wages and, thus, consider the coefficient es-
timates from the IV specifications a measurement of a local average treatment effect (LATE).18 In the
next section, we highlight the main features of the supporting evidence we provide in Appendix F for the
assumptions that identify a well-defined LATE. First, we require that the instrument significantly affect
marriage decisions (First stage). Second, we need the instrument to be (conditionally) randomly assigned
across individuals (Conditional independence). Third, the impact that the instrument has on marriage
has to be monotonic (Monotonicity). In Section 3.4, we discuss the exclusion restriction and assess the
consequences of its violation on our results.
3.2 Support for the Identifying Assumptions
First Stage. We provide evidence supporting the relevance of the instrument in three places. Figure
F1, in Appendix F, shows the first stage graphically, as well as presenting information on the distribution
of the instrument. For both men and women, there is evidence of a strong relationship between the
15
The instrument for marriage is estimated prior to running the 2SLS procedure. It should be noted that in the
case of a generated instrument (which enters only the first stage and the selection equation), we do not need to
adjust the standard errors of the 2SLS estimates as it is the case with a generated regressor in the wage equation.
16
See Angelov, Johansson, and Lindahl (2016), Chung, Downs, Sandler, and Sienkiewicz (2017), Killewald
(2013), Kleven, Landais, and Søgaard (2019), or Kuziemko, Pan, Shen, and Washington (2018).
17
We experimented with this exclusion restriction while not controlling for children in the wage equation. In
line with the existence of the motherhood penalty and the fatherhood premium, we find a lower MWP for women
and a higher MWP for men.
18
See Imbens and Angrist (1994).
9instrument and individual marriage decisions (conditional on the other relevant covariates discussed in
Section 3.1). In addition, the first column of Table F2 presents the first stage coefficient for each of
the key sample specifications. Finally, we present first-stage F-statistics along with the results of the IV
estimation in Tables 4, 5, and 6, which we present in Section 3.3. All pieces of evidence provide strong
support for the relevance of the instrument.
Conditional Independence. Table F1 examines the stability of the first stage parameter as we
condition on an extra set of covariates. These variables are only available for a subset of the time periods
we analyze, hence, we do not include these in our main specification. They are, however, variables that
can plausibly impact both marriage decisions and productivity. To the extent that the instrument is
randomly assigned, adding these variables to the first stage should not appreciably impact the point
estimate on the instrument. The estimates in Table F1 indicate that, indeed, there is no impact on the
first stage coefficient of including these additional regressors, which we interpret as supportive evidence
of the conditional independence assumption.
Monotonicity. Allowing for the possibility of heterogeneous treatment effects of marriage requires
us to make the additional assumption of monotonicity. In this context, this means that any individual
getting married when the value of the instrument is low also marries when it is high. It also implies
that individuals not marrying when the value of the instrument is high do not marry when it is lower.
A growing literature on judge severity instruments (Dahl, Kostøl, and Mogstad (2014); Bhuller, Dahl,
Løken, and Mogstad (Forthcoming); Bald, Chyn, Hastings, and Machelett (2019)), which employs a setup
of a binary endogenous regressor and a continuous instrument as we do, notes that monotonicity implies
we should see a non-negative first stage coefficient for any sub-sample. Table F2 presents the first stage
coefficient for a variety of different sub-samples. In all cases, the coefficient is non-negative, lending
support for the monotonicity assumption.
3.3 Results
Table 4 presents the marriage coefficients estimated using IV (α̂ from Equation 3) for men in the six
sub-periods of seven years that cover all data we have. Table 5 is its equivalent for women, while Table
6 contains the estimates from the specification in Equations 4, 5, and 6, which combines the selection
correction with the IV. To ease comparison with the OLS estimates, the first row of each table contains
the marriage coefficients estimated using OLS (α̂ from Equation 1). One of the differences between the
OLS estimates and the IV coefficients is that the latter are estimated off of the complier population while
the first are based on the whole population of interest. In order to understand how much of the difference
between the OLS and IV estimates is due to the distinct populations from which they are estimated,
the second row presents OLS estimates based on reweighting the main sample to reflect the observable
characteristics of the complier population.19 That is, the coefficients in the second and third rows are
based on samples that reflect the same observable characteristics. Figure 2 presents the IV estimates
using a 7-year rolling window over all years of our sample as in Figure 1.
The patterns observed from the IV estimates are in line with those observed out of the descriptive
evidence of Section 2.1. Namely, the positive effect of marriage on the wages of men is sizable and has
remained fairly stable over the past decades. For women, being married negatively affects wages during
the 1980s. From the late 1980s until the mid 2000s, the effect is non-significantly different from zero with
negative point estimates which are close to zero. Since the mid 2000s, marriage notably increases the
wages of women.20
19
In Appendix Section F.2, we provide the details of how we back out the observable characteristics of the
complier population.
20
In Appendix B, we show that these patterns are robust to including other controls. In particular to adding
controls on industry and occupation. We do not include these controls in our main specification because we
10Table 4: IV - Men
A. OLS: (1) (2) (3) (4) (5) (6)
’77-’83 ’84-’90 ’91-’97 ’98-’04 ’05-’11 ’12-’18
Baseline:
Married 0.213*** 0.208*** 0.214*** 0.209*** 0.222*** 0.200***
(0.007) (0.007) (0.007) (0.007) (0.007) (0.007)
Complier Reweighted:
Married 0.201*** 0.195*** 0.204*** 0.198*** 0.217*** 0.197***
(0.006) (0.006) (0.007) (0.006) (0.007) (0.006)
B. IV:
Married 0.306*** 0.269*** 0.246*** 0.226*** 0.266*** 0.237***
(0.013) (0.015) (0.013) (0.016) (0.017) (0.021)
First-Stage F-Statistic 1461.3 2116.8 1304.2 1425.5 1426.4 1128.9
Adjusted R2 0.198 0.238 0.263 0.249 0.268 0.265
Observations 104,970 104,545 96,210 112,807 120,606 94,896
Notes: *** denotes significance at 1%, ** at 5%, and * at 10%. Standard errors are reported in parentheses, where these
are clustered by state. The dependent variable in all columns is the natural log of wages. Year and state fixed effects are
included in all regressions. The following additional controls are included: dummies for highest level of educational
attainment, dummies for year of potential experience, the number of children below the age of 5, the number of children
aged 5-17, and a dummy for a child over the age of 18. The instrument in all specification is the proportion of individuals’
reference group that are married. For the complier reweighted regressions, we first separate each sample into six mutually
exclusive groups based on education and age, as outlined in Section F.2.2. We estimate the proportion of compliers in
each sub-group, and then reweight our main estimation samples so that the complier proportion in each of the six
sub-groups matches the proportion of the main sample for the selfsame sub-group. Data used: CPS, 1977-2018.
Table 5: IV - Women
A. OLS: (1) (2) (3) (4) (5) (6)
’77-’83 ’84-’90 ’91-’97 ’98-’04 ’05-’11 ’12-’18
Baseline:
Married –0.053*** –0.001 0.031*** 0.054*** 0.070*** 0.079***
(0.008) (0.008) (0.007) (0.007) (0.007) (0.006)
Complier Reweighted:
Married –0.032*** 0.018** 0.049*** 0.064*** 0.081*** 0.087***
(0.008) (0.009) (0.007) (0.007) (0.007) (0.007)
B. IV:
Married –0.159*** –0.061 –0.030 –0.034 0.078*** 0.088***
(0.025) (0.045) (0.029) (0.044) (0.027) (0.032)
First-Stage F-Statistic 361.9 478.3 291.4 425.6 378.0 283.9
Adjusted R2 0.148 0.200 0.237 0.227 0.226 0.227
Observations 70,872 83,482 83,791 101,175 109,624 85,427
Notes: *** denotes significance at 1%, ** at 5%, and * at 10%. Standard errors are reported in parentheses, where these
are clustered by state. The dependent variable in all columns is the natural log of wages. Year and state fixed effects are
included in all regressions. The following additional controls are included: dummies for highest level of educational
attainment, dummies for year of potential experience, the number of children below the age of 5, the number of children
aged 5-17, and a dummy for a child over the age of 18. The instrument in all specification is the proportion of individuals’
reference group that are married. For the complier reweighted regressions, we first separate each sample into six mutually
exclusive groups based on education and age, as outlined in Section F.2.2. We estimate the proportion of compliers in
each sub-group, and then reweight our main estimation samples so that the complier proportion in each of the six
sub-groups matches the proportion of the main sample for the selfsame sub-group. Data used: CPS, 1977-2018.
consider these characteristics to be endogenous to the treatment. That is, we think as marriage plausibly affecting
the industry/occupation in which people work. Moreover, the employment-selection specification cannot include
industry and occupation controls as these are undefined for non-employed individuals.
11Table 6: IV-Heckman - Women
A. Heckman: (1) (2) (3) (4) (5) (6)
’77-’83 ’84-’90 ’91-’97 ’98-’04 ’05-’11 ’12-’18
Baseline:
Married –0.044*** 0.000 0.033*** 0.052*** 0.068*** 0.080***
(0.008) (0.008) (0.007) (0.008) (0.007) (0.006)
Complier Reweighted:
Married –0.025*** 0.019** 0.051*** 0.061*** 0.079*** 0.087***
(0.008) (0.008) (0.007) (0.008) (0.007) (0.007)
B. IV-Heckman:
Married –0.149*** –0.058 –0.018 –0.033 0.104*** 0.086***
(0.022) (0.037) (0.028) (0.040) (0.031) (0.032)
First-Stage F-Statistic 352.6 485.8 265.2 417.4 311.0 236.8
Adjusted R2 0.149 0.200 0.237 0.227 0.225 0.227
Observations 70,872 83,482 83,791 101,175 109,624 85,427
Notes: *** denotes significance at 1%, ** at 5%, and * at 10%. Standard errors are reported in parentheses, where these
are clustered by state. The dependent variable in all columns is the natural log of wages. Year and state fixed effects are
included in all regressions. The following additional controls are included: dummies for highest level of educational
attainment, dummies for year of potential experience, the number of children below the age of 5, the number of children
aged 5-17, and a dummy for a child over the age of 18. The instrument in all specification is the proportion of individuals’
reference group that are married. The exclusion restrictions for the employment equation are a series of dummies for age
of youngest child in the household from 1-18, where age less that 1 is the base category, a dummy for ages 19-24, a dummy
for 25 and over, and no children are also included. In this case we bootstrap standard errors, allowing for clustering at the
state level, and using 500 iterations. For the complier reweighted regressions, we first separate each sample into six
mutually exclusive groups based on education and age, as outlined in Section F.2.2. We estimate the proportion of
compliers in each sub-group, and then reweight our main estimation samples so that the complier proportion in each of
the six sub-groups matches the proportion of the main sample for the selfsame sub-group. Data used: CPS, 1977-2018.
Figure 2: Marriage Wage Premium over Time - 3 year window
(a) IV - Men. (b) IV-Heckman - Women.
Notes: The figures plot the IV and IV-Heckman estimates of α from Equations 3 and 6 for men and women respectively,
and 95% confidence intervals based on state-clustered standard errors as the vertical spikes. Each point centered on year t
is estimated using observations from year t − 3 to t + 3. Control variables are as outlined in Section 3.1 above. Data used:
CPS, 1977-2018.
3.4 The Exclusion Restriction
Our identification strategy hinges on the assumption that the local social norms measured by our instru-
ment only affect wages through marriage. However, it is plausible that norms towards marriage exist
jointly with norms on the role of men and women in the family and the labor market. That is, the in-
12strument might capture not only local social norms towards marriage but also traditional gender norms.
If these gender norms affect decisions that determine productivity, like career choices or labor supply,
then the exclusion restriction is violated.21 In this section, we discuss in detail this possibility and how
it affects the conclusions that can be drawn from our estimates.
Traditional gender norms are to impact the wages of men and women differently. These norms are
likely to push men in the direction of taking decisions that increase productivity, thus, generating a higher
hourly wage. For women these norms press in the opposite direction. Hence, in the presence of gender
norms in our setup, the marriage coefficient is upward biased for men and downward biased for women.
This implies that the marriage wage penalty that women received in the 1980s is likely to be lower,
the marriage wage premium might have emerged earlier than the mid 2000s, and the current premium
might be even higher. For men, it implies that the estimated coefficient is a combination of the effects of
marriage and traditional gender norms on wages. Given the size and the steadiness of the coefficient over
time —the vigor of traditional gender norms is likely to have decreased over time while the estimated
effect of marriage on the wages of men does not display a decreasing pattern over time— suggest that,
even if the estimates are contaminated by the effect of traditional gender norms, the effect of marriage
on the wages of men is likely to be positive.
A suitable method to assess the effect of violations to the exclusion restriction akin to that generated
by the presence of traditional gender norms is the plausible exogenous approach by Conley et al. (2012).
Abstracting from other control variables, Conley et al. (2012) present the 2SLS estimating equations,
allowing for an instrument Z that is non-excludable, as:
Y = M α + Zγ + , (7)
M = ZΠ + V , (8)
where E[M ] 6= 0, E[Z] = 0 and the exclusion restriction can be thought of γ ≡ 0.
Conley et al. (2012) consider four different strategies to implement their technique, which handles
deviations from γ ≡ 0. We consider the Local to Zero Approximation (LTZ) which assumes a prior on
γ that follows a normal distribution, with mean µγ and variance Ωγ , where the uncertainty regarding γ
reduces with sample size. In this setting we can write the plausibly exogenous estimator as:
α̂ ∼ N (α2SLS + Aµγ , W2SLS + AΩγ A0 ), (9)
where A = (X 0 Z(Z 0 Z)−1 Z 0 X)−1 (X 0 Z), α2SLS is the 2SLS point estimate, and W2SLS is the 2SLS
variance-covariance matrix.
We are interested in assessing how robust are the broad patterns we draw from the estimated coef-
ficients —the emergence of a premium for women and the sustained existence of a premium for men—
to violations of the exclusion restriction. To that end, we start by estimating how large γ in Equation 7
needs to be to invalidate our inference, that is, to crowd out the direct effect of marriage on wages (α).
We denote this particular γ as γ ∗ and we compute a different γ ∗ for each gender and seven-years period
we consider in our main results. The values of γ ∗ are hard to interpret without a reference for what are
plausible values for γ in our data. Hence, we use the approach of van Kippersluis and Rietveld (2018) to
establish an anchor for the interpretation of the different γ ∗ we compute.
As van Kippersluis and Rietveld (2018) note, if there exists a sub-group of the sample for whom the
first stage is zero, i.e. a group for whom the marriage decision is not impacted by the instrument, then
the reduced form for this group can be used to back out a plausible estimate for γ. We refer to this
sub-sample as the zero-first-stage sub-sample. To see how this approach is informative of the exclusion
21
Note that the selection correction we add to the IV tackles the case in which gender norms affect only the
extensive margin of women’s labor supply.
13restriction, consider a reduced form equation for wages where we substitute Equation 8 into Equation 7:
Y = Z(γ + αΠ) + ( + αV ). (10)
For the zero-first-stage sub-sample, Π = 0, the reduced form estimate of our instrument is given by γ.
The first stage is weaker for those with predicted values of being married below the median.22 Hence, we
consider a smaller sub-sample, those with predicted marriage in the lowest quartile, as the zero-first-stage
sub-sample. We denote the γ we estimate from this procedure γ̂ZF S .
In the second row of Tables 7 and 8 we present the effect of being married on wages when γ, the
magnitude of the violation of the exclusion restriction, is derived from the zero-first-stage sub-samples.
If we make the assumption of homogeneous direct effects of the instrument (i.e the γ̂ estimated from the
zero-first-stage sub-sample is informative of γ for the full sample), then we can assess the impact of a
violation of the exclusion restriction on the 2SLS estimates for the full sample. Specifically this means
we set µγ = γ̂ZF S . Note that for each gender and seven-years period, we compute a different γ̂ZF S . The
coefficients indicate that the patterns derived from our main results (in the first row) are robust to the
violations of the exclusion restriction informed by γ̂ZF S . We also use γ̂ZF S to anchor the interpretation
of γ ∗ , the violation of the exclusion restriction that invalidates our inference. For men, γ ∗ /γ̂ZF S is larger
than 2 in all periods, that is, the violation of the exclusion restriction that renders our inference invalid
needs to be at least two times larger than the most reasonable magnitude of the exclusion restriction we
can estimate. For women, γ ∗ /γ̂ZF S is larger than one in all cases. In the later periods, when the MWP
for women has emerged, the violation to the exclusion restriction needs to be more than 50% larger than
the estimate of γ that can be drawn from the data in order to invalidate our finding.
Table 7: Plausibly Exogenous - Men
1977- 1984- 1991- 1998- 2005- 2012-
1983 1990 1997 2004 2011 2018
2SLS 0.306*** 0.269*** 0.246*** 0.226*** 0.266*** 0.237***
(0.013) (0.015) (0.013) (0.016) (0.017) (0.021)
Plausibly Exogenous 0.187*** 0.158*** 0.214*** 0.194*** 0.254*** 0.225***
(With Uncertainty) (0.014) (0.016) (0.014) (0.017) (0.018) (0.022)
γ∗ 0.248 0.234 0.207 0.188 0.221 0.187
γ ∗ /γ̂ZF S 2.575 2.430 7.896 7.172 22.033 18.643
Observations 104,970 104,545 96,210 112,807 120,606 94,896
Notes: *** denotes significance at 1%, ** at 5%, and * at 10%. Standard errors are reported in parentheses, where these
are clustered by state. The dependent variable in all columns is a dummy for married. Year and state fixed effects are
included in all regressions. The following additional controls are included: dummies for highest level of educational
attainment, dummies for year of potential experience, the number of children below the age of 5, the number of children
aged 5-17, and a dummy for a child over the age of 18. The instrument in all specification is the proportion of individuals’
reference group that are married. We specify γ̂ as the reduced form
q estimate from the zero-first-stage sample. For the
plausibly exogenous with uncertainty results, we set Ωγ = (.125 S02 + S−02 )2 , where S is the standard error on γ̂ for the
0
zero-first-stage sub-sample and S−0 is the equivalent for the remainder of the sample. γ ∗ is the value of γ that yields a
coefficient on marriage equal to zero. Data used: CPS, 1977-2018.
22
We do not use the instrument when predicting being married in this case.
14Table 8: Plausibly Exogenous - Women
1977- 1984- 1991- 1998- 2005- 2012-
1983 1990 1997 2004 2011 2018
2SLS –0.149*** –0.058 –0.018 –0.033 0.104*** 0.086***
(0.022) (0.037) (0.028) (0.040) (0.031) (0.032)
Plausibly Exogenous –0.197*** –0.106** 0.001 –0.010 0.153*** 0.139***
(With Uncertainty) (0.026) (0.044) (0.031) (0.045) (0.032) (0.036)
γ∗ –0.107 –0.042 –0.012 –0.018 0.055 0.043
γ ∗ /γ̂ZF S 1.038 1.438 –2.597 –2.093 –2.710 –1.637
Observations 70,872 83,482 83,791 101,175 109,624 85,427
Notes: *** denotes significance at 1%, ** at 5%, and * at 10%. Standard errors are reported in parentheses, where these
are clustered by state. The dependent variable in all columns is a dummy for married. Year and state fixed effects are
included in all regressions. The following additional controls are included: the Inverse Mills Ratio, dummies for highest
level of educational attainment, dummies for year of potential experience, the number of children below the age of 5, the
number of children aged 5-17, and a dummy for a child over the age of 18. The instrument in all specification is the
proportion of individuals’ reference group that are married. We specify γ̂ as the reduced form estimate
q from the
zero-first-stage sample. For the plausibly exogenous with uncertainty results, we set Ωγ = (.125 S02 + S−02 )2 , where S is
0
the standard error on γ̂ for the zero-first-stage sub-sample and S−0 is the equivalent for the remainder of the sample. γ ∗
is the value of γ that yields a coefficient on marriage equal to zero. Data used: CPS, 1977-2018.
Overall, we interpret the results of the plausibly exogenous approach as strong evidence that the broad
patterns we derive from our results are robust to wide-ranging violations of the exclusion restriction. In
Appendix Section F.1.2 we show that the imperfect instrumental variable approach of Nevo and Rosen
(2012) cannot refute our inference either. The shortcoming of this methodology, for our setup, is that it
only allows computing upper bounds on the effect of marriage on wages but not lower bounds.
4 The Effect of Marriage along the Wage Distribution
One of the most relevant economic changes of the past decades has been the increase in income inequal-
ity.23 At the same time, the divergence in marriage rates along important determinants of income has
also increased. For example, Lundberg, Pollak, and Stearns (2016) document that, while the marriage
rate was virtually the same across education groups up until the mid 1980s, nowadays collage graduates
are significantly more likely to be married than people with a high school diploma. These two trends
naturally lead to investigate how heterogeneous is the effect of being married along the wage distribution
and its evolution over the past decades. We do so in this section.
4.1 Empirical Specification
We estimate the causal effect of marriage along the unconditional wage distribution, the unconditional IV
quantile tratment effects (IVQTEs), using the Generalized Quantile Regression (GQR) approach of Powell
(2020).24 We follow Powell (2020) and specify a rank variable Ui∗ ∼ U (0, 1), an unknown, unspecified
function of observed (Xi ) and unobserved factors (Ui ) such that Ui∗ = f (Xi , Ui ). We can write our
outcome variable as a function of our treatment variable as Yi = Mi 0 α(Ui∗ ), Ui∗ ∼ U (0, 1). The aim is
to estimate the Structural Quantile Function (SQF):
SY (τ |m) = m0 α(τ ). (11)
23
See Autor (2014) and Guvenen, Kaplan, Song, and Weidner (2017).
24
This approach is a useful synthesis of (conditional) IVQR method of Chernozhukov and Hansen (2006)
and the Re-centered Influence Function (RIF) approach of Firpo, Fortin, and Lemieux (2009), which estimates
unconditional QTEs but does not permit the use of IV methods. The utility of using unconditional quantiles is
prounounced in our setting given the extent to which the wage distribution has changed over the past decades.
15The SQF defines the τ th quantile of the outcome distribution given the treatment if each individual in the
sample had M = m. The quantile function is written as M 0 α(τ ). The GQR estimator uses the following
moment conditions:
E {Zi [1(Yi ≤ Mi0 α(τ )) − τX ]} = 0, (12)
E [1(Yi ≤ Mi0 α(τ )) − τ ] = 0, (13)
where τX represents P (Yi ≤ Mi0 α(τ ) | Xi ) and is estimated by:
τX = F (Xi δ(τ )). (14)
Covariates do not enter in Equation 11, the quantile functions are unconditional. Rather, covariates are
used to determine the probability that log wages are below the quantile function given the covariates, as
seen in Equation 12.25
4.2 Results
Figure 3 presents the IVQTEs for men and women divided in the six periods that cover all our sample
years. For each gender-period, we compute the causal effect of marriage on wages at the 10th, 25th, 50th,
75th, and 90th percentiles of the unconditional wage distribution. For men at the beginning of the sample
period (panel 1977-1983 in Figure 3a), the effect of marriage on wages monotonically decreases as we move
up the unconditional wage distribution. While for men below the median, being married increases wages
by around 40%, the effect is halved at the top of the distribution. This pattern is fairly consistent over
time although the magnitude of the difference decreases. In the last period, 2012-2018 (Figure 3b) there
are virtually no differences in the effect of marriage on wages at different points of the wage distribution.
In the case of women, we observe a similar evolution. However, the starting point is the opposite to the
case of men. In the early periods (Figure 3c) women below the median experience a bigger marriage
penalty that women above. For women at the 90th percentile, the wage premium emerges in the mid
1990s, while the average effect in this period is still non-significant on average (Table 6). Conversely, for
women at the 10th and 25th percentiles there is no conclusive evidence on the emergence of a positive
effect of being married on wages. Although the point estimates in the last period are positive (panel
2012-2018 in Figure 3d), their 95% confidence intervals include 0.
25
Covariates are additionally used in our setting for the purposes of identification. Given that our instrument
is constructed conditional on individual realizations of education, age and children, it is likely not unconditionally
exogenous, but it is conditionally exogenous.
16Figure 3: IVQTE
(a) Men - IV - Periods 1-3. (b) Men - IV - Periods 4-6.
(c) Women - IV - Periods 1-3. (d) Women - IV - Periods 4-6.
Notes: The figures present IVQTE estimates, and 95% confidence intervals based on state-clustered standard errors. These
IVQTE estimates were produced using the Generalized Quantile Regression approach of Powell (2020). The dependent
variable in all columns is the natural log of wages. The proneness variables - variables used to predict the probability that
the log wage is below the quantile function - include: year and state fixed effects, dummies for highest level of educational
attainment, dummies for year of potential experience, the number of children below the age of 5, the number of children
aged 5-17, and a dummy for a child over the age of 18. The instrument in all specification is the proportion of individuals’
reference group that are married interacted with a full set of state dummies. For the numerical optimization we used
an adaptive MCMC optimization procedure, with a Metropolis-within-Gibbs sampler, 20,000 draws, a burn rate of .30,
an acceptance rate of .50. The retained draws were jumbled to reduce autocorrelation between draws. Data used: CPS,
1977-2018.
5 Discussion
Our results can be summarized as follows. Nowadays, being married causally increases the wage of the
average men and the average women. While for the average men this positive effect has been stable over
the past decades, the causal impact of marriage on the wages of women has evolved from a penalty to the
emergence of a premium in the mid 2000s. These patterns are not uniform across the wage distribution.
For men below the median wage, the marriage premium has reduced significantly even though it remains
positive and sizable. Conversely, for men above the median wage, the effect has stayed fairly constant.
In the case of women, the emergence of a premium happened earlier for women above the median wage
than for the average. For women below the median, the effect of marriage on wages is unlikely to be
17You can also read