Operational Monitoring Status - Sammy Valder 26-05-2021
←
→
Page content transcription
If your browser does not render page correctly, please read the page content below

Operational Monitoring
        Status
        Sammy Valder
         26-05-2021
Operational Monitoring
• CCM responsible for capturing, distributing, and archiving operational monitoring information

• OpMon information is defined as information related to the operation of the DAQ system components –
  distinct from physics event data from detector systems

• More specifically:

    • Provide an API for daq systems to publish structured data
    • Allow for configurable levels of information - (e.g. standard, info, error, debug)
    • Configurable polling intervals for monitorable information
    • Implement set streams for dispatching information – stdout, stderr, also network-based streams
    • Provide archival system and a UI – analyse data for live and post-mortem
    • Provide alerts and notifications
    • Implement aggregation and analysis functionality
Opmonlib
                                   opmonlib

           Three ways to publish:

               •   stdout to terminal
                     • Flat
                     • Formatted
                     • Compact

               •   Print to file

               •   Pass to InfluxDB
Influxopmon
• Written by Yann Donan to interface OpmonService with InfluxDB

• Takes in a json object from OpmonService -> Turns this into an InfluxDB INSERT statement

•   InfluxDB URI [Tag – v2.4.0]
                                                                                                                               Yann Donan, 2021

• Tag v2.4.0 use curl, more up to date versions now use cpr library (more user friendly)

• Uses the CERN DB on demand InfluxDB service
                  Bullding and running - https://dune-daq-sw.readthedocs.io/en/latest/packages/influxopmon/#influxopmon-influx-db-plugin-for-operational-monitoring
Timing App -> InfluxDB
                                                                                                                     --informationService
   Tag v2.4.0:                                                   Defines name of series

          $ daq_application –-name timing_app –-commandFacility rest://localhost:12345 –i
          influx://dbod-testinfluxyd.cern.ch:8095:db1:usr:pwd:https:.time=:.class_name=

                                                                              replace with usr and pwd

   Develop:

          $ daq_application –-name timing_app –-commandFacility rest://localhost:12345 –i
          influx://188.185.88.195:db1:.time=:.class_name=

                                     URI has changed

NB: This assumes your daq module is set up with opmonlib (i.e. structures defines, get_info() called, etc.). I wrote preliminary documentation on how to
do this -> https://dune-daq-sw.readthedocs.io/en/latest/packages/opmonlib/Instructions-for-DAQ-module-users/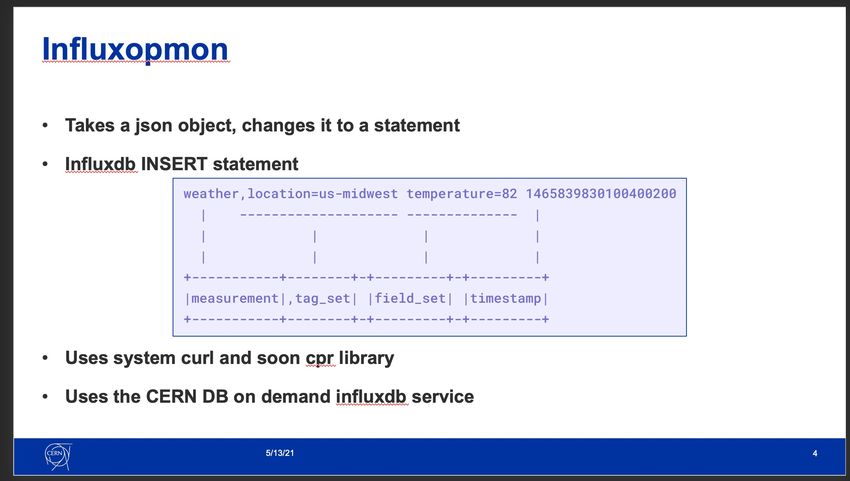
InfluxDB -> Grafana

• Grafana - Monitoring dashboard

    • Allows for observation of monitorables in real-
      time

• Easy user interface allows for “plug and play”

• Fully compatible with InfluxDB

    • Added the test influx database as a data source

• Using an instance of Grafana on:
  http://np04-srv-009.cern.ch:3000/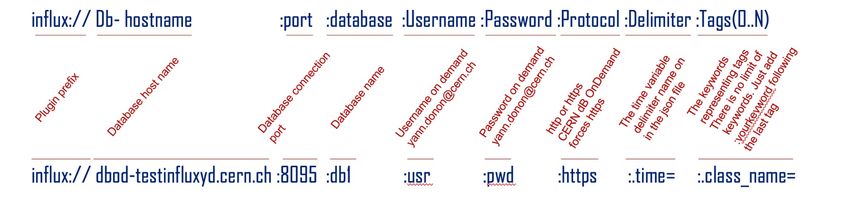
InfluxDB -> Grafana
                      Create dashboard
InfluxDB -> Grafana
InfluxDB -> Grafana

InfluxDB -> Grafana

   Defined name previously in `–-name timing_app`
InfluxDB -> Grafana

        Many options available
Alerts in Grafana
Example:
If max value >500 in the last
60 seconds -> ALERT!Timing App Dashboard
Timing App Testing

• Stoyan has already been using InfluxDB/Grafana interface to run long term tests on the HSI buffer

• Integration has worked as a proof of principle

    • Need to think longer term how this scales
Exporting Dashboard
Moving Forward

• Feedback…

    • What do people want to see implemented?

    • What do we want moving forward?

• How to scale this upwards

    • Right now dashboards are all built by hand – very easy, but perhaps not practical

    • Can we take advantage of similarities in modules – create template dashboards

• Potentially more person power available, great news!

• Open discussion
Backups
Monitoring

             Alex Tapper, 2020
Opmonlib
Original work done by Lola Stankovic (CERN):
• Created a lightweight opmon
library with c++ metrics
• Registering, monitoring and
publish implemented
• std::atomic types used
• Some influxDB and Grafana
implementation and testing
• Wanted to move to information
structures…Json Objects
Yann Donan, 2021InfluxDB
Lola Stankovic, 2020Influxopmon
Yann Donan, 2021
Now implemented,
depends on version
pulledInfluxopmon
Yann Donan, 2021
Tag – v2.4.0Grafana
Integration with Timing App
Worked closely with Stoyan (Bristol)

Using timing_app as an example and proof of principle of
implementing OpMon with a DAQ module

Written short guide in how to do this

Produced an example dashboard which is currently being
used for stability tests
OpMon Timeline

                                       Sep 1st 2020

                                       Jan 1st 2021

                        Jan 1st 2021
”Completed”
                                          Apr 1st 2021
You can also read