Outlook on Electric Buses in India - Busworld Academy

Page created by Everett Molina
 
CONTINUE READING
Outlook on Electric Buses in India - Busworld Academy
Outlook on Electric Buses in India
                                     ›
Outlook on Electric Buses in India - Busworld Academy
Dr. A.K. Jindal
Advisor E-Mobility, New products and Technology @ TATA Autocomp Systems Limited
                                                                              ›
Outlook on Electric Buses in India - Busworld Academy
.
         EV BUS FUTURE –POST COVID

                      Way Forward

                    Busworld Webinar
                      16th July 2020

Date 16 July 2020
Outlook on Electric Buses in India - Busworld Academy
Environment Check
                                                                    Proportion of Urban Population in India Exposed to Air Pollution
                                                            35%
                                                                                                    32%
                                                                                                                 29%

                           Percentage of Urban Population
• Urban areas in India
                                                            30%

                                                            25%

  are exposed to high                                       20%

  level of air pollution                                    15%                       12%
                                                                                                                               10%
                                                            10%                                                                              8%

• As awareness of air                                       5%
                                                                                                                                                          6%

  pollution increases,
                                                                      1%
                                                            0%
                                                                  0 - 50 (Good)      50 - 100      100 - 200   200 - 300     300 - 400     400 - 500   >500 (Very

  governments will be                                                             (Satisf actory) (Moderate)    (Poor)      (Very poor)
                                                                                                Particulate Matter (PM10) level (μg/m 3)
                                                                                                                                           (Severe)     Severe)

                                                              Data source: CPCB
  forced to clamp down
  on pollution sources

                                                                                      Source : Business Standard
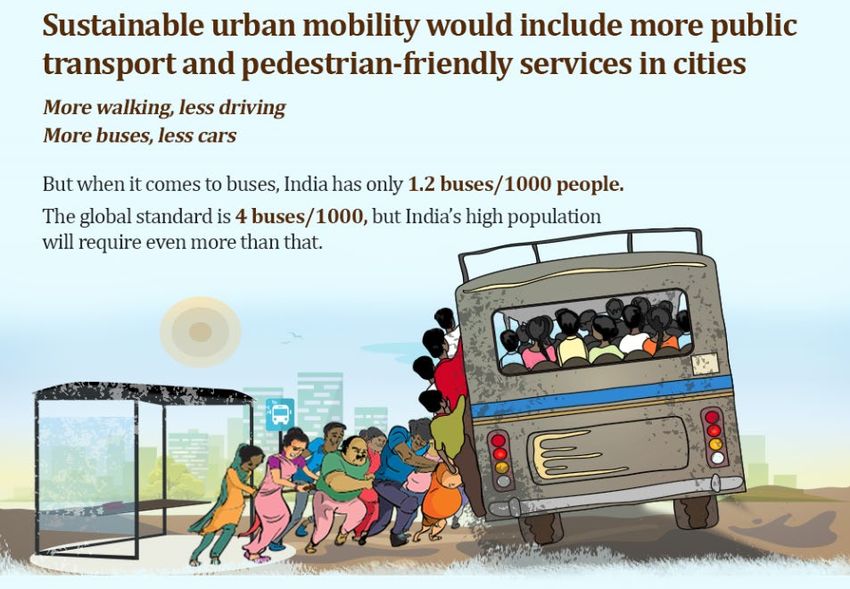
Outlook on Electric Buses in India - Busworld Academy
Environment Check
Air Quality Index                                    Proportion of Urban Population in India ExposedPM
     in Delhi                          Biggest Global
                                                 35%    experiment32%                               to Air Pollution
                                                                                                          10
                                                                                       29% Concentration
                                       on Pollution

                                                   Percentage of Urban Population
Pre and Post Lock
                                                 30%

                                                 25%                                              in Delhi
      Down                                       20%                                      Pre and Post Lock
                                                 15%             12%                               Down
                                                                                                                                                       10%
                                                                                    10%                                                                              8%
                                                                                                                                                                                  6%
                                                                                    5%
                                                                                              1%
                                                                                    0%
                                                                                          0 - 50 (Good)      50 - 100      100 - 200   200 - 300     300 - 400     400 - 500   >500 (Very
                                                                                                          (Satisf actory) (Moderate)    (Poor)      (Very poor)    (Severe)     Severe)
                                                                                                                        Particulate Matter (PM10) level (μg/m 3)

                                                Data source: CPCB

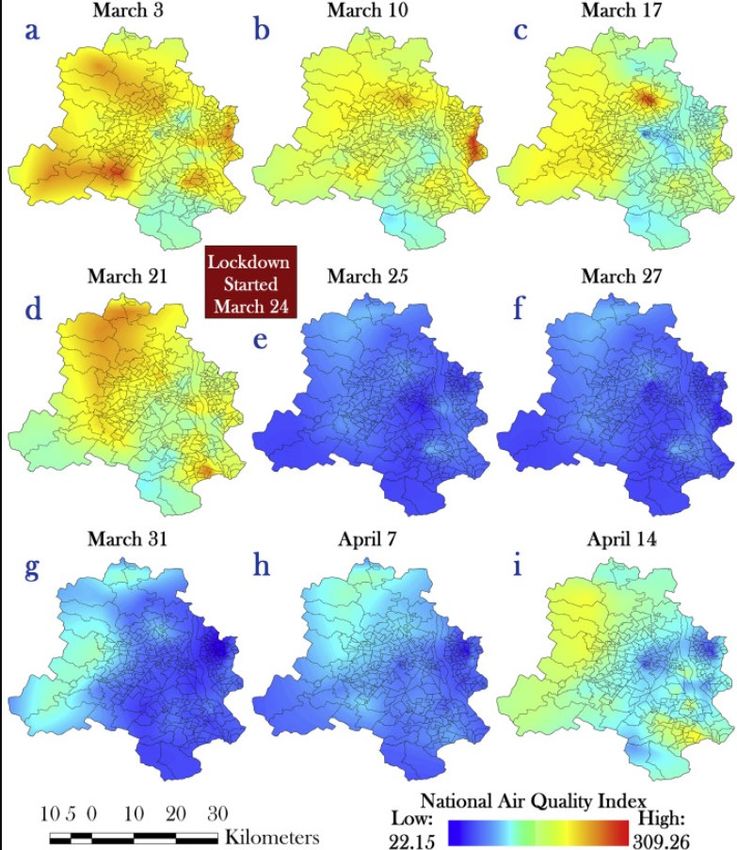
 Effect of lockdown amid COVID-19 pandemic on air quality of the megacity Delhi, India
 SusantaMahatoSwadesPalKrishna GopalGhosh
Outlook on Electric Buses in India - Busworld Academy
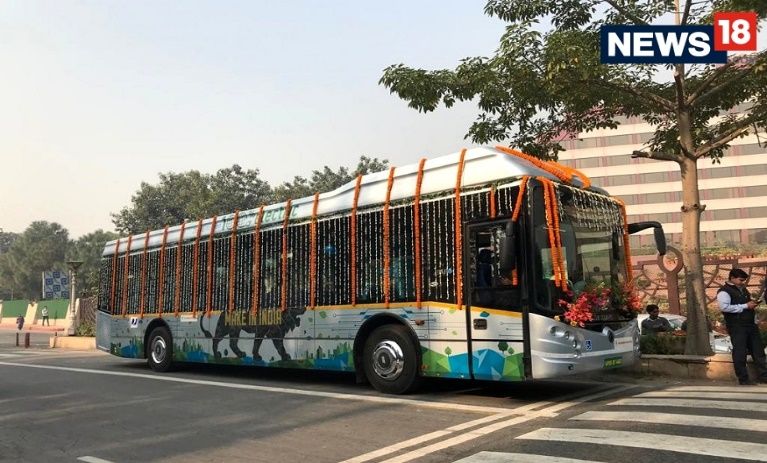
NEED Parameters for EV remains still valid and critical

Rapid           •   India, as rest of the world, is
                    experiencing unprecedented rise
Urbanisation        in urbanisation
                •   India is expected to have more
                    than 68 cities with populations
                    more than 1 million in 2030

Traffic         •   A typical Monday at 8PM in
Congestion &        New Delhi
Pollution

Challenges
for Design of
Future
Mobility
Solutions
Outlook on Electric Buses in India - Busworld Academy
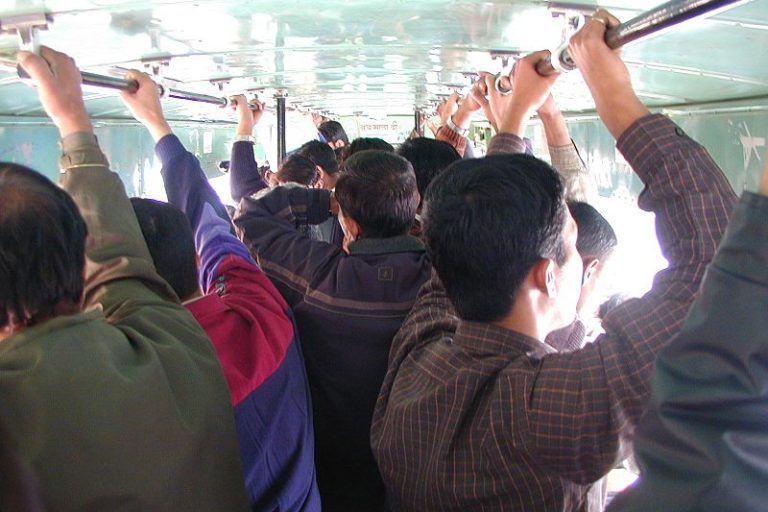
Why Electric Mobility ?

                                                 In order to deliver significant GHG
                                                 emission      reductions,   transport                                     • Sustainability
                                                 electrification needs to go with the        National Electric Mobility
                                                 decarbonisation        of      power                Mission               • Protection of
                                                 generation.                                                                 environment
                                                                                             100% e-mobility by 2030
                                                                                                                           • Deep social change
                                                                                            FAME (Faster Adoption and
                                                                                            Manufacturing of Hybrid &      Major driving factors for
                                                                                             Electric Vehicles in India)   new technology
                                                                                                                           developments
                                                                                                     Key Areas :
                                                                    1/3rd
                                                                        Crude Imports      Technology Development
                                          India    3rd            used on transportation   Demand Creation
                                         largest Oil                                       Pilot Projects
                                         Consumer                      80% on Road          Charging Infrastructure
                                                                      transportation
                                       4 million bpd

c Copyright, Confidential, Tata Motors Limited
Outlook on Electric Buses in India - Busworld Academy
FAME II Puts Big Focus on Buses

Vehicle segment-wise Incentives, Maximum Number of vehicles to be supported

                                                                         Total Approximate Incentive
                                  ## Maximum
Sr.                                                  Approximate Size of @ 10000/KWh for all         Maximum Ex-factory Total fund support
      Vehicle segment             Number of vehicles
No.                                                  battery in KWH      vehicles and 20000/KWh for price to avail incentive. from DHI
                                  to be supported
                                                                         Buses and Trucks
  1   Registered e-2 Wheelers         1000000             2 KWH               Rs.20000/-          Rs. 1.5 Lakhs         Rs. 2000 Cr
      Registered e-3 Wheelers
  2                                    500000             5 KWH               Rs.50000/-          Rs. 5    Lakhs        Rs. 2500 Cr
      (including eRikshaws)
  3   e-4 Wheelers                      35000            15 KWH               Rs.150000/-         Rs. 15 Lakhs          Rs. 525 Cr
      4W Strong Hybrid
  4                                     20000            1.3 KWH              Rs.13000/-          Rs. 15 Lakhs          Rs. 26    Cr
      Vehicle
  5   e-Bus                             7090            250 KWH              Rs.50 Lakhs/-        Rs. 2    Crores       Rs. 3545 Cr
    Total Demand Incentive                                                                                              Rs. 8596 Cr

Cap on incentives for buses will be 40% of the cost of vehicles and for all other categories it will be 20%.
## The proposed amount of incentives per KWH are, however, subject to review as per the reduction in battery costs & thereby reduction in
vehicle cost and would be notified accordingly from time to time. It is to be noted that the number of vehicles and fund support among the
sub components as above is fungible with the approval of PISC.

 FAME II has allocated . 3500 Cr Rs for 7000 buses in the country.

 5595 Buses have been sanctioned.
Outlook on Electric Buses in India - Busworld Academy
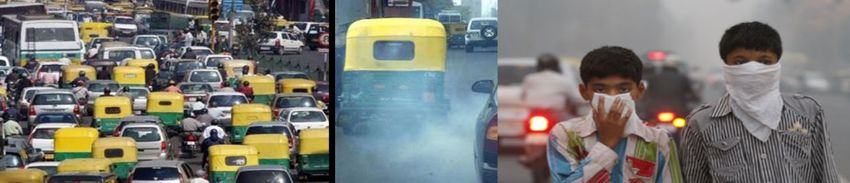
Progress in the Deployment of E Buses

              • Supported by Fame I as well as Initiative by various STU’s, more
                than 600 buses have been deployed across various parts of India.

                    Pune
                    Kolkatta
                    Indore
                    Lucknow
                    Jammu
                    Guwahati
                    Mumbai
                    Ahmedabad
                    Hyderabad
                    Silvasa
                    Kullu –Manali
                    and many more

                                               9
Outlook on Electric Buses in India - Busworld Academy
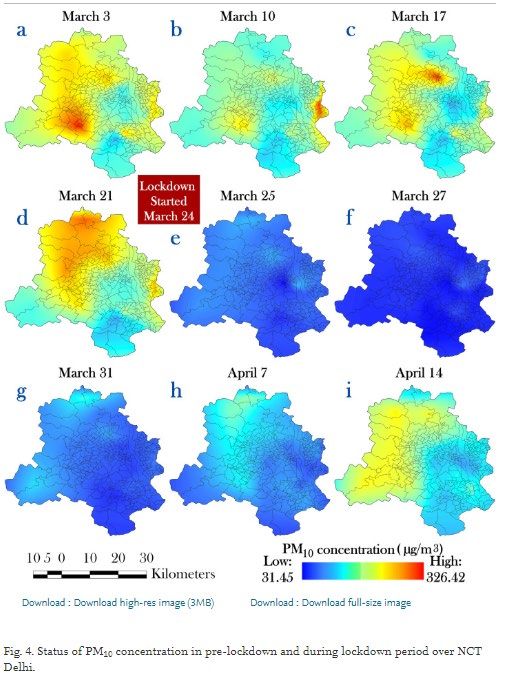
Potential Demand for City Buses in INDIA
 • As per the Indian transport policy there should be 50 buses per       According to
   100K population.                                                     rough estimate
 • Based on this there is total requirement of around 160K buses in    this will prevent
   the city transport against only around 40K today.                      net foreign
 • Graph below proposes the annual volume of EV buses to be           exchange outflow
   purchased every year until 2030 to meet NITI AAYOG’s Target         saving of 5 B $

                                  ~5600

                                    ~600

  Till 2030 > 12,000 to 15,000 EV buses need to be deployed every year
Success Story of EV Buses in INDIA

  • Kolkata deployment of EVs has earned Global recognition

  • Tata Motors EV bus has been
    awarded Golden Peacock Award
    in the Innovative Product
    Category.

  • In General EV buses apart from Zero
    Emission have confirmed the low
    running cost in Rs/ km as compared to
    Diesel / CNG vehicles.

                                       11
Challenges of E Mobility Specifically wrt Buses
             Commercial
             In spite of all good intentions, the progress has been slow:
                         Govt. Subsidy          High Initial
                         must                   Cost                        GCC Model

                • Operators need to
                  provide Bank                                                 Repeated
                  Guarantee                                                    Cancellations of
                • High cost of Funds                                           Tenders
                • Need for long                 High Anxiety
                  duration funding                  and                       New Players
                                                Uncertainty                   Excessive
                Uncertainty of                                                competition
                the Payments

                      In sufficient fare
                      collection.                                       Thin Margins
                      State Govt need to fill      Govt Desire to
                      the viability Gap            keep the Fare Low

                                                       12
Challenges of E Mobility Specifically wrt Buses
 Post COVID Challenges
• Potential Shift from Public Transportation and preference for
  private transport
 Over crowded Buses          EV has been treated
 – Difficult to maintain     as Elite Service and
 Social distancing           preference for Air
 norms                       conditioned buses

 Inadequate buses           Anxiety for traveling
 Longer waiting time        in closed
                            environment

• Vulnerability of Supply Chain
   While big strides have been made in
   localising the supply chain through local
   development of many components and
   systems,
   However for some of the critical high value
   items still are dependent on Imports
        Battery Cells
        Motor and Invertors especially high torque motors

                                                 13
Challenges of E Mobility Specifically wrt Buses

  Technical Challenges
              Challenges                             Potential
 • Vehicle range                     • High Energy Density Batteries
                                     • Improvement in Efficiency

 • Vehicle cost                      • Reducing Batteries cost
                                     • Integration and optimization, of EV
                                       aggregates
 • Battery pack replacement cost     • Longer Battery Life. New Chemistries for
                                       Cathode and Anode. Better Thermal
                                       Management
 • Battery pack life                 • Higher Durability and Reliability of Various
                                       components and systems

 • Charging
Battery Sizing

     Battery
     Energy                                                            Aux
                                                    Electrical        Motor,,
                                                     loads,,           8%
    Electrical Loads
                                                       3%
 Traction Motor +
     Inverter
                                                               AC
  Air Conditioning                                          System,
  system                                                                  Traction
                                                              26%
                                                                           Motor,
 Battery cooling system                                                     63%

 Traction cooling system AC Usage
                                                           Electrical Power
                          Weather
                                                            consumptions
 Electrical Loads
                                                    AC consumes almost 26%
                                                    of the Battery Capacity

 Traffic, Weather and AC usage has a very significant influence on the energy
 consumption and there by Range and influence on Battery sizing
RANGE

 E-Buses can run on all routes and get charged during breaks

                                                                            Full charge ~ 2hours
       1                                                             4   60 km top-up ~ 1hr
                                       2
                  Start of day                Daily Operation                  End of Day
            (All buses start from a         (Vehicle operated on              (All batteries
             specific point in plant         designated route till            recharged at
               with full charges)                 shift-end)               respective points in
                                                                                  plant)

Generally the authorities are not
comfortable with opportunity
charging and want only one             3
                                              Shift changeover
charging in night. There by                (Vehicles come back to
necessitating the bigger battery             respective point for
                                             shift change, top-up
and hence cost.                             charging to be carried
                                                      out)
WAY Forward

               Commercial Levers

         • Cost Optimisation                            • Fair Tendering Process
               Aggressive localisation.                         Repeated cancellation and
               Shift from Built to Print to FSS                  retendering to be avoided.
                suppliers
                 • Invest in R&D and    System
                    Design ,testing and             Willing
                    validation capability
                                                   Operators
         • Favourable Funding
           Options
               Lower Cost of Funds for Operators in        • Transparent and Automatic
                line with MSMEs
               Funding for project duration (8 ~10
                                                              Payment process
                Yr)
               No Bank Guarantee

                                                       17
Make In India – Cost Optimization

                      Pack        EV Motors                          Vehicle
                                                      Charging                      Component                           Mobility
  Cell Mfg         Integration        &                              Control                         Vehicle Mfg
                                                      Solutions                     Integration                         Solution
                     & Assy       Component                          Strategy

 Production &      Module        EV Components ,                  Vehicle control    Component                         ITS system,
                                 Motors, Inverters,   Charging    Software and                       Chassis & Body    telematics and
 Assembly of       Integration                                                       Integration &
                                 cables , DC DC       Solutions   energy                             manufacturing &   Remote
 Single Cell &     for Vehicle                                                       Assembly
 Modules           Pack          Converters etc                   Management                         Commissioning     Diagnostic

                                                                                              OEM

                    TACO has established activities for play in EV eco system

                                                         TATA Group

                 Tata Group has initiated Companies for Localization in next 2-3 Years
Cost Optimization
 Significant strides have been made in achieving cost optimisation
 aided by:
           •   Localisation for system and components
           •   Battery Packs
           •   Motors and Invertors
           •   HVAC

       Base Vehicle                    EV Phase -I        EV Phase -II

               0%                                               7%
                    17%                      10%                     9%
                                               8%
                                                3%                    3%
                                                                       4%
                                       53%      10%                    0%
     56%                   21%                  0%      57%
                                              16%                     20%

                    0%6%
WAY Forward

               Technical Levers

         • Improve Energy Efficiency                   COVID Compliant
                                                               Individual Seat Layout
               Optimisation of system and                     Shift to Positive Pressure
                components                                      Ventilation /improved Ventilation
               Innovative strategies
                                             Improved
                                               TCO
         • Optimisation of Battery
           Size
               Based on the Duty cycle and Routes        • Non AC Buses may be
               Trade off between Life cycle and
                Initial Investment
                                                            adopted
               Opportunity Charging

                                                     20
Modified Seating Layout
          • Modified Bus Layout to avoid close contact between
            Passengers
          • Pressurised Ventilation Or Optimisation of Windows sizes
          • HEPA Filters

                                           21
AC Vs Non AC Bus

 AC has very significant influence on the Power Consumption
     Low Average speed due to high congestion
     High Idling
          As a result while the number of Hrs run of AC remains same, the number of kms run are
           lower hence kWh / km is high.
     Temperature setting

             Energy Cons. kWh/km                          260kWh          218 kWh
               0.9
                           0.833
                                      0.7

              23Deg C    25Deg C      Non AC                  25Deg C     Non AC
                                                         Battery Size for 200km Range with
                AC Temp Setting
                                                         80% DOD and 100 to 20 % SOC

                                                 22
Viability Gap Analysis

            •   With battery prices dropping to $ 200 ,
            •   Electricity cost Rs 8
            •   Interest cost 8 %
            •   Funding for 10 years

                 On Total Cost of Ownership the EV can be commercially Viable on TCO Basis

                                                                      Source :Tata Motors Data
Sustainable Mobility

     In country like INDIA there is a huge need and dependence on
     Public Transport

     For Sustainable Mobility there is a strong case to have more
     and more E Buses on the road

                                          Source; ev Infographics
Thank You
Mr. Gerald Ollivier
Lead Transport Specialist, Transport Global Practice @ The World Bank
                                                                        ›
Busworld Academy Webinar

Outlook on Electric Buses in India
16 July, 2020

Gerald Ollivier
Lead Transport Specialist

27                                   Outlook on Electric Buses
Key Role of Buses                        Buses offer several advantages to the transport systems
                                                                        Buses can go everywhere in a city and “feed”
                                                 Comprehensive          rail/metro services and provide connectivity to the
                                                                        peri-urban and rural areas around the city

Buses will always be the mode                                           Buses are cheaper than other transport infrastructure –
that reaches every part of the                   Low cost               both capital and ongoing costs per passenger
                                                                        kilometre
city, in any scenario

                                                                        In right conditions, expansion can be rapid, especially
Their capacity can be rapidly                    Fast and scalable      where the private sector is harnessed
increased for modest capital
input
                                                                        Urbanisation will re-shape cities and how they are
                                                 Flexible               used. Bus networks can adapt as cities change
Buses need to be put at the
centre of policy and
                                                                        Per passenger trip, buses emit just 10-25% of the
developed to full capacity,
                                                 Environment Friendly   particulate matter and CO2 vs. other transport modes,
even if metro systems are                                               a number further reduced with E-buses
implemented
                                                                        A national policy and programme can have far
                                                 Locally driven         reaching implications – implemented and shaped
28                                                                      locally to meet the needs of different states and cities
             Outlook on Electric Buses
But Low Supply of                        Indian Cities have poor service level of buses
Buses
                                         Buses/ Lakh Population
                                         250

Cities with well functioning
transport systems globally               200

have 100-200 buses per lakh
people while most Indian
cities are far below 50 buses            150

per lakh people
Bus supply in Indian cities has
not kept up with growth in               100

population and personal
vehicles
                                          50
FAME-I & II are the largest
national level programs for
increasing bus supply since
JNNURM.                                     0
                                                 Moscow   Hong    London   Tokyo   Paris   Beijing   Madrid   Tehran Singapore Chicago Bengaluru   Delhi   Mumbai
                                                          Kong
29                                         Source: UITP
             Outlook on Electric Buses
A Gradual Shift
Status of FAME Schemes and                                                                                         Sanctioned subsidy for 2,488 buses through
                                            435 Operational E-Buses (FAME I; SmartCity)
                                                                                                                         FAME II (Contracting underway)
Market Size
                                                                   GCC       Outright Purchase                                          9m Bus    12m Bus
FAME I & II schemes have been             160                                                                  800     750
                                                  140
the key drivers of e-bus market
                                                                                                                               575
                                                                                                               600
in India; Pune (~140 buses) and           120

Ahmedabad (40 buses) are the              80
                                                            75                                                 400
                                                                                                                                          380
                                                                                                                                                  260
only exceptions.
                                                                 40     40    40    40                         200                          140
                                          40                                              30                                      100                                     98
~500 e-buses are currently                                                                       15    15                50                          70     65 70

operational across India. 2,488             0
                                                                                                                   0
                                                                                                                        PMI    Olectra    TaMo     JBM       AL      Mytrah
sanctioned subsidy for                            PUN       HP   HYD   AHM   LKO   KOL    N  J&K      GAU
                                                                                                                       Foton    BYD               Solaris
                                                                                         MUM
procurement under FAME II, out
                                          Forecasts: Phase I Likely to be Led by Govt. Subsidy; Expansion by Viability & Access to Financing
of the target of 5,595 buses, to
                                                                       2020: 830K Buses                                          2030E: 25% E-Buses
be rolled out over the next year.
                                                STU-Urban
Limited participation observed
in recent bids while many
tenders were cancelled due to
                                                STU-Intercity                                                  ?                                                  E-Bus
                                                Pvt Stage
                                                                                                                                                                  ICE/ CNG
higher than expected bids.                      Carriage
                                                Pvt Contract
                                                Carriage
What will drive pace?                           Pvt Others

30                                        Source: Current total buses based on Road Transport Year Book 2016
              Outlook on Electric Buses
Key Drivers: Economics                   TCO Comparison: AC E-Bus vs. ICE bus
1. Total Cost of Ownership
                                         INR/ Km

                                                                       Illustration (70,000 km/ year)
(TCO) for e-buses vs. ICE                                                                                                                                   57,000 km/year               168,000 km/year
buses                                            98.0                         87.5                        101.1                        68.0                      100.7                         54.5

                                                                                                            19,7                                                      17,7
                                                  16,8
                                                                                                                                                                                 Two examples provided here;
Even at current prices, TCO of                                                                                                                                                   FAME II bids saw a 65%
                                                   6,6                         16,8                                                                                              variation in cost between
electric AC buses is                                                                                                                                                             highest and least quotes
                                                                                                                                                                                 received across cities
competitive Vs. BS-VI AC                           9,8                                                      25,5
                                                                                6,6
                                                   2,1                                                                                    8,6
buses. However, as most STUs                       9,0
                                                                                7,2
                                                                                2,1
operate non-AC buses, the                                                       9,0
                                                                                                             4,8
                                                                                                                                         15,7                                                      6,0
more relevant comparison is                       17,1                                                      14,5                          1,8
                                                                                9,3                                                                                   83,0
with non-AC BS-VI buses                                                                                                                   5,4

which cost 30% lower than e-                      14,4                         14,4                         14,4                         14,4
buses despite subsidy                                                                                                                                                                              48,5

                                                  22,0                         22,0                         22,0                         22,0
Significant variance in bids
received under FAME II.
                                                E-Bus                  E-Bus wSubsidy                BS VI AC Bus              BS VI Non AC Bus             Intra-city GCC Bid           Inter-city GCC Bid
                                                 GCC Bid        Driver      Conductor         Bus Cost        Battery Cost        Charging Infrastructure           Interest      Fuel      Maintenance
                                         Source: World Bank Analysis, FAME II Bids for a Tier 1 City and Large State
                                         Note: (1) TCO varies significantly based on operational characteristics like service-km per day, business model choices like outsourcing ownership and operations along
                                         with the terms of outsourcing; (2) Key assumptions for illustrative working: AC E-Bus (ex-battery) cost of INR 1.20Cr; Battery cost of INR 18,750/ kwh and battery size is 250
31                                       kwh; 100% debt financing at 10.0% interest; Average speed of bus assumed at 18km/hr; 10 year operations; Electricity cost at INR 5/ kwh; Diesel at INR 64/ lit; Battery
             Outlook on Electric Buses   range and charging time assumed to meet operational needs
Key Drivers: Economics Battery Cost Has Potential to Drop by 30-40%
2. Battery Cost
                                          Battery Cost in India to Decline from $230/kWh in 2018 to $143/kWh by 2024

Reduction in battery cost is
likely to be a key driver for
adoption of electric vehicles.

                                          Source: Bloomberg NEF, SIAM, Tesla, CRISIL Research

                                          The Indian government is seeking to reduce import dependence and increase localization of EV batteries
                                          through the phased manufacturing program (PMP), which is valid till 2024. This incentivizes companies to set
                                          up integrated battery and cell giga factories (battery production capacity upward of one gigawatt-hour) for
                                          manufacturing and assembling lithium batteries in the country. Countries with giga factories, such as China and
 32                                       South Korea, are known to have battery costs that are around 20-30% lower than the global average.
              Outlook on Electric Buses
Key Drivers: Finance
1. Create viable options
                                                     Projected STU Financial Performance February
                                                        2020/2021 (INR cr) with/without COVID

                                                                                                     Financing and Funding
                                          90000

                                                  81267
With COVID-19, STU finances               80000           76526
have been deeply impacted,
                                          70000
                                                                                                    Enhance Revenues:
leaving limited room to further                                                                     Vehicle Registration Tax, Annual
increase the deficit, as E-buses          60000
                                                                      60332
                                                                                                    Vehicle Tax, Fuel Surcharge
would.
                                          50000

                                                                                          40830     Rebalance Expenditures within
Before undertaking new                    40000
                                                                              35696                 State or City budgets
projects, a clear vision for bus          30000
transport at national, state and                                                      20935
city levels, backed by                    20000

supplemental funding is                                                                             Adjust fares
                                          10000
required.
                                             0
                                                     Costs              Revenues         Deficit

                                                                  Pre-COVID   COVID

 33
              Outlook on Electric Buses
Key Drivers: Finance                     Business Model                                     Market   Commercial   Key Comments
2. High Potential Use Cases                                                                  Size     Potential
with Private Participation
                                         Gross Cost Contracts (GCC)                                               • Risks for STU in terms of financial
                                         Vehicles owned and operated by private entity                              sustainability of E-Bus operations
                                         with per-km payment by STU                                               • Concern on certainty of payment for private
                                         Eg: FAME II tenders, Pune                                                  operators and contract bankability & terms
The high potential business
models will be evaluated in              Financial Lease (Public Transport)                                       • Lower upfront costs
consultation with State                  Vehicles leased and operated by STUs or private                          • Unclear tax implications
                                         entity against a fixed rate/km                                           • Considered as asset in balance sheet
Transport Undertakings                   Eg: Cities in China                                                      • VGF subsidy may still be required
(STUs), Original Equipment
Manufacturers (OEMs) and                 Unbundled Model (Public Transport)                                       • Less upfront costs
                                         STU / Operator procure bus and lease battery                             • Lack of FI’s/NBFC’s or leasing companies
operators.                               Eg: Proterra in USA                                                      • Lack of re-use/re-cycle market impacting
                                                                                                                    development of leasing options

The TCOs for each of these
                                         Aggregator Model (Public Transport)                                      • No policy/regulatory environment for such a
models and key policy                    Aggregator (SECI or DISCOM in LAC) procures                                model
                                         the e-bus and batteries and leases to operators.                         • Lack of DISCOM or aggregator which has
enablers needed to promote               Eg: Costa Rica                                                             expertise to play this role
the model will be identified.
                                         Private Intercity Buses                                                  • No FAME subsidies available
                                         Vehicles operated by Service Provider; Vehicles                          • Need for distributed charging infrastructure,
                                         may be owned or leased                                                     common charging, depot and terminal
                                         Eg: Purple Mobility Mumbai-Pune                                            facilities
34
             Outlook on Electric Buses
Key Drivers: Institution
Operational Capabilities                                   Battery size                        Mileage
Required for Successful
Operations                                               Battery life cycle

                                                        Type of charging
The introduction of electric buses
requires State engagement, as
                                                         Range of travel
the complexities associated with                                                           Seating capacity
charging and higher upfront
                                                         Seating capacity
costs are substantial. The process
must take into account several            Electric        Physical body          Diesel
more factors when deploying an              Bus           characteristics         Bus
electric bus than a diesel bus.
                                                           Idle time
STUs need to understand the                                                                 Physical body
need for a completely different                                                             characteristics
                                                      Location of charging
approach to vehicle deployment                              stations
and scheduling, due to the
                                                     Skill set for maintenance
intersection between charging
requirements, range and
                                                     Climate; Energy for AC
operating schedule.
                                                                                          Maintenance costs
                                                      Additional space for
                                                     charging infrastructure
35
              Outlook on Electric Buses
Moving Forward                              Current situation and areas of improvement
1. Improving E-bus
                                            Allow different types of bidders   • Eligibility criteria for service providers vary between cities currently
Tendering by STUs
                                                                               • Need to create a National level pool of pre-qualified e-bus service
                                                                                 providers

                                            Encourage more bids per tender • Bidding criteria need to be made more investor friendly to attract higher
Discussions with STUs, OEMs,                                                 number of bids per tender to increase competition and reduce costs
operators and consultants
suggest certain key gaps in
                                            Evaluate Total Cost of             • Cities need evaluate Total Cost of Ownership (TCO) over lifecycle
tendering process for electric
                                            Ownership (TCO)                      including staff, bus and infrastructure costs in addition to the current
buses in India.                                                                  Least Cost (L1) based evaluation

                                            Define technical and functional    • Functional specs like list of depots and routes need to be clearly defined
Tendering of e-buses in India
                                            specifications clearly               in the tenders to enable accurate estimation of costs and risks
needs to evolve into a
partnership between STUs and
                                            Adopt consultative tendering       • The tendering process needs to evolve into an equal partnership
service providers which is
                                            process                              between the STUs and service providers towards overall improvement in
based on a more consultative                                                     service quality and not just being a client-vendor relationship
tendering process and clear
definition of obligations of                Procurement timelines to allow     • Rushed timelines have previously resulted in inadequate consultation and
                                            adequate consultation and            review of tender conditions.
both parties.                               course correction
                                                                               • Tenders need to be adequately spaced out to allow consultation and
                                                                                 course correction to arrive at the appropriate specifications
36
                Outlook on Electric Buses
Moving Forward
2. Improvements to the                      Legal and Financial Considerations                      Payment Terms
Master Concession                         • 10 vs.16 year contract tenure to suit   •   Standardized payment timelines
Agreement
                                            battery life, loan tenure and payback   •   Certainty of payments via
                                            assessments                                    - Escrow mechanism
Discussions with STUs, OEMs,              • Reduced bank guarantees to lower               - Letter of Credit by State Govt.
operators and consultants                   cost of financing                       •   Annual escalation mechanism to
suggest certain key gaps in
                                          • Flexible SPV structure esp. for OEMs        include:
contracting of electric buses in
                                            with ability for exit/ new investors           - Wage and energy cost inflation
India. Suggestions revolve
                                          • Clearly defined authority and                  - General inflation
around key themes:
                                            operator obligations
 • Clear and detailed disclosure                                                               Defining Penalties
                                          • Objective staffing qualification
 • Standardized practices
                                            criteria                                •   Simplify Service Level Agreements
 • Transparency in process
                                          • Infrastructure responsibilities         •   Practical timelines for SLA reports
 • Commitment to adhere to
                                          • Detailed training requirements          •   Allowance for external events like
   responsibilities of the STU
                                                                                        traffic congestion
 • Alignment to on-ground
                                                                                    •   Linking penalty and payment timelines
   facts and situations
                                                                                    •   Including incentives in addition to
                                                                                        penalties

37
              Outlook on Electric Buses
Moving Forward                                                   Operator                            OEM                        STU                  Intervention
3. Access to Financing and
Bankability                                              • Even the largest private      • Key OEMs have a A+            • Not applicable           • Equity infusion
                                            Credit         intra-city operators have a     credit rating (CRISIL) with                                into private bus
                                                           small scale and limited         significant size and scale                                 operators
                                          Worthiness:
                                                           credit quality.                 to take leverage                                         • Development of
                                           Balance       • Largest private bus           • However, OEMs are not                                      institutional
                                            Sheet
Access to financing for the                                operators have at best          keen to be primary                                         leasing partners
                                           Metrics         BBB+ rating (CRISIL)            principals in provision of
current GCC model for bus                                                                  bus services
services is limited by the weak
                                                         • EMI payment dependent         • EMI payment dependent     • Security of payments         • Escrow for ticket
financial profile of bus operators                         on receipt of cash flows        on receipt of cash flows                                   collection
                                          Repayment                                                                    impacts access and cost
and the poor track-record of               Capacity:
                                                           from STU                        from STU                    of finance                   • Sovereign
                                                                                                                     • For the same private           payment
timely payments by STUs.                   Cash Flow
                                                                                                                       operator with GCC              guarantee
                                           Certainty                                                                   contracts access of
In addition to the improvement
                                                                                                                       financing is different
in the MCA, additional market                                                                                          depending on STU
                                          Liquidation:   • Robust secondary market for ICE commercial vehicles; Used vehicle estimated at 3-5x      • Vehicle/ battery
interventions will be required to
                                             Viable        the units sold for new commercial vehicles                                                 buy-back by
attract capital.                           Secondary     • Secondary market for electric vehicles yet to develop                                      OEMs
                                             Market

                                          Recommended Changes to MCA to Increase Bankability of Contracts:

                                          Risk Sharing                                Termination                                  Payments
                                          Based on which party has influence          Currently heavily in favor of                Terms during termination are
                                          over applicable conditions. Eg: Risk        contracting authorities which                currently not covering operator/
                                          of traffic on operations                    reduces bankability of the project           OEMs min payment responsibilities
                                                                                                                                   to financing institutions
38
              Outlook on Electric Buses
Moving Forward
Summary                                   1                                   2
                                              Addressing Limitations in
                                                                                     Improvements to MCA
                                                 Tendering Process

Improvements to the tendering
process and the MCA will lay the                           3
foundation for establishing a                                        Access to Finance
robust E-bus market by creating
the right environment for
qualified bidders and financiers.

                                                                  More Qualified Bidders

                                                                  Competitive Bid Pricing

                                                               Robust, Growing E-Bus Market

39
              Outlook on Electric Buses
Dr. Sajid Mubashir
Scientist G, Department of Science & Technology, Member-secretary, DHI-DST Technology
Platform for Electric Mobility
                                                                                        ›
Electric bus
Technologies
Make for India
EV bus for the Tropics

Sajid Mubashir,
Scientist G, Department of Science & Technology
sajid@nic.in
Electric buses are at inflection point

       China has 4 lakhs Electric buses; 98% of
        the global electric bus population
          Europe has 4000 electrified buses, which is 20%
           of annual sales
          United States eBus is 0.5 % of market.
       In India, 75000 buses are sold every year
          even a small conversion to eBus is significant
FAME scheme adds 7000 eBuses

      Can’t choose technologies initially
         We can learn from world class buses deployed.
      Most buses are from BYD
         Battery weighs +3 tons. Lithium iron phosphate
          battery that are safe, but still need cooling to be
          effective.
         On board charger of 80 kilo watts
         Hub mounted Motors; motor is inside the wheels
         BYD bus carries its own charging apparatus. But
          it takes whole night to charge & battery is big
          enough for the bus to run the whole day
Batteries for Electric buses

 The city bus operate on define routes with known
  passenger load. So energy use is predictable
   City bus operations are energy efficient and regenerative braking is
    possible due to frequent start stop operations
   Generally a trip length is
Fast or Opportunity Charging eBus
Charging Concept linked Battery Type

     Two types of batteries are used on Electric buses
     Lithium iron phosphate
        Developed by Arumugam Manthiram & John Goodenough
        Non toxic, uses abundant iron, excellent thermal stability &
         safety.
        Good electrochemical performance & capacity.
        In short it is a good for India.
     Lithium titanate oxide
        Use lithium titanate nanocrystals instead of carbon. Surface
         area of 100 sq.m/g compared to 3 sq.m/g for carbon.
        Very fast charging & provides high currents when required.
        Long cycle life 10000 cycles at 25 degree
        At 55 degrees it still gives 1000 cycles
eBus is Trojan horse for battery

 BYD bus carries 3 tons battery & Yutong has even bigger
  battery.
 Yutong also uses fast charging battery from Microvast.
   Smaller in size but needs dense charging infrastructure
 LFP & LTO are recommended batteries for eBus in India
  due to the tropical climate
   ACC (Battery Cell) manufacturing mission must be linked to the
    spread of Electric buses in India, since such large volume Bus
    battery is required.
   These two battery types are priority, since they meet the strategic
    goals of higher ambient temperature & more indigenous material.
You can also read