Overview of Rates Proposal for FY 2021 and FY 2022 Public Hearing Presentation, August 5, 2020 - District of Columbia Water and Sewer Authority ...
←
→
Page content transcription
If your browser does not render page correctly, please read the page content below
Overview of Rates Proposal for FY 2021 and FY 2022
                Public Hearing Presentation, August 5, 2020
                 District of Columbia Water and Sewer Authority

Blue Plains Advanced Wastewater Treatment Plant                      1
Purpose
Provide information on the rate proposal and hear from our customers

                                                                       2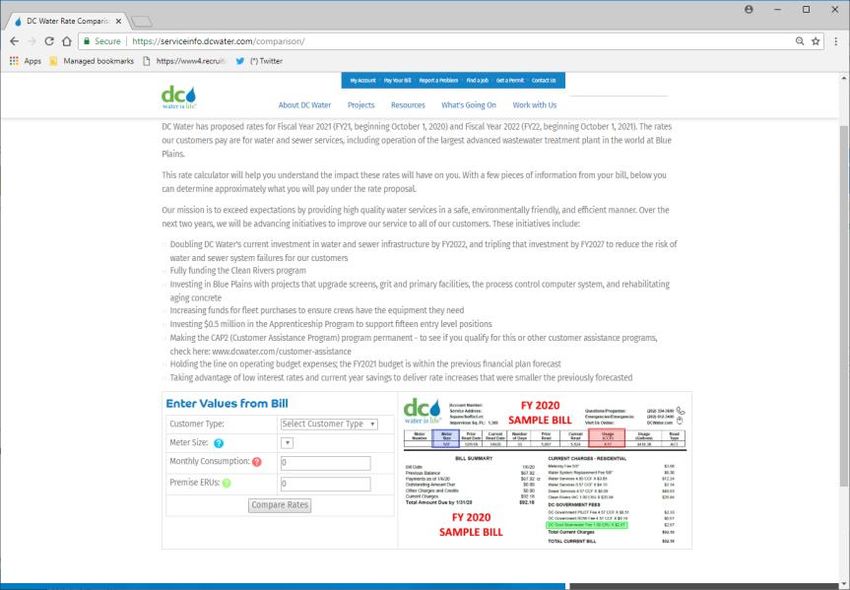
Customer Assistance
For information on customer assistance programs, please visit www.dcwater.com/customer-assistance

CAP
 • Provides a discount on the first 400 cubic feet (3,000 gallons) of water, sewer, PILOT and ROW services
   used each month. Eligible households will receive a 75 percent reduction in the monthly CRIAC fee and a
   Water Service Replacement Fee waiver. The monthly discount is approximately $77 a month

CAP 2
 • Provides a discount on the first 300 cubic feet (2,250 gallons) of water and sewer services used each
   month (with the exception of PILOT and ROW fees) and a 50 percent reduction in the monthly CRIAC
   fee. The monthly discount is approximately $50 a month

CAP 3
 • Provides a discount of 75 percent off of the monthly CRIAC. The monthly discount is approximately $15 a
   month.

                                                                                                             3
Customer Assistance
Emergency Residential Relief Program
• Eligible households may receive bill assistance up to $2,000 as a one-time emergency benefit
S.P.L.A.S.H. (Serving People By Lending A Supporting Hand)
• Provides one-time assistance. Administered by Greater Washington Urban League. Funded
by donations from customers, community and DC Water employees
Nonprofit Relief Program
• Assists eligible organizations with Clean Rivers Impervious Area Charge (CRIAC).
Participants can receive credits of up to 90 percent of the CRIAC portion of their water bill
4Budget, Rates, Capital Program, and Financial Plan
Fully funds the Clean Rivers Program
Doubles DC Water’s current investment in water and sewer infrastructure by FY
2022 to reach a one percent replacement cycle and triples the investment by FY
2027 to reach a1.5 percent replacement cycle
Operating Increases funds for fleet purchases by $4 million to ensure crews have the
expenditures
and
Financial policies equipment they need
and metrics
infrastructure
investments Continues the shift of a portion of Clean Rivers costs from the Impervious Area
Charge to the sewer volumetric rate, bringing more equity to Clean Rivers funding
Makes the CAP2 program permanent and expands CAP benefits to 75% of the
CRIAC
Rates
Takes advantage of low interest rates and current year savings to deliver rate
increases that are smaller than previously forecasted
Applies $13 million in Rate Stabilization Funds over FY 2021 and FY 2022 to
benefit customers
5COVID-19
Customer Focus
• Reconnected customers and suspended customer disconnections for non-
payment
• Suspended late fees
• Partnered with District for the Emergency Relief to District residents
• Suspended placing liens
Overall consumption decline
• Residential, Multi-family, and DC Housing Authority consumption is up
• Commercial, Municipal, and Federal consumption is down
Revenue (Cash Receipts) Impacts
• Increase in delinquencies
• Decrease in Permit Fees, Development Contractors Fee (water and sewer),
Late Fees, System Availability Fee and Waste Hauling Disposal Fees
6Outreach
Delayed the ratemaking process to ensure that there was
time and a venue to hear from customers
• Public Hearing moved from June 10th to tonight, August 5th
Ward Town Halls were made virtual
• Participation in the Ward Town Halls was 4,276 in FY 2020, as compared
to 52 in FY 2019
A Business Town Hall was also conducted on July 29 to
ensure that we had conversation with non-residential
customers
All of DC Water ratemaking materials are posted at
www.dcwater.com/ratemaking-process
A Rate Calculator is on the website to allow customers to
enter their consumption, meter size, and impervious area to
better understand the impact of the rate proposal
7Customer Assistance
Participation in the Customer Assistance Programs (CAP) has increased
this year, as a result of the pandemic and aggressive advertising and
outreach
• CAP has served 4,333 customers through June, as compared with 4,436 during the
entire previous fiscal year
• CAP2 has served 575 customers this year versus 191 during all of FY2019
• CAP3 has helped 104 customers as compared with 48 last year
The new emergency relief program, funded by the District, is for
residential customers who are eligible for any of the CAP programs
• Customers can receive up to $2,000 as a one-time credit
CAP2 program made permanent, CAP expanded to 75 percent CRIAC
credit
SPLASH – the SPLASH program offers assistance to families in need so
that they can maintain critical water and sewer services until they get
back on their feet. SPLASH has served 105 households through June, as
compared to 276 during the entire previous fiscal year
8
More information is available at www.dcwater.com/customer-assistanceFY 2021 Operating: Sources and Uses of Funds
$ in thousands
Sources - $733.7 Million Uses - $733.7 Million
Wholesale Other Pay-Go,
$81,986 Revenue Residential other
11.2% $64,608 $130,803 $115,457
ROW
8.8% 17.8% 15.7% Personnel
Metering Fee $5,100
0.7% Services
$15,405
$153,482
2.1% PILOT 20.9%
$17,272
Water System 2.4%
Replacement Contractual
Fee Cash Services
$39,717 Financed $88,532
Commercial
5.4% Capital 12.1%
$180,589
Improvements
Rate 24.6%
$30,355
Stabilization
4.1%
Fund
Water
$2,500
Purchases
0.3%
$36,250
Municipal & Federal Debt Service Small 4.9%
Housing Government Multi-Family $222,268 Equipment Chemicals
$30,318 $77,571 $110,241 30.3% Utilities and Supplies
$1,030
4.1% 10.6% 15.0% $27,911 $36,081
0.1%
3.8% 4.9%
9FY 2021 Capital: Sources and Uses of Funds
$ in thousands
Sources - $507.6 Million Uses - $507.6 Million
Interest EPA Grants /
Income on CSO
Bonds Appropriations
$6,365 $28,464
1.3% 5.6%
Wholesale
Capital
Payments
Pay-Go $95,205
Financing 18.8%
$133,627
26.3%
Revenue
Bonds /
Commerical
Paper / EMCP
$243,929
48.0%
10Overview of Rates Proposal
Multi-year rate proposal, FY 2021 and FY 2022
DC Water advanced the Cost of Service Study to align it with the rate proposal
Combined rate increase for average household customer lowered from 8.1% forecasted last year to 6.6% for FY 2021 and from
6.9% to 6.7% for FY 2022
• Proposed annual water and sewer rate increase of 9.9% for FY 2021 and 7.8% FY 2022
• Continue Shift of CRIAC to sewer volumetric of 28% and 37% for FY 2021 and FY 2022 respectively
Proposed CRIAC of $19.52 per ERU in FY 2021 and $18.40 per ERU in FY 2022
• Water System Replacement Fee (WSRF) remains the same
• Customer Metering Fee increases to cover Customer Service costs
• PILOT Fee for FY 2021 and FY 2022 will increase by $0.03 and $0.02 per Ccf respectively and Right-of-Way Fee will remain
the same at $0.19 per Ccf
• Increase the Clean Rivers IAC discount for CAP customers from 50% to 75% and CAP2 Program made permanent
11Customer Metering Fee
In FY 2019, the Metering Fee recovered $11.6 million
• In FY 2003, established Metering Fee at $2.01for 5/8” meter
• In FY 2011, increased Metering Fee to $3.86 for 5/8” meter
• Originally fee amount set to cover the capital costs of the original Automated Meter Infrastructure (AMI) system
and meter purchase and installation (debt service) plus about $4 million of Customer Service costs
Current Cost of Service Study recommends recovering $24.1 million in FY 2022, consistent with independent rate
review recommendation
• Includes costs associated with metering and billing
• Customer assistance, shutoff/restore, and leak adjustment etc. remain in the volumetric charges
• Proposed FY 2021 fee recovers $15.4 million, all the debt service and coverage plus about half of the full
Customer Service O&M allocation ($4.96 for a 5/8” meter)
• Proposed FY 2022 fee adds the additional half of Customer Service allocation for a total of about $24.1 million
($7.75 for a 5/8” meter)
12Rate Stabilization Fund
Budget proposes $13 million withdrawal over FY 2021 and FY 2022
• $8 million in debt service savings in the current fiscal year, plus remaining $5 million withdrawal from
Rate Stabilization Fund to be deposited in FY 2020
Apply $2.5 million in FY 2021 and $10.5 million in FY 2022
13Revenue Comparison by Customer Class
Total revenue is projected to increase by $35.8 million or 5.1% for FY 2021 and $32.6 million or 4.4% for FY 2022
mainly due to rate increases
Retail revenue is projected to increase by $35.1 million or 6.4% for FY 2021 and $23.0 million or 3.9% for FY 2022
due to rate increases for both years
Wholesale revenue is projected to decrease by $0.6 million or -0.7% for FY 2021due to low flows and increase by
$2.5 million or 3.0% for FY 2022 due to 3.0 percent escalation
$ in thousands FY 2021 vs FY 2022 vs
Revised Proposed Proposed
FY 2020 FY 2021
FY 2020 FY 2021 FY 2022 Incr/(Decr) Incr/(Decr)
$ % $ %
Retail Revenue $549,553 $584,644 $607,652 $35,091 6.4% $23,008 3.9%
Wholesale Revenue
Potomac Interceptor (PI) 2,715 3,547 3,547 832 30.6% - -
Loudoun County Sanitation Authority (LCSA) 7,758 7,648 7,983 -110 -1.4% 335 4.4%
Washington Suburban Sanitary Commission (WSSC) 57,284 55,952 57,630 -1,332 -2.3% 1,678 3.0%
Fairfax County 14,782 14,839 15,285 57 0.4% 446 3.0%
Total Wholesale Revenue $82,539 $81,986 $84,445 -$553 -0.7% $2,459 3.0%
Other Revenue 66,887 64,608 63,701 -2,279 -3.4% -907 -1.4%
Rate Stabilization Fund - 2,500 10,500 2,500 - 8,000 320.0%
Total Revenues $698,979 $733,738 $766,298 $35,759 5.1% $32,560 4.4%
14Proposed FY 2021 & FY 2022 Rates, Charges & Fees
Approved Proposed Proposed Incr. /(Decr.) Incr. /(Decr.)
Units FY 2020 FY 2021 FY 2022 FY 2021 FY 2022
$ % $ %
DC Water Retail Rates – Water:
Residential – Lifeline (0- 4 Ccf) Ccf $3.06 $3.49 $3.63 $0.43 14.1% $0.14 4.0%
Residential – (> 4 Ccf) Ccf 4.10 4.50 4.74 0.40 9.8 0.24 5.3
Multi-family Ccf 3.54 3.96 4.15 0.42 11.9 0.19 4.8
Non-Residential Ccf 4.25 4.65 4.91 0.40 9.4 0.26 5.6
DC Water Retail Rates – Sewer Ccf 8.89 9.77 10.64 0.88 9.9 0.87 8.9
DC Water Clean Rivers IAC ERU 20.94 19.52 18.40 -1.42 -6.8 -1.12 -5.7
DC Water Customer Metering Fee 5/8” 3.86 4.96 7.75 1.10 28.5 2.79 56.3
DC Water System Replacement Fee 5/8” 6.30 6.30 6.30 - - - -
District of Columbia PILOT Fee Ccf 0.51 0.54 0.56 0.03 5.9 0.02 3.7
District of Columbia Right of Way Fee Ccf 0.19 0.19 0.19 - - - -
District of Columbia Stormwater Fee ERU 2.67 2.67 2.67 - - - -
15Average Residential Customer Monthly Bill
Current Proposed Proposed
` Units FY 2020 FY 2021 FY 2022
(1)
DC Water Water and Sewer Retail Rates Ccf $ 66.25 $ 73.30 $ 78.92
DC Water Clean Rivers IAC (2) ERU 20.94 19.52 18.40
DC Water Customer Metering Fee 5/8" 3.86 4.96 7.75
(4)
DC Water Water System Replacement Fee 5/8" 6.30 6.30 6.30
Subtotal DC Water Rates & Charges $ 97.35 $ 104.08 $ 111.37
Increase / Decrease $ 5.01 $ 6.73 $ 7.29
(1)
District of Columbia PILOT Fee Ccf $ 2.76 $ 2.93 $ 3.04
(1)
District of Columbia Right-of-Way Fee Ccf 1.03 1.03 1.03
District of Columbia Stormwater Fee (3) ERU 2.67 2.67 2.67
Subtotal District of Columbia Charges $ 6.46 $ 6.63 $ 6.74
Total Amount Appearing on DC Water Bill $ 103.81 $ 110.71 $ 118.11
Increase / Decrease Over Prior Year $ 5.11 $ 6.90 $ 7.40
Percent Increase in Total Bill 5.2% 6.6% 6.7%
(1) Assumes average monthly consumption of 5.42 Ccf, or (4,054 gallons)
(2) Assumes average 1 Equivalent Residential Unit (ERU)
(3) District Department of the Environment stormwater fee of $2.67 effective November 1, 2010
(4) DC Water "Water System Replacement Fee" of $6.30 for 5/8" meter size effective October 1, 2015
16Low Income CAP Customer
Monthly Bill
Current Proposed Proposed
Units FY 2020 FY 2021 FY 2022
(1)
DC Water Water and Sewer Retail Rates Ccf $ 66.25 $ 73.30 $ 78.92
DC Water Clean Rivers IAC ERU 20.94 19.52 18.40
DC Water Customer Metering Fee 5/8" 3.86 4.96 7.75
DC Water Water System Replacement Fee 5/8" 6.30 6.30 6.30
Subtotal DC Water Rates & Charges $ 97.35 $ 104.08 $ 111.37
Increase / Decrease $ 5.01 $ 6.73 $ 7.29
(1)
District of Columbia PILOT Fee Ccf $ 2.76 $ 2.93 $ 3.04
District of Columbia Right-of-Way Fee (1) Ccf 1.03 1.03 1.03
District of Columbia Stormwater Fee (4) ERU 2.67 2.67 2.67
Subtotal District of Columbia Charges $ 6.46 $ 6.63 $ 6.74
Total Amount $ 103.81 110.71 118.11
Increase / Decrease Over Prior Year $ 5.11 $ 6.90 $ 7.40
Percent Increase in Total Bill 5.2% 6.6% 6.7%
Less: CAP Discount (4 Ccf per month) (1), (2) (50.60) (55.96) (60.08)
(3)
Water System Replacement Fee (WSRF) (6.30) (6.30) (6.30)
Clean Rivers IAC (5) (10.47) (14.64) (13.80)
Total Amount Appearing on DC Water Bill $ 36.44 33.81 37.93
Increase / Decrease Over Prior Year $ 0.90 $ (2.63) $ 4.12
CAP Customer Discount as a Percent of Total Bill -64.9% -69.5% -67.9%
(1) Assumes average monthly consumption of 5.42 Ccf, or (4,054 gallons)
(2) Expansion of CAP program in FY 2009 assumes discount to first 4 Ccf of Water and Sewer and to first 4 Ccf of PILOT and ROW in FY 2011
(3) Assumes 100 percent discount for Water System Replacement Fee (WSRF) to CAP customers effective October 1, 2015
(4) District Department of the Environment stormwater fee of $2.67 effective November 1, 2010
(5) Assumes 50 percent discount for FY2020 and 75% discount for FY2021 and FY2022 for the Clean Rivers IAC
17Age Ratemaking at DC Water
Municipal utilities rely on industry practice to make their own determination about how to best recover costs through
their user charges
• Financing and Charges for Wastewater Systems, a Manual of Practice published by the Water Environment Federation (2018), suggests that impervious
area-based charges may be used in conjunction with volumetric rates to equitably recover costs of wet weather flows (p.189)
In addition, DC Water’s Board has adopted its own Rate Setting Policy, Resolution #11-10, January 6, 2011:
• Rates that, together with other revenue sources, cover current costs and meet or exceed all bond and other financial requirements as well as goals
set by the Board
• Rates that yield a reliable and predictable stream of revenues, taking into account trends in costs and in units of service
• Rates based on annually updated forecasts of operating and capital budgets
• Rates that are legally defensible, based on objective criteria, and transparently designed
• Rates structures that customers can understand and DC Water can implement efficiently and efficaciously
• Rates increases, if required, that are implemented transparently and predictably
18Establishment of Rates
Water and sewer utilities recover costs in a variety of ways; DC Water’s rates must
be just, equitable, reasonable, well explained, and based on cost of service principles
• The proposed rates are just and reasonable, and they are sufficient, equitable, and consistent in
their proposed application to our customer classes
• Rates support expenditures that have been discussed in detail at the Board’s Budget Workshop,
and in Environmental Quality and Operations, Finance and Budget, and Retail Rate Committee
meetings
• Raftelis conducted the most recent Cost of Service Study, and its results support our rate
proposal
19Age Ratemaking at DC Water
In FY 2020, DC Water conducted a Cost of Service Study (COS) to align the COS with the multi-year rates proposal, therefore
both will be done every two years going forward. Previously, the COS was done every three years.
• The last COS Study was completed in March, 2018 by Raftelis consultants
Reallocated cost from water to sewer since Water System Replacement Fee helped to offset cost recovery by the Water
Volumetric Rate
Reduced the CRIAC based on actual cost outlays
• Prior 2015 COS Study laid groundwork for rate structure changes
Water System Replacement Fee – Established to fund Distribution System Replacement
Class-based Water Volumetric Rates – Established Residential, Multi-Family, and Non-Residential water rates based on
class peaking characteristics
• Periodically, DC Water also reviews all Miscellaneous Fees to ensure full cost recovery
• Raftelis also worked with DC water this year to help ensure that the proposed 28% and 37% shift for the FY 2021 and FY
2022 was calculated appropriately
20Independent Review of Rate
Structure and CAP - Conclusions
An independent review of DC Water’s rates and rate structure found:
• The current customer classes are appropriate and consistently seen in the industry
• The four Ccf monthly water lifeline threshold is appropriate and consistent with benchmarked utilities
• The cost of service study is generally consistent with industry standards for rate making
• The current Metering Fee could be expanded to recover a greater amount of fixed operating and capital costs
• Change proposed in current rate proposal
• Use of the CRIAC to recover consent decree-related capital costs is appropriate
• Use of ERU as the basis for recovering the CRIAC is appropriate
• Given redevelopment in the District, continue to conduct parcel analysis on a regular basis. The analysis should include an
evaluation of the appropriateness of 1,000 sq. ft. as the basis for the ERU for residential parcels
• The current cost elements recovered via the CRIAC are appropriate and should not include wastewater treatment costs
• Recover system costs, including I/I (infiltration and inflow) costs, via wastewater rates and charges as is DC Water’s current
practice
• The approach used to determine the suburban cost allocation for Clean Rivers (7.1%) provides a technical basis for
allocating these costs
21Ten-Year Financial Plan Assumptions
Maintain Debt Service as a percentage of revenue equal to 33.0 percent or less
Maintain combined coverage of 160 percent
Maintain 250 days of cash including Rate Stabilization Fund
FY 2019 actual consumption declined by 1.8 percent. Assumed 1.5 percent
conservation each for FY 2020 and FY 2021 and 1.0 percent in FY 2022 and onwards
FY 2019 Debt Service was lower as compared to budget due to deferring bond issuance
as well as achieving lower interest than projected. The new plan assumed lower interest
rates with slightly lower Debt Service projections
22Historical and Projected Combined Rate Increases
for Average Residential Customer
14.0%
12.2%
12.0%
10.0% 9.2% 8.8%
Residential Bill Increase
8.4% 8.1% 7.3%
8.0%
5.8% 6.9% 8.3%
6.1% 6.2%
5.7% 5.8%
6.0% 5.2% 6.6% 6.7% 6.7%
4.4%
3.4% 4.1% 3.4% 5.2% 5.6%
4.0% 4.5% 4.5%
3.5%
2.0%
0.0%
FY FY FY FY FY FY FY FY FY FY FY FY FY FY FY FY FY
2013 2014 2015 2016 2017 2018 2019 2020 2021 2022 2023 2024 2025 2026 2027 2028 2029
Historical Last Year's Financial Plan (FY 2019 - FY 2028) FY 2021 Proposed Financial Plan (FY 2020 - FY 2029)
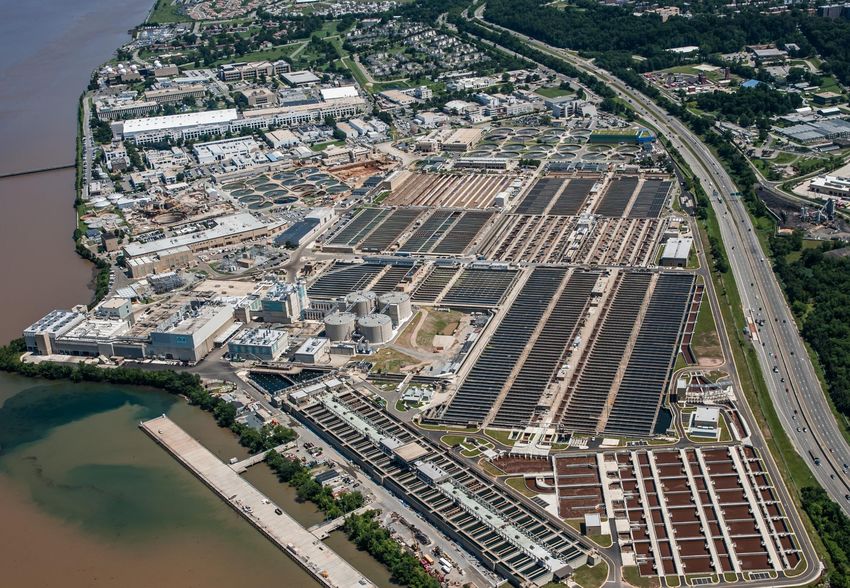
23Projected Average Residential Customer Bill
Projected average monthly residential customer bill ranges from $104 in FY 2020 to
$180 in FY 2029
$180 Clean Rivers IAC
$180 $170
$160
$160 $151
$143 Water & Sewer
$140 $137
Average Residential
$126 Charges
Monthly Bill ($)
$118
$120 $111
Customer
$104
$100 District of
Columbia Fees
$80 (PILOT, ROW &
Stormwater)
$60 Customer
Metering Fee
$40
$20 Water System
Replacement Fee
$0
FY 2020 FY 2021 FY 2022 FY 2023 FY 2024 FY 2025 FY 2026 FY 2027 FY 2028 FY 2029
* Assumes average residential consumption of 5.42 Ccf, or 4,054 gallons, per month. Ccf = hundred cubic feet, or 748 gallons
24Customer Impacts
Residential
2020 2021 2022 2023 2024 2025 2026 2027 2028 2029
Avg. Ccf 5.42, ERU 1
Water & Sewer Rate (%) 11.5% 9.9% 7.8% 8.5% 7.5% 7.5% 7.5% 7.5% 7.5% 7.5%
CRIAC ($/ERU) $20.94 $19.52 $18.40 $19.58 $24.07 $23.07 $23.82 $24.56 $25.64 $26.78
Avg. Customer Bill ($) $104 $111 $118 $126 $137 $143 $151 $160 $170 $180
Avg. Customer Bill (%) 5.2% 6.6% 6.7% 6.7% 8.8% 4.4% 5.7% 5.8% 6.1% 6.2%
Multi-family
Avg. Ccf 86.14, 2020 2021 2022 2023 2024 2025 2026 2027 2028 2029
ERU 6.83
Water & Sewer Rate (%) 11.5% 9.9% 7.8% 8.5% 7.5% 7.5% 7.5% 7.5% 7.5% 7.5%
CRIAC ($/ERU) $20.94 $19.52 $18.40 $19.58 $24.07 $23.07 $23.82 $24.56 $25.64 $26.78
Avg. Customer Bill ($) $1,341 $1,447 $1,538 $1,654 $1,791 $1,896 $2,022 $2,157 $2,304 $2,461
Avg. Customer Bill (%) 8.1% 8.0% 6.2% 7.6% 8.3% 5.9% 6.6% 6.7% 6.8% 6.8%
Commercial
Avg. Ccf 115.82 2020 2021 2022 2023 2024 2025 2026 2027 2028 2029
ERU 14.17
Water & Sewer Rate (%) 11.5% 9.9% 7.8% 8.5% 7.5% 7.5% 7.5% 7.5% 7.5% 7.5%
CRIAC ($/ERU) $20.94 $19.52 $18.40 $19.58 $24.07 $23.07 $23.82 $24.56 $25.64 $26.78
Avg. Customer Bill ($) $2,029 $2,163 $2,285 $2,456 $2,669 $2,814 $2,994 $3,189 $3,401 $3,629
Avg. Customer Bill (%) 6.8% 6.6% 5.7% 7.5% 8.7% 5.4% 6.4% 6.5% 6.7% 6.7%
25Next Steps
Public comments
• Posted and considered
Recommendation for Retail Rates Committee on August 25, 2020
• RRC recommendation to Board
Board meeting to be held on September 3, 2020
October 1, 2020 implementation (FY 2021 rates, charges & fees)
October 1, 2021 implementation (FY 2022 rates, charges & fees)
26You can also read