An uneven recovery: Measuring COVID-19 vaccine equity in Ontario - April 2021 - Wellesley ...
←
→
Page content transcription
If your browser does not render page correctly, please read the page content below
An uneven recovery: Measuring
COVID-19 vaccine equity in Ontario
James Iveniuk
Scott Leon

                                     April 2021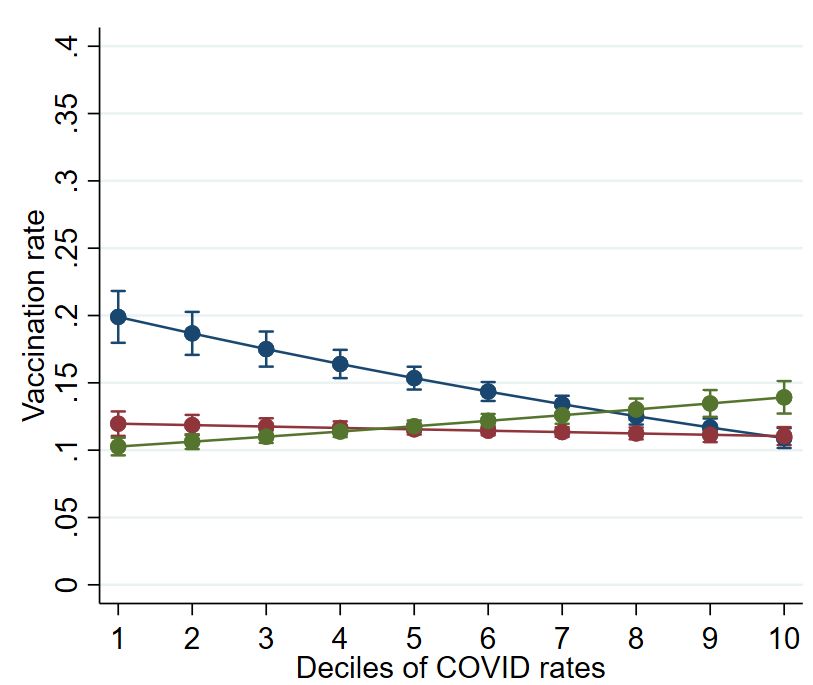
An uneven recovery: Measuring COVID-19 vaccine equity in Ontario
Table of Contents
Introduction.................................................................................................................................. 2
Methods........................................................................................................................................ 2
Results........................................................................................................................................... 3
Figure 1. Association between COVID-19 burden and vaccination rate...................................... 5
Figure 2. Association between neighborhood poverty and vaccination rate............................. 6
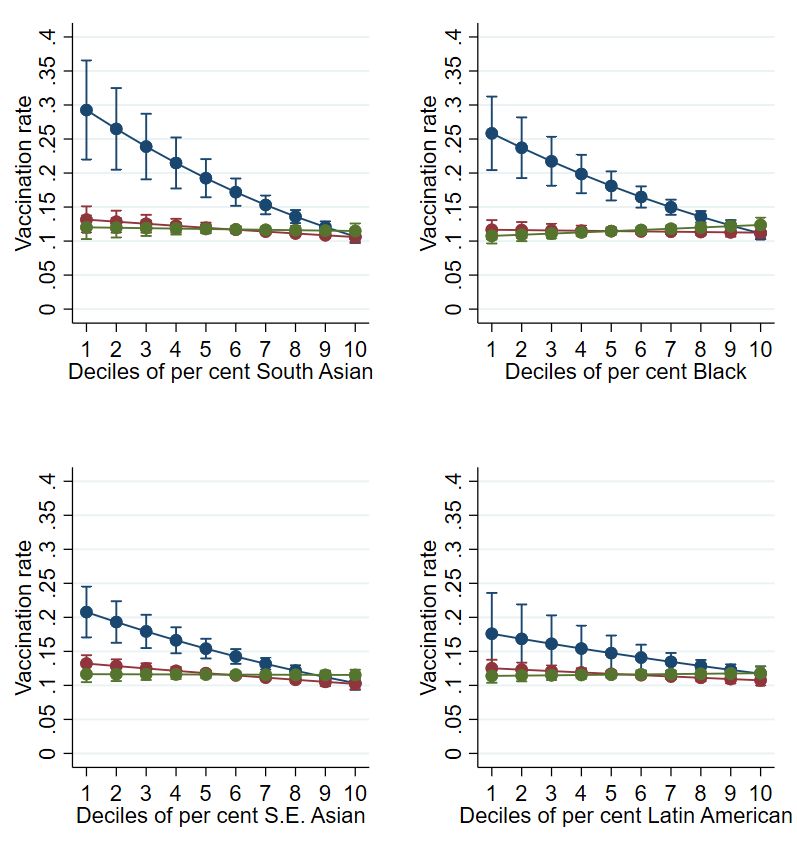
Figure 3. Assocation between racial demographics and vaccination rate.................................. 7
Limitations.................................................................................................................................... 8
Discussion...................................................................................................................................... 8
Appendix Regression Models..................................................................................................... 9
Table A1...................................................................................................................................... 9
Table A2....................................................................................................................................... 10
Bibliography................................................................................................................................ 11
1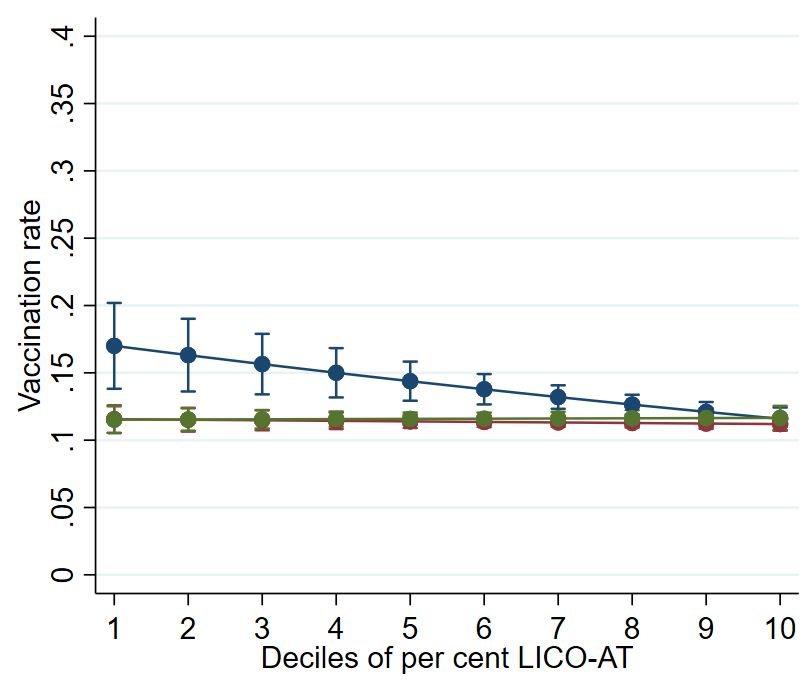
Introduction
A recent report released by the Institute for Clinical and Evaluative Sciences (ICES) demonstrated a
serious inequity in the rollout of COVID-19 vaccines. Areas of Ontario with the highest cumulative
incidence of COVID-19 are the areas with the lowest levels of vaccination.1

This finding has received widespread media attention,2–4 and suggests that social inequalities in Ontario
are driving who gets vaccinated and who does not.

This paper quantifies inequities in vaccination within Ontario, displaying a baseline to help monitor our
progress towards vaccine equity.

This paper will ask three questions:

        1) How unevenly are vaccinations distributed across the province?
        2) How much of a discrepancy is there between cumulative COVID-19 rates and vaccination rates
        at the neighbourhood level?
        3) What demographics are associated with vaccination at the neighbourhood level, and do these
        demographics interact with COVID-19 rates to predict vaccination rates?

Methods
Data and measures

The data used for this analysis were downloaded from the Institute for Clinical and Evaluative Sciences’
(ICES) COVID-19 dashboard on April 7, 2021. They cover the period from December 14, 2020 to March
27, 2021.1 ICES data gives the proportion of people living in a neighbourhood (excluding long-term care)
that have ever tested positive for COVID-19 and the proportion of the population that has received at
least one dose of any COVID-19 vaccine.

The first three characters of a Canadian postal code (the forward sortation area) were used to define
each neighbourhood. Data on neighbourhood demographics came from the 2016 Canadian census.

Analytic approach

This paper uses the Index of Dissimilarity 5–8 to measure how unevenly vaccinations are distributed
across neighbourhoods. It produces a number ranging from 0 to 1, which shows the proportion of the
population that would have to be relocated to create a completely even distribution (a score of .50
would mean that half the population would have to be relocated). That is, it shows how much of the
population would have to be moved around to obtain evenness.

This paper uses the Index of Dissimilarity first to show how unevenly vaccines are distributed across
Toronto neighbourhoods (question 1) and then investigates how well vaccination rates match the
cumulative COVID-19 burden (question 2).

Generalized Linear Models were used to analyze what demographics are associated with vaccination at
the neighbourhood level and whether these demographics interact with COVID-19 burden to predict

                                                                                                            2
vaccination rates. Since this outcome is bounded at 0 and 1, the models employ a logit link function.
Results are given in odds ratio format, and all predictor variables are standardized to have a mean of 0
and a standard deviation of 1. Models predict vaccination rates using COVID-19 rates, per cent low-
income after tax (LICO-AT), per cent over 65, region, per cent South Asian, per cent Black, per cent
Chinese, per cent South East Asian, and per cent Latin American. Models also test for interactions
between COVID-19 burden and region, as well as LICO-AT and region. The analysis focuses on specific
racialized groups as the three largest visible minority groups in Ontario (Chinese, Black, South Asian) and
those that have experienced especially high rates of COVID-19 infection.9 The LICO-AT measure was
chosen for comparability to other projects on neighbourhood economic disadvantage in Ontario,10 as
well as because the LICO takes into account costs of living (i.e. food, shelter, and clothing) that may have
been negatively impacted under the recent economic downturn.11 The robustness of findings were
checked using the Low-Income Measure-After Tax (LIM-AT), as an alternative measure of poverty.12 The
data did not provide the market basket measure for further comparison.
Results
1) How unevenly are vaccines being distributed across the province?
The Index of Dissimilarity gave a sense of what proportion of vaccinations would have had to be
redistributed for a completely even distribution across the province. Table 1 gives the Dissimilarity
scores first for Toronto (‘M’ postal codes), then areas around Toronto (‘L’ codes) and all other Part of
Ontario (all else).
Table 1. The unevenness of vaccine distribution.
Toronto Around Toronto All else
(‘M’ postal codes) (‘L’ postal codes)
Index score 0.12 0.13 0.14
The results show that vaccination coverage is fairly even across Ontario neighbourhoods. Between 12-15
per cent of vaccinations would need to be redistributed for an even distribution across neighbourhoods.
2) How much of a discrepancy is there between COVID-19 rates and vaccination at the neighbourhood
level?
An even distribution may not meet the needs of different neighbourhoods in Ontario because they have
different cumulative rates of COVID-19. If the Index of Dissimilarity is used to investigate the difference
between COVID-19 rate and vaccination rates, there is a starker difference between neighbourhoods.
There is about double (approximately 2.2 times) the difference between vaccination rates and need for
vaccinations measured by COVID-19 infection rates, and this discrepancy is relatively similar across
region, according to the Index of Dissimilarity.
However, the results from Table 2 do not reflect the full story on the negative correlation between
COVID-19 rates and vaccination by region. A simple calculation of covariance shows that the covariance
between COVID-19 rates and vaccination is -3.86 in Toronto, -1.68 in the surrounding areas, and 0.26 in
all other areas. This means that for every per cent difference in COVID-19 rates, the expected difference
3in vaccination is about four per cent lower in Toronto and about a quarter of a per cent higher outside of
the GTA.
This could be the result of other demographic factors, such as age structure. The next section addresses
this with a multivariable analysis.
Table 2. The dissimilarity between vaccination rates and cumulative COVID-19 rates by area.
Toronto Around Toronto All else
(‘M’ postal codes) (‘L’ postal codes)
Index score 0.29 0.30 0.27
3) What demographics are associated with vaccination rates at the neighbourhood level, and do these
demographics interact with cumulative COVID-19 rates?
When considering Ontario as a whole, cumulative COVID-19 rates in a neighbourhood were positively
associated with vaccination rates once poverty rates, age composition, and racialized groups were taken
into consideration. The ‘M’ postal codes had overall higher rates of vaccination compared to other
regions. Per cent of South Asian, Black, and Latin American were associated with lower rates of
vaccination. Per cent aged 65 and older was associated with higher rates of vaccination. All other
associations were insignificant. See Model 1 in Table A1, in the appendix.
However, some of these associations varied by region. Figure 1 shows that in Toronto, and to a lesser
extent in the neighbourhoods around Toronto, there is a negative association between COVID-19 rates
and vaccination – a seeming mismatch between need and supply. However, in the rest of Ontario, the
association is slightly positive; areas that have been hardest-hit by COVID-19 are those that have the
highest vaccination rates. There is also a significant interaction between region and neighbourhood
poverty (Figure 2), as well as between racial demographics and region (Figure 3). See Tables A1 and A2
in the appendix for regression results.
This paper also checked that the findings for LICO-AT were robust to type of poverty measure. The
model was re-run using the low-income measure after tax (LIM-AT), and the models produced very
similar results. This was not unexpected since the LICO-AT and LIM-AT were very highly correlated in this
dataset (r=0.87, pFigure 1. The negative association between COVID burden and vaccination is strongest for Toronto.
5Figure 2. The negative association between neighbourhood poverty (LICO-AT) and vaccination is
strongest for Toronto.
6Figure 3. The negative association between various racialized populations and vaccination is strongest
for Toronto.
7Limitations
This analysis is limited because the measures assume that the two groups being compared are mutually-
exclusive, whereas some people may have had COVID-19, and also received the vaccine. More precise
estimates would use exclusive categories – and potentially also infection in the past two weeks to
calculate exposure of people who are more likely to be currently infectious.
Discussion
These analyses show that Ontario is not concentrating its vaccination efforts in places with the highest
rates of illness, and that the province is not distributing vaccines in an equitable way to areas with
racialized populations and low-income neighbourhoods. Furthermore, Toronto appears to have
distinctly inequitable processes underway, where neighbourhood poverty, racialization, and COVID-19
rates are negatively associated with vaccination rates.
It is unclear whether disadvantage is more harmful in Toronto than in other areas, or whether it is easier
for some people to convert their advantages into vaccination in Toronto. It may indeed be a
combination of both. However, regardless of this speculation, it is clear that both economic (i.e.
neighbourhood poverty) and social (i.e. racialization) status play independent parts in producing
inequity. Systemic income inequality, and systemic structural racism are both factors that need to be
addressed.
The causes of the regionalized discrepancy between COVID-19 burden and vaccination likely reflects a
complex combination of institutional and social factors, including a lack of locations in high-burden areas
with the capability to administer the vaccines,13 inconsistent public health messaging,14 delays in the
rollout of vaccine supplies,15 and a lack of clear communication to medical professionals.16 We are
capable of managing these challenges and have the resources to close these gaps. Place-based targeting
of ‘hot spots’ for vaccine rollouts are a promising start,17 but we should also confront social inequities to
achieve a rollout that is appropriate to needs. Place-based targeting may also be insufficient if supplies
remain inadequate to needs. A future paper will measure our collective progress towards these goals.
8APPENDIX: Regression models
Table A1. Generalized linear models predicting rate of vaccination by forward sortation area in Ontario.
Results in odds ratios format.
Model 1 Model 2 Model 3
COVID-19 rate 1.06* 1.17*** 1.07**
Per cent LICO-AT 1.00 1.00 1.04
Per cent South Asian 0.94*** 0.97* 0.93***
Per cent Chinese 1.00 0.98 1.00
Per cent Black 0.95*** 0.97** 0.95***
Per cent South East Asian 0.98 0.97 0.98
Per cent Latin American 0.94*** 0.97 0.93***
Per cent aged 65 and older 1.19*** 1.22*** 1.20***
Region (Ref. = all else)
‘M’ postal codes (Toronto) 1.37*** 1.36*** 1.51***
‘L’ postal codes (around Toronto) 1.05 0.98 1.03
Interaction terms
‘M’ codes and COVID-19 burden 0.78***
‘L’ codes and COVID-19 burden 0.86***
‘M’ codes and per cent LICO-AT 0.85***
‘L’ codes and per cent LICO-AT 0.99
N 512 512 512
Note: * pTable A2. Generalized linear models predicting rate of vaccination by forward sortation area in Ontario.
Results in odds ratios format.
Model 4 Model 5 Model 6 Model 7
COVID-19 rate 1.07* 1.07* 1.07* 1.07**
Per cent LICO-AT 1.00 1.00 1.00 1.00
Per cent South Asian 0.94*** 1.12 0.93*** 0.93***
Per cent Chinese 1.11 0.99 1.00 0.99
Per cent Black 0.95*** 0.95*** 0.95*** 0.95***
Per cent South East Asian 0.97 0.96** 1.00 0.98
Per cent Latin American 0.93*** 0.93*** 0.95** 0.98
Per cent aged 65 and older 1.20*** 1.21*** 1.20*** 1.20***
Region (Ref. = all else)
‘M’ postal codes (Toronto) 1.40*** 1.40*** 1.37*** 1.40***
‘L’ postal codes (around Toronto) 1.02 1.01 1.04 1.04
Interaction terms
‘M’ codes and % South Asian 0.80***
‘L’ codes and % South Asian 0.86*
‘M’ codes and % Chinese 0.87
‘L’ codes and % Chinese 0.91
‘M’ codes and % SE Asian 0.94*
‘L’ codes and % SE Asian 0.97
‘M’ codes and % Lat. Am. 0.93*
‘L’ codes and % Lat. Am. 0.98
N 512 512 512 512
Note: * pBibliography
1. Institute for Clinical Evaluative Sciences. COVID-19 Dashboard. Accessed April 8, 2021.
https://www.ices.on.ca/DAS/AHRQ/COVID-19-Dashboard
2. The Toronto and Peel neighbourhoods that need the COVID vaccine the most aren’t getting it, new
data reveals | The Star. Accessed April 8, 2021.
https://www.thestar.com/news/gta/2021/04/06/the-toronto-and-peel-neighbourhoods-that-
need-the-covid-vaccine-the-most-arent-getting-it-new-data-
reveals.html?utm_source=Twitter&utm_medium=SocialMedia&utm_campaign=GTA&utm_conten
t=peeltorontoneighbourhoods&utm_source=twitter&source=torontostar&utm_medium=SocialMe
dia&utm_campaign=&utm_campaign_id=&utm_content=
3. James Wattie. #NEW: Data from @ICESOntario shows the following postal codes in Toronto have
the highest rates of population with 1 vaccine dose: 1. St. Clair & Rosedale (22.4%) 2. Forest Hill
(22.1%) 3. Forest Hill South (22.0%) Lowest: Jane & Finch (5.5%). @jameswattie. Published April 6,
2021. Accessed April 8, 2021. https://twitter.com/jameswattie/status/1379508414972366850
4. Apr 07 CR· P, April 7 2021 6:14 PM ET | Last Updated: Why people in Ontario’s hardest-hit
neighbourhoods are struggling to get vaccines | CBC Radio. CBC. Published April 7, 2021. Accessed
April 8, 2021. https://www.cbc.ca/radio/asithappens/as-it-happens-wednesday-edition-
1.5978289/why-people-in-ontario-s-hardest-hit-neighbourhoods-are-struggling-to-get-vaccines-
1.5978297
5. Duncan OD, Duncan B. A Methodological Analysis of Segregation Indexes. American Sociological
Review. 1955;20(2):210. doi:10.2307/2088328
6. Jahn J, Schmid CF, Schrag C. The Measurement of Ecological Segregation. American Sociological
Review. 1947;12(3):293-303. doi:10.2307/2086519
7. Massey DS. Reflections on the Dimensions of Segregation. Social Forces. 2012;91(1):39-43.
doi:10.1093/sf/sos118
8. Massey DS, Denton NA. The Dimensions of Residential Segregation. Social Forces. 1988;67(2):281-
315. doi:10.1093/sf/67.2.281
9. Government of Canada SC. Census Profile, 2016 Census - Ontario [Province] and Canada [Country].
Published February 8, 2017. Accessed April 9, 2021. https://www12.statcan.gc.ca/census-
recensement/2016/dp-
pd/prof/details/page.cfm?Lang=E&Geo1=PR&Code1=35&Geo2=PR&Code2=01&SearchText=Ontar
io&SearchType=Begins&SearchPR=01&B1=All&TABID=1&type=1
10. Matheson F. 2011 Ontario Marginalization Index: Technical document. Public Health Ontario.
Published online 2011:24.
11. Section 2: A comparison of LICO, LIMs and MBM. Accessed April 12, 2021.
https://www150.statcan.gc.ca/n1/pub/75f0002m/2010003/section/s2-eng.htm
12. Leon S, Iveniuk J. Forced Out: Evictions, Race, and Poverty in Toronto. :23.
1113. Plenty of Pharmacies, but No Vaccines in Toronto’s Northwest. The Local. Published March 26,
2021. Accessed April 8, 2021. https://thelocal.to/plenty-of-pharmacies-but-no-vaccines-in-
torontos-northwest/
14. Mar 09 SJ· TCP· P, March 9 2021 7:32 PM ET | Last Updated: Poor communications undermine
trust in Ontario’s vaccine plan: experts | CBC News. CBC. Published March 10, 2021. Accessed April
8, 2021. https://www.cbc.ca/news/canada/toronto/poor-communication-ontario-vaccine-
plan-1.5943214
15. Fact check: How much does Ontario’s COVID-19 vaccine rollout lag other provinces? National Post.
Accessed April 8, 2021. https://nationalpost.com/news/canada/fact-check-how-much-does-
ontarios-covid-19-vaccine-rollout-lag-other-provinces
16. Coronavirus: Ontario doctors ‘frustrated’ by Ford government’s vaccine rollout plan. Global News.
Accessed April 8, 2021. https://globalnews.ca/news/7680796/ontario-doctors-frustrated-vaccine-
rollout/
17. Ontario Moving to Phase Two of COVID-19 Vaccine Distribution Plan | Ontario Newsroom.
Accessed April 8, 2021. https://news.ontario.ca/en/release/61009/ontario-moving-to-phase-two-
of-covid-19-vaccine-distribution-plan
12You can also read