Seismic resistance estimation of multi-story steel frames under ductility level earthquake impact by nonlinear static method
←
→
Page content transcription
If your browser does not render page correctly, please read the page content below
E3S Web of Conferences 263, 03011 (2021)                                  https://doi.org/10.1051/e3sconf/202126303011
FORM-2021

         Seismic resistance estimation of multi-story
         steel frames under ductility level earthquake
         impact by nonlinear static method
         Maksim Zubritskiy1, Oleg Ushakov2, Linar Sabitov1, 3, and Karina Nabiullina3

         1
          Kazan State Power Engineering University, 420066, Krasnoselskaya str., 51, Kazan,
         Russia
         2
          Federal State Autonomous Educational Institution of Higher Education «Ural Federal
         University named after the first President of Russia B.N.Yeltsin», 620002, 19 Mira street,
         Ekaterinburg, Russia
         3
          Federal State Autonomous Educational Institution of Higher Education «Kazan Federal
         University», 420008, 18 Kremlyovskaya street, Kazan, Russia

                      Abstract. The article proposes a technique for taking into account the
                      higher vibration modes under seismic resistance estimation of multi-story
                      steel frames by nonlinear static method. The characteristic point search has
                      also been improved. As part of the study, the proposed method was
                      verified by time history analysis. Proposed technique allows one to
                      significantly reduce the calculation time, while excluding the deficit of
                      seismic resistance.

         1 Introduction
         About 300 thousand earthquakes occur in the world every year. The epicenter of most of
         them is located far from settlements, and the magnitude of the impact is quite small.
         However, some earthquakes have disastrous effects on entire cities, destroying them and
         causing colossal economic damage. Thus, increasing the seismic resistance of buildings and
         structures is one of the most pressing problems of construction in seismically hazardous
         areas.
             According to 1, when performing calculations of building structures taking into account
         seismic effects, it is necessary to consider two design situations:
               Seismic loads corresponding to the "Strength Level Earthquake" (SLE) level;
               Seismic loads corresponding to the level "Ductility Level Earthquake" (DLE)
                  level.
             The purpose of calculations on SLE is determining design solutions to prevent partial or
         complete operational properties loss. The calculations are performed on the basis of the
         response spectrum analysis with elastic behavior.

   © The Authors, published by EDP Sciences. This is an open access article distributed under the terms of the Creative
   Commons Attribution License 4.0 (http://creativecommons.org/licenses/by/4.0/).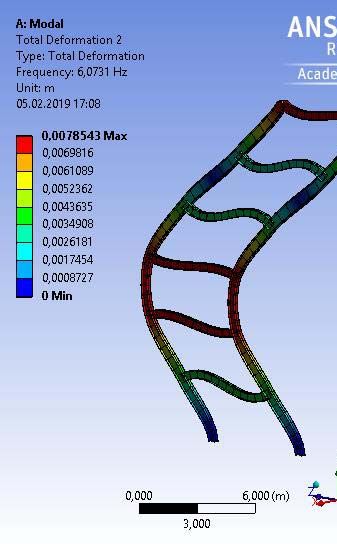
E3S Web of Conferences 263, 03011 (2021)                            https://doi.org/10.1051/e3sconf/202126303011
FORM-2021

             The purpose of analysis of system under DLE level earthquake is assessing the overall
         stability, immutability, the structure homogeneity, the admissibility of the accelerations
         level, displacements, velocities in the building elements, structure, the building structures
         ability to redistribute external seismic effects due to the formation of plastic hinges and
         other nonlinear effects. Evaluation of seismic resistance under seismic impact of the DLE
         level earthquake is carried out on the basis of a time history analysis by integrating the
         motion equations in the time domain using an accelerations records set. Such calculations
         require a large time resource, complex software and special qualifications of the engineer.
             An alternative to time history analysis is the nonlinear static method - Pushover analysis
         [2-4]. The structure is subjected to monotonically increasing horizontal forces.
             Today it is necessary to perform at least two calculations using different horizontal
         forces pattern along the system height:
               Inertial forces pattern corresponding to the main vibration form. Seismic resistance
                   estimation with a given distribution can be performed only if the modal mass of
                   considered form or effective modal mass (ratio of structure mass involved in the
                   dynamic response for a given direction of the seismic impact) is not less than 75%;
               Inertial forces pattern, obtained by inertial forces superposition of several vibration
                   modes. In this case, the total modal mass under consideration should not be less
                   than 90%;
               Universal inertial forces pattern distribution in proportion to the masses at the
                   system nodes;
               Adaptive inertial forces pattern, which changes depending on the system nodes
                   movement.

             Further characteristic point search on the capacity curve is a laborious process and
         requires the cumbersome graphs plotting and non-trivial calculations. In modern software, a
         nonlinear static method is implemented only on the basis of inertial forces pattern
         corresponding to only one of the vibration modes. In addition, the structure response for
         single vibration mode under seismic impact is less than results obtained by time history
         analysis 5. In research 6 maximum horizontal displacements values between two
         aforementioned methods differ by more than 10%. The difference between the horizontal
         displacements of the system nodes with decreasing height increases. The maximum
         difference of results is about 42%.
             The article purpose is improving the nonlinear static method in terms of taking into
         account higher vibration modes, as well as simplifying the characteristic point search. The
         research object is steel single-span multi-story frames.

         2 Methods for calculating higher mode of vibration
         To determine the system response taking into account the influence of higher vibration
         modes we consider the following method and introduce the concept of a modified inertial
         forces system.
             Modified inertial forces system means the system of forces obtained based on forces
         superposition by the method “Square Root of the Sum of Squares” 7, when the
         displacement of the top of the considered computational model corresponds to the total
         displacements obtained from linear spectral analysis. The graphic representation of inertial
         forces summation is shown in Figure 1.

                                                       2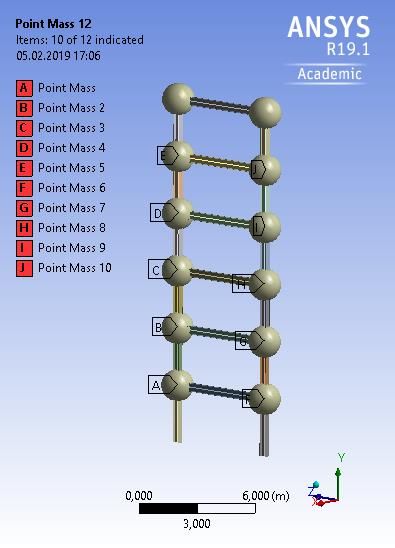
E3S Web of Conferences 263, 03011 (2021)                              https://doi.org/10.1051/e3sconf/202126303011
FORM-2021

         Fig. 1. Graphic representation of modal response summation method “Square Root of the Sum of
         Squares”

                    Thus, the modified inertial forces system is determined by (1):

                                         = α                                                (1)

          where        – modal structural response corresponding to the i-th form of natural
                      vibrations;
                           ∆
                      α = ∆        – reduction ratio equal to the ratio of maximum displacement

                      of the top node of the system ∆ obtained through response spectrum theory
                      to displacements ∆ , obtained through modified forces system.
             According to 8, 9 one needs to spend the same amount of energy to destroy a material
         regardless of the load applied (i.e, static slow, dynamic fast, single or multiple loading).
         Thus, the linear system deformation energy with an inertial forces modified system (yellow
         area on Figure 2) is identical to the system deformation energy allowing for plastic
         deformations (blue area on Figure 2) – equivalent energies concept. The target value of
         system energy capacity is equal to yellow area under the graph and can be determined
         based on the modified inertial forces system.

                                                   ∆
                                               =                                           (2)
                                                    2
          where      – shear force at the base of the system obtained through response spectrum
                    analysis;
                    ∆ – displacement of the top node of the system.

                                                        3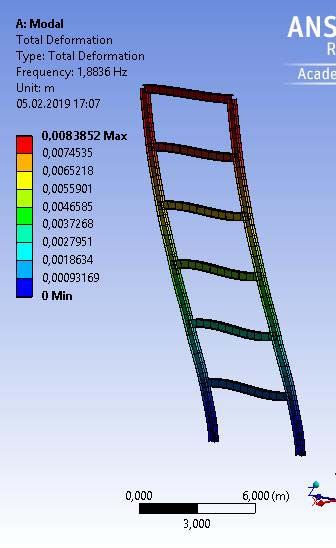
E3S Web of Conferences 263, 03011 (2021)                                    https://doi.org/10.1051/e3sconf/202126303011
FORM-2021

                        а)                                  b)                         c)
          Fig. 2. Energy determination for elastic and elastic-plastic behaviour of a system with one degree of
          freedom: а) elastic behaviour; b) elastic-plastic behaviour; c) energy equality for elastic and elastic-
                                                     plastic behaviour
             The next stage in seismic resistance assessment is plotting the dependency graph “Shear
         force V – Displacement of the top node of the system ∆” – capacity curve – based on a
         nonlinear static analysis of a system with one degree of freedom under the action of a
         modified inertial forces system. Each point on capacity curve describes final state of the
         system for considered seismic impact with monotonically increasing horizontal forces.

         Fig. 3. Capacity curve with points showing criteria for assessing structural reliability

             Given that the energies of elastic and elastic-plastic deformation are equal, the obtained
         value of the top of the system displacement ∆pl is the target value for assessing the seismic
         resistance of the entire system. Thus the characteristic point on the capacity curve indicates
         the maximum displacement of the system top based on the maximum possible energy of a
         given earthquake According to the maximum displacement of the system top inter-floor
         displacements, internal forces in the system elements as well as to analyze the inelastic
         behaviour of joints and system elements can be determined.
             Depending on the position of the characteristic point on the bearing capacity curve, one
         can assess the general nature of the damage to the structure as a whole.
             The object of research is steel single-span multi-story frame.
             Stress-strain diagram of the steel is shown on Figure 4. To describe the nonlinear
         behavior of the system elements, isotropic hardening model (Bilinear Kinematic
         Hardening) 10 was taken as a structural material. Stress-strain diagrams of steel in tension

                                                             4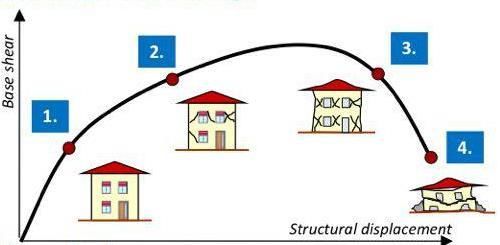
E3S Web of Conferences 263, 03011 (2021)                                                           https://doi.org/10.1051/e3sconf/202126303011
FORM-2021

         and compression are assumed to be the same with corresponding tensile and compressive
         steel resistance. The yield surface is described by the Von-Mises criterion (Figure 5). The
         cylinder axis coincides with the axis of hydrostatic compression in the principal stresses
         coordinate system.

                                                                               500
                                                                               400
                                                                               300
                                                                               200
                        Normal stress, MPa

                                                                               100
                                                                                 0
                                             -0,02   -0,015   -0,01   -0,005          0    0,005    0,01   0,015   0,02
                                                                               -100
                                                                               -200
                                                                               -300
                                                                               -400
                                                                               -500

                                                                                  Strain
         Fig. 4. Stress-strain diagram of steel

         Fig. 5. Von-Mises yield surface in the axes of the main stresses

            Seismic actions are given by the following one-component accelerograms acting in the
         YoZ plane: Iran, 1978 (Erthq. 1); El Centro, USA (California) 1979 (Erthq. 2); Duzce,
         Turkey, 1999 (Erthq. 3).
            Accelerogram records were taken from the database 11.
            General view is shown on Figure 6. Geometry and frequency system characteristics are
         given in Table 1.

                                                                                     5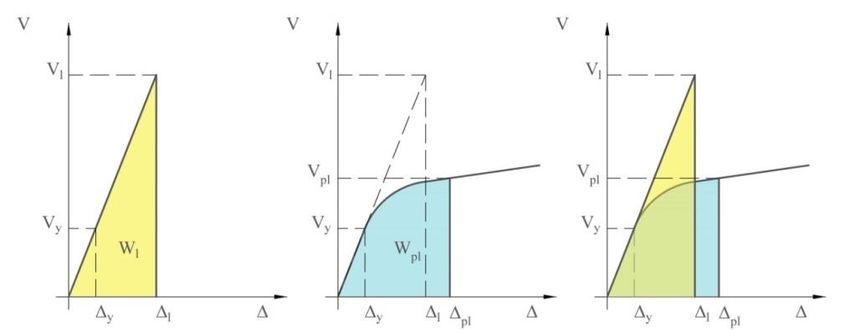
E3S Web of Conferences 263, 03011 (2021)                             https://doi.org/10.1051/e3sconf/202126303011
FORM-2021

                                Table 1. Geometry and frequency system characteristics

                                                                                       Value
          №                           Name
                                                                      Erthq. 1        Erthq. 2   Erthq. 3
                                                                                   ⌶
          1     Vertical elements cross-section, mm
                                                                      400(h)x300(b)x12,5(bf)x10(bw)
          2     Horizontal elements cross-section, mm                 ⌶ 400(h)x300(b)x12(bf)x8(bw)
          3     Storey height, mm                                                      3000
          4     Number of storeys                                                        6
          5     Span, mm                                                               6000
          6     Young modulus, Pa                                                      2e11
          7     Yield point, MPa                                                        270
          g     Tangential modulus, MPa                                               5,361е3
          9     Masses ma = mb = mc, kg                                2000            2000       2000
          10    1st natural vibration frequency f1, Hz                1,8836          1,8836      1,8836
          11    2nd natural vibration frequency f2, Hz                6,0731          6,0731      6,0731
          12    3rd natural vibration frequency f2, Hz                11,366          11,366      11,366
                                           -1
          13    Damping parameter αR, s                              1,000593     1,000593       1,000593
          14    Damping parameter βR, s                              0,001184     0,001184       0,001184

                              a)                                                 b)
          Fig. 6. General view of the design model (а) – ANSYS R18.2 Academic version, (b) – Lira 10.10

                                                         6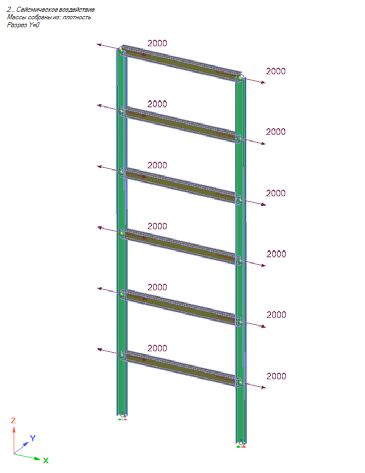
E3S Web of Conferences 263, 03011 (2021) https://doi.org/10.1051/e3sconf/202126303011
FORM-2021
To calculate modified inertial forces system for a given system during the seismic
evaluation by the multimodal nonlinear static method, the initial data are the inertial forces
of the first three vibration modes.
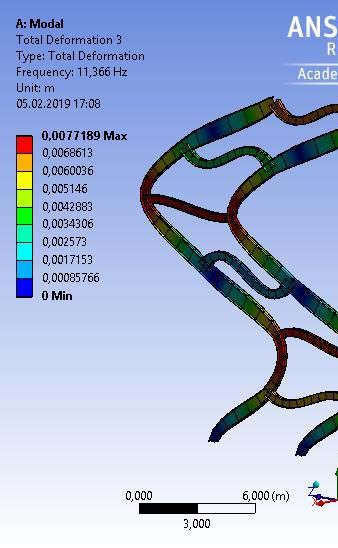
The inertial forces distribution and the forces resulting system for seismic impact Iran,
1978 (Erthq1) are obtained by response spectrum analysis. Deformed shapes for each
vibration form are shown on Figure 7. Table 2 represents the modified inertial forces system
for each seismic impact.
а) b) c)
Fig. 7. Deformed shapes for vibration forms: (a) – 1st natural vibration form, (b) – 2nd natural
vibration form, (c) – 3rd natural vibration form
Table 2. Modified inertial forces system
Value
Name
Erthq. 1 Erthq. 2 Erthq.3
th
Inertial force at the 6 storey after superposition
6556.34 6612.5 7701.1
by the SRSS-method according to (1), kg
Inertial force at the 5th storey after superposition
5881.07 5449.1 5825.6
by the SRSS-method according to (1), kg
Inertial force at the 4th storey after superposition
5126.32 5021.0 5325.6
by the SRSS-method according to (1), kg
Inertial force at the 3rd storey after superposition
4414.68 4393.5 5778.0
by the SRSS-method according to (1), kg
Inertial force at the 2nd storey after superposition
3479.07 3907.5 5182.6
by the SRSS-method according to (1), kg
Inertial force at the 1st storey after superposition
1708.26 2172.3 2585.8
by the SRSS-method according to (1), kg
Total modal mass, % 96.29 96.24 96.24
7E3S Web of Conferences 263, 03011 (2021) https://doi.org/10.1051/e3sconf/202126303011
FORM-2021
3 Results
To estimate the responses error obtained by the multimodal nonlinear static method, it is
necessary tos compare the results with the responses obtained by time history analysis using
the acceleration records Erthq1-3.
The calculation results error estimation is presented in Table 3.
Statistical processing was performed to assess the obtained data quality:
The average value of the error in the horizontal displacements of the system nodes
was 8,34%; standard deviation – 7,95%;
The average value of the error in bending moments in the system elements was
14,6%; standard deviation – 0,89%;
The average value of the error in shear forces in the elements of the system was
12,29%; standard deviation – 0,52%.
Table 3. The calculation results error estimation
Nonlinear static
Compared parameter Time history analysis* Error, %*
analysis*
-1,79/-
6th storey 178,3/166,98/161,78 175,1/162,88/170,5
Horizontal displacement, mm
2,46/+5,11
-1,05/-1,05/
5th storey 162,2/150,84/147,02 160,5/149,26/157,73
+6,79
+1,47/+2,41/
4th storey 136,9/126,18/124,00 138,91/128,59/137,24
+9,65
+5,83/+6,64/
3rd storey 102,7/94,125/94,15 109,06/100,82/109,41
+13,94
+11,92/+12,6
2nd storey 62,2/57,25/58,81 70,62/65,55/72,51
6/+18,40
+18,3/+18,83/
1st storey 23,6/21,76/22,94 28,90/26,81/30,42
+24,59
Maximum bending
+13,70/+15,8
moment in the 428,31/420,93/433,18 496,32/489,36/505,39
2/+14,29
termination, kNˑm
Maximum shear
+11,82/+13,0
force at the system 390,62/384,38/402,08 442,98/441,9/457,04
2/+12,03
base, kN
* The table shows the values in the following order: Iran, 1978 (Erthq. 1) / El Centro, USA
(California), 1979 (Erthq. 2) / Duzce, Turkey, 1999 (Erthq. 3)
4 Discussion
In the mathematical study course, time-domain calculations were performed using records
of three accelerations, bearing capacity curves were constructed, non-linear static
calculations and modal analyzes were performed for the design model of a single-span
multi-story steel frame.
To take into account the higher vibration modes influence under seismic resistance
estimation of systems, a method is proposed for searching for the modified inertial forces
for the subsequent characteristic point search on the capacity curve – multimodal nonlinear
static method. Based on the results of performed calculations complex, it can be concluded
8E3S Web of Conferences 263, 03011 (2021) https://doi.org/10.1051/e3sconf/202126303011
FORM-2021
that proposed method implementation is advisable. The average error value in the results
obtained by the time history analysis with the results based on the multimodal nonlinear
static method for all structural response criteria does not exceed 15%, while providing a
margin for assessing seismic resistance. The authors have proposed an algorithm to
automate the proposed technique 13.
References
1. Design Code: SP 14.13330.2014. Seismic Building Design Code – Moscow: [w.p.],
2014 –125 с.
2. Applied Technology Council: ATC-40. Seismic evaluation and retrofit of concrete
buildings – Redwood, CA, 1996 – 334 p.
3. EUROPEAN STANDARD: EUR 25204 EN. Eurocode 8: Seismic Design of
BuildingsWorked examples. – Luxembourg: Publications Office of the European
Union, 2012 –522 p.
4. FEMA-356. Prestandard and Commentary for the seismic rehabilitation of buildings –
American Society of Civil Engineers (ASCE), Reston, VA, 2000 – 519 p.
5. Zubritskiy M.A. Account for the contribution of higher modes under system seismic
resistance estimation by nonlinear static method / Ushakov O.Y., Sabitov, L.S. // IOP
Conference Series: Materials Science and Engineering, Volume 570, Number 1, 2019 –
7 p.
6. Zubritskiy M.A. Performance-based seismic evaluation methods for the estimation of
inelastic deformation demands resistance estimation by nonlinear static method
/ Ushakov O.Y., Sabitov, L.S. // IOP Conference Series: Materials Science and
Engineering, Volume 570, Number 1, 2019 – 8 p.
7. Birbraer A.N. Seismic Analysis of Structures. - St. Petersburg: Nauka, 1998 - 255 p.
8. Mkrtychev O.V. Safety of buildings and structures during seismic and emergency
impacts analysis of buildings: monograph / Moscow State University of Civil
Engeneering – Moscow, NRU MGSU, 201 – 152 p.
9. Mkrtychev O.V. Problems of accounting for nonlinearities in the theory of seismic
resistance (hypotheses and delusions): monograph / O.V. Mkrtychev, G.A.
Ginchvelashvili; Ministry of Education and Science of the Russian Federation, Moscow
State University of Civil Engeneering – Moscow, NRU MGSU, 2012 – 192 p.
10. ANSYS HELP // URL: https://ansyshelp.ansys.com/
11. PEER Ground Motion Database // URL:https://ngawest2.berkeley.edu/
12. Zubritskiy M.A. Performance-based seismic evaluation methods for the estimation of
inelastic deformation demands / Ushakov O.Y., Sabitov L.S // IOP Conference Series:
Materials Science and Engineering, Volume 570, Number 1, 2019 – 7 с.
13. Certificate of state registration of the program for electronic computer
№2019667065.Multimodal nonlinear static method for system seismic evaluation MPA-
1. Copyrightholder: Zubritskiy Maksim Aleksandrovich. The authors: Sabitov L.S.,
Zubritskiy M.A., Ushakov O.Y. Request 2019663503; state date registration in the
electronic computer program registry 18.12.19 – 1 p.
9You can also read