Parallel Task in Subjective Audio Quality and Speech Intelligibility Assessments
←
→
Page content transcription
If your browser does not render page correctly, please read the page content below
Czech Technical University in Prague
                     Faculty of Electrical Engineering
                      Department of Measurement

   Parallel Task in Subjective Audio Quality and Speech
                  Intelligibility Assessments
                             Doctoral Thesis

                          Mgr. Hakob Avetisyan

Ph.D. programme: P2612 - Electrical Engineering and Information Technology
      Branch of study: 2601V006 - Measurement and Instrumentation
                  Supervisor: Prof. Ing. Jan Holub, Ph.D.

                          Prague, January 2021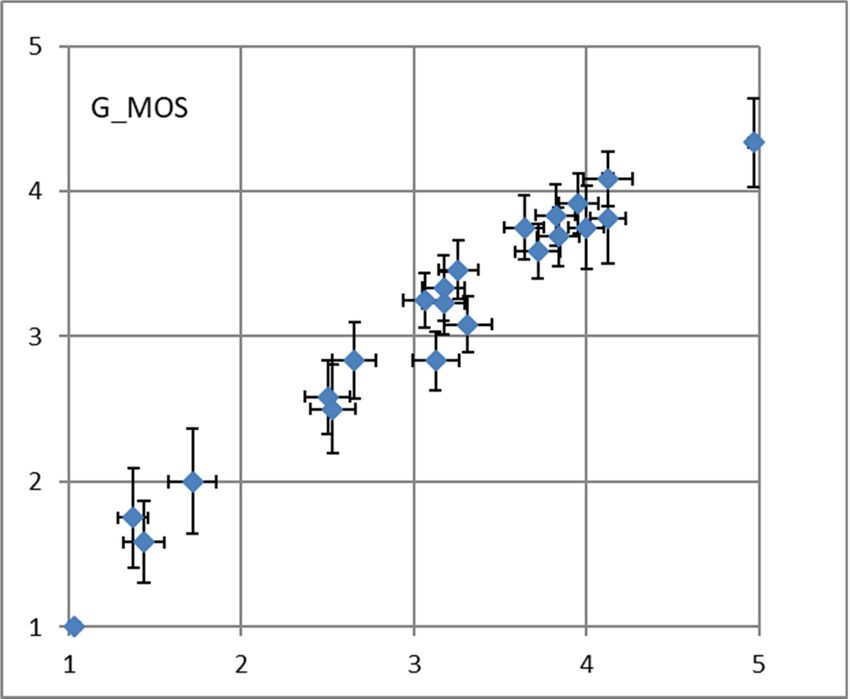
ii

Thesis Supervisor:
    Prof. Ing. Jan Holub, Ph.D.
    Department of Measurement
    Faculty of Electrical Engineering
    Czech Technical University in Prague
    Technická 2
    160 00 Prague 6
    Czech Republic

Copyright © January 2021 Mgr. Hakob Avetisyan
Declaration

I hereby declare I have written this doctoral thesis independently and quoted all the sources
of information used in accordance with methodological instructions on ethical principles for
writing an academic thesis. Moreover, I state that this thesis has neither been submitted
nor accepted for any other degree.

In Prague, January 2021

                                                        ............................................
                                                            Mgr. Hakob Avetisyan

                                             iii
Abstract
This thesis deals with the subjective testing of both speech quality and speech intelligibility,
investigates the existing methods, record their main features, as well as advantages and
disadvantages. The work also compares different tests in terms of various parameters and
provides a modern solution for existing subjective testing methods.
The first part of the research deals with the repeatability of subjective speech quality
tests provided in perfect laboratory conditions. Such repeatability tasks are performed using
Pearson correlations, pairwise comparison, and other mathematical analyses, and are meant
to prove the correctness of procedures of provided subjective tests. For that reason, four
subjective speech quality tests were provided in three different laboratories. The obtained
results confirmed that the provided tests were highly repeatable, and the test requirements
were strictly followed.
Another research was done to verify the significance of speech quality and speech intelli-
gibility tests in communication systems. To this end, more than 16 million live call records
over VoIP telecommunications networks were analyzed. The results confirmed the primary
assumption that better user experience brings longer call durations. However, alongside the
main results, other valuable conclusions were made.
The next step of the thesis was to investigate the parallel task technique, existing ap-
proaches, their advantages, and disadvantages. It turned out that the majority of parallel
tasks used in tests were either physically or mentally oriented. As the subjects in most
cases are not equally trained or intelligent, their performances during the tasks are not equal
either, so the results could not be compared correctly.
In this thesis, a novel approach is proposed where the conditions for all subjects are equal.
The approach presents a variety of tasks, which include a mix of mental and physical tasks
(laser-shooting simulator, car driving simulator, objects sorting, and others.). Afterward,
the methods were used in several subjective speech quality and speech intelligibility tests.
The results indicate that the tests with parallel tasks have more realistic values than the
ones provided in laboratory conditions.
Based on the research, experience, and achieved results, a new standard was submitted
to the European Telecommunications Standards Institute with an overview, examples, and
recommendations for providing subjective speech quality and speech intelligibility tests. The
standard was accepted and published under the number ETSI TR 103 503.
Keywords: Subjective testing, parallel task, psychomotor task, speech quality, speech in-
telligibility
ivAbstrakt
Tato disertačnı́ práce se zabývá subjektivnı́m testovánı́m jak kvality řeči, tak i srozu-
mitelnosti řeči, prozkoumává existujı́cı́ metody, určuje jejich základnı́ principy a podstaty
a porovnává jejich výhody a nevýhody. Práce také porovnává testy z hlediska různých
parametrů a poskytuje modernı́ řešenı́ pro již existujı́cı́ metody testovánı́.
Prvnı́ část práce se zabývá opakovatelnostı́ subjektivnı́ch testovánı́ provedených v ideálnı́ch
laboratornı́ch podmı́nkách. Takové úlohy opakovatelnosti se provádı́ použitı́m Pearsonové
korelace, porovnánı́ po párech a jinými matematickými analýzami. Tyto úlohy dokazujı́
správnost postupů provedených subjektivnı́ch testů. Z tohoto důvodu byly provedeny čtyři
subjektivnı́ testy kvality řeči ve třech různých laboratořı́ch. Zı́skané výsledky potvrzujı́, že
provedené testy byly vysoce opakovatelné a testovacı́ požadavky byly striktně dodrženy.
Dále byl proveden výzkum pro ověřenı́ významnosti subjektivnı́ch testovánı́ kvality řeči a
srozumitelnosti řeči v komunikačnı́ch systémech. Za tı́mto účelem bylo analyzováno vı́ce než
16 miliónů záznamů živých hovorů přes VoIP telekomunikačnı́ sı́tě. Výsledky potvrdily
základnı́ předpoklad, že lepšı́ uživatelská zkušenost působı́ delšı́ trvánı́ hovorů. Kromě
dosažených hlavnı́ch výsledků však byly učiněny dalšı́ důležité závěry.
Dalšı́m krokem disertačnı́ práce bylo prozkoumat techniku paralelnı́ch zátěžı́, existujı́cı́
přı́stupy a jejich výhody a nevýhody. Ukázalo se, že většina paralelnı́ch zátěžı́ použı́vaných
v testech byla buď fyzicky, nebo mentálně orientovaná. Jelikož subjekty ve většině přı́padů
nejsou stejně fyzicky nebo mentálně zdatnı́, jejich výkony během úkolů nejsou stejné, takže
výsledky nelze správně porovnat.
V této disertačnı́ práci je navržen nový přı́stup, kdy jsou podmı́nky pro všechny subjekty
stejné. Tento přı́stup představuje celou řadu úkolů, které zahrnujı́ kombinaci mentálnı́ch a
fyzických zátěžı́ (simulátor laserové střelby, simulátor řı́zenı́ auta, třı́děnı́ předmětů apod.).
Tyto metody byly použity v několika subjektivnı́ch testech kvality řeči a srozumitelnosti
řeči. Závěry naznačujı́, že testy s paralelnı́mi zátěžı́ majı́ realističtějšı́ výsledky než ty, které
jsou prováděny v laboratornı́ch podmı́nkách.
Na základě výzkumu, zkušenostı́ a dosažených výsledků byl Evropskému institutu pro
normalizaci v telekomunikacı́ch předložen nový standard s přehledem, přı́klady a doporučenı́mi
pro zajištěnı́ subjektivnı́ch testovánı́ kvality řeči a srozumitelnosti řeči. Standard byl přijat
a publikován pod čı́slem ETSI TR 103 503.
Klı́čová slova: Subjektivnı́ testovánı́, paralelnı́ zátěž, psychomotorická úloha, kvalita řeči,
srozumitelnost řeči
vAcknowledgements
First of all, I would like to sincerely thank and express my appreciation to my supervisor
Prof. Jan Holub for his unconditional support and guidance with my thesis and studies.
Next, my studies and research would be much harder without the help and assistance of my
colleagues and our academic personnel. Special thanks to Prof. Haasz, Prof. Ripka, Prof.
Šmı́d, doc. Roztočil, Dr. Svatoš, Dr. Slavata, Dr. Sobotka, Ing. Drábek, Dr. Bruna, Ing.
Hanuš, Ing. Pospı́šil and Ing. Kubeš. Big thanks to Dean’s office headed by Prof. Páta, and
faculty administrative staff, especially Mrs. Kroutilı́ková, Mrs. Florianová, Mgr. Sankotová
and Mrs. Kočová.
I want to express my deepest gratitude to the Czech Government with the Ministry of Ed-
ucation, Youth and Sports, The Centre for International Cooperation in Education (DZS),
Czech Embassy in Armenia with the former Ambassador Petr Mikyska for this great oppor-
tunity to live and study in the wonderful country of the Czech Republic. My appreciation
to the Institute for Language and Preparatory Studies of Charles University in Poděbrady
for their contribution in my knowledge of Czech language, which made my integration in the
Czech society much smoother.
This research was possible thanks to the Grant Agency of the Czech Technical University in
Prague, grant No. SGS17/191/OHK3/3T/13
viList of Tables
2.1 Comparison of various recommendations, their advantages and disadvantages 7
2.2 Resource Summary . . . . . . . . . . . . . . . . . . . . . . . . . . . . . . . . 8
All the tables included in individual articles are listed directly in the articles.
viiList of Figures
6.1 (Corresponding to S1 Fig) Speech MOS(S-MOS) of A and B tests. Both axes
have the values of MOS(1–5). . . . . . . . . . . . . . . . . . . . . . . . . . . 40
6.2 (Corresponding to S2 Fig) Noise annoyance MOS (N-MOS) of A and B tests.
Both axes have the values of MOS (1–5). . . . . . . . . . . . . . . . . . . . . 40
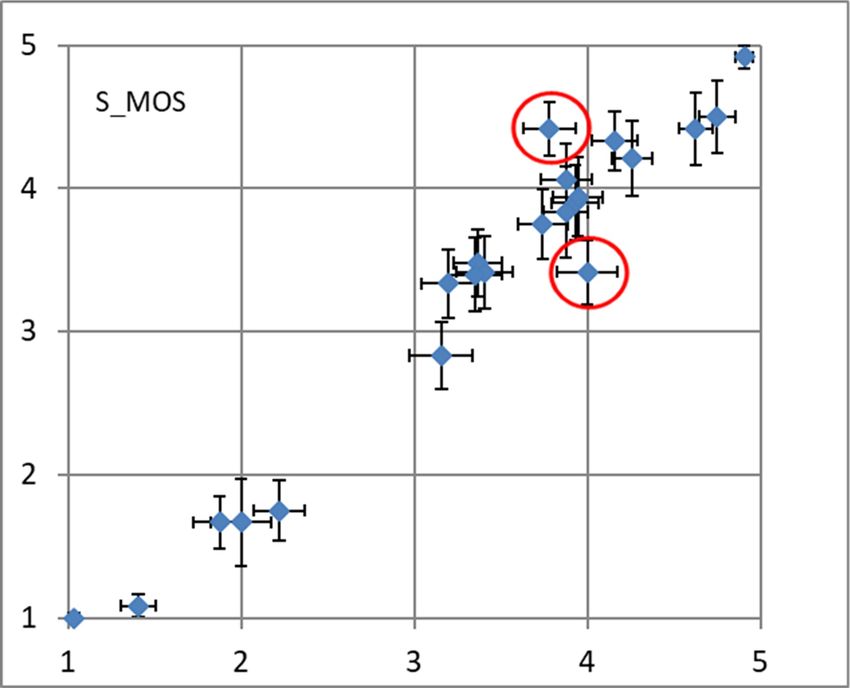
6.3 (Corresponding to S3 Fig) Overall quality MOS (G-MOS) of A and B test.
Both axes have the values of MOS (1–5). . . . . . . . . . . . . . . . . . . . . 41
All the figures included in individual articles are listed directly in the articles.
viiiList of Acronyms
ACD Average Call Duration
ACR Absolute Category Rating
AMR Adaptive Multi-Rate audio codec
CCR Comparison Category Rating
CDR Call Detail Records
CI95 The 95% Confidence Interval
CMR Critical Minute Ratio
CS-ACELP Conjugate Structure Algebraic-Code-Excited Linear Prediction
DALT Diagnostic Alliteration Test
DCR Degradation Category Rating
DMCT Diagnostic Medial Consonant Test
DRT Diagnostic Rhyme Test
ETSI European Telecommunications Standards Institute
EVS Enhanced Voice Services Codec
G-MOS/OVRL Overall sample quality MOS
HMMWV High Mobility Multipurpose Wheeled Vehicle
ITU International Telecommunication Union
MELPe Mixed-Excitation with Linear Predictive enhanced
MOS Mean Opinion Score
MRT Modified Rhyme Test
N-MOS/BAK Noise annoyance MOS
PCM Pulse Code Modulation
PESQ Perceptual Evaluation of Speech Quality
POLQA Perceptual Objective Listening Quality Analysis
QoE Quality of Experience
RMS Root Mean Square
RMSE Root Mean Squared Error
RTP Real-time Transport Protocol
SIP Session Initiation Protocol
S-MOS/SIG Speech quality MOS
SNR Signal-to-Noise Ratio
STD Standard Deviation of Arithmetical Mean
VoIP Voice over Internet Protocol
ixContents
Abstract iv
Abstrakt v
Acknowledgements vi
List of Tables vii
List of Figures viii
List of Acronyms ix
1 Introduction 1
1.1 Motivation . . . . . . . . . . . . . . . . . . . . . . . . . . . . . . . . . . . . . 1
1.2 Objective Tests . . . . . . . . . . . . . . . . . . . . . . . . . . . . . . . . . . 1
1.3 Subjective Tests . . . . . . . . . . . . . . . . . . . . . . . . . . . . . . . . . . 2
1.3.1 Subjective speech quality testing . . . . . . . . . . . . . . . . . . . . 2
1.3.2 Subjective speech intelligibility testing . . . . . . . . . . . . . . . . . 2
1.4 Scope and Objective . . . . . . . . . . . . . . . . . . . . . . . . . . . . . . . 3
1.5 Structure of the Thesis . . . . . . . . . . . . . . . . . . . . . . . . . . . . . . 3
2 State of the Art 5
2.1 Introduction to Recommendations . . . . . . . . . . . . . . . . . . . . . . . . 5
2.1.1 ITU-T Recommendation P.800 . . . . . . . . . . . . . . . . . . . . . 5
2.1.2 ITU-T Recommendation P.835 . . . . . . . . . . . . . . . . . . . . . 5
2.1.3 ITU-R Recommendation BS.1116 . . . . . . . . . . . . . . . . . . . . 6
2.1.4 ITU-R Recommendation BS.1534 MUSHRA . . . . . . . . . . . . . . 6
2.1.5 Crowdtesting . . . . . . . . . . . . . . . . . . . . . . . . . . . . . . . 6
2.1.6 Comparison of Recommendations . . . . . . . . . . . . . . . . . . . . 7
2.2 Problem Definition . . . . . . . . . . . . . . . . . . . . . . . . . . . . . . . . 7
2.3 Defined Types of Parallel Tasks . . . . . . . . . . . . . . . . . . . . . . . . . 8
2.3.1 Mentally Oriented Tasks . . . . . . . . . . . . . . . . . . . . . . . . . 8
2.3.2 Physically Oriented Tasks . . . . . . . . . . . . . . . . . . . . . . . . 9
2.3.3 Hybrid Tasks . . . . . . . . . . . . . . . . . . . . . . . . . . . . . . . 9
3 Comparison of Different Laboratory Test Results of Subjective Speech
Quality Measurement 11
3.1 Summary . . . . . . . . . . . . . . . . . . . . . . . . . . . . . . . . . . . . . 11
3.2 Publication . . . . . . . . . . . . . . . . . . . . . . . . . . . . . . . . . . . . 11
xCONTENTS xi
4 Call Duration Dependency on the Quality of VoIP Calls Analysis 18
4.1 Summary . . . . . . . . . . . . . . . . . . . . . . . . . . . . . . . . . . . . . 18
4.2 Publication . . . . . . . . . . . . . . . . . . . . . . . . . . . . . . . . . . . . 18
5 Parallel Task in Subjective Speech Intelligibility Testing 23
5.1 Summary . . . . . . . . . . . . . . . . . . . . . . . . . . . . . . . . . . . . . 23
5.2 Publication . . . . . . . . . . . . . . . . . . . . . . . . . . . . . . . . . . . . 23
6 Parallel Task in Subjective Speech Quality Measurement 31
6.1 Summary . . . . . . . . . . . . . . . . . . . . . . . . . . . . . . . . . . . . . 31
6.2 Publication . . . . . . . . . . . . . . . . . . . . . . . . . . . . . . . . . . . . 31
6.3 Supplementary materials . . . . . . . . . . . . . . . . . . . . . . . . . . . . . 40
7 Testing the Speech Intelligibility for Czech Language 42
7.1 Summary . . . . . . . . . . . . . . . . . . . . . . . . . . . . . . . . . . . . . 42
7.2 Publication . . . . . . . . . . . . . . . . . . . . . . . . . . . . . . . . . . . . 42
7.2.1 Supplementary material . . . . . . . . . . . . . . . . . . . . . . . . . 51
8 Conclusion 56
8.1 Summary of the thesis and hypotheses verification . . . . . . . . . . . . . . . 56
8.1.1 Main Contributions . . . . . . . . . . . . . . . . . . . . . . . . . . . . 57
8.1.2 Author Publications List . . . . . . . . . . . . . . . . . . . . . . . . . 58
8.2 Future work . . . . . . . . . . . . . . . . . . . . . . . . . . . . . . . . . . . . 59
Bibliography 66Chapter 1
Introduction
1.1 Motivation
In the age of telecommunication and automation, technologies progress dramatically and with
incredibly fast speeds. Since it is strongly believed that better call quality brings to longer
call durations [1], each generation of devices has various advanced parameters and functions
designed to have a higher quality audio signal processing and noise suppression. To achieve
these goals, various objective and subjective tests are provided to investigate, compare and
improve the audio quality and speech intelligibility of emerging mobile technologies according
to ITU-T recommendations P.800 [2], P.835 [3], P.807 [4], and others.
1.2 Objective Tests
Objective methods are aimed to replace test subjects using applicable psycho-acoustic mod-
eling and to compare clean and distorted speech samples algorithmically. This assessment
is based on the physical parameters of the transmission channel. Most of the commonly
used objective algorithms, e.g., PESQ [5], POLQA [6], or E-model [7], provide excellent
compliance with the results of subjective tests in typical applications. The disadvantages of
this method are the worse reliability and the lower accuracy ratio for atypical applications
or for new methods in coding and compression of the signal on which the algorithm has not
already been trained [8]. Unlike objective tests, subjective tests are believed to provide more
accurate results, but they are also more demanding regarding time, equipment, effort, and
price.
1CHAPTER 1. INTRODUCTION 2
1.3 Subjective Tests
1.3.1 Subjective speech quality testing
Subjective speech quality testing or Quality of Experience (QoE) testing is designed to col-
lect subjective opinions (votes) from human test subjects following standardized procedures
specified, e.g., in [2].
ITU-T Recommendation P.835 [3] depicts methods for measuring speech quality for noisy
(and partially de-noised) speech. Its main application is a comparison of different noise
suppression algorithms. The advantage of the P.835 is that it makes it possible to evaluate
the speech quality and noise levels separately. Parameters of test environments are adopted
from ITU-T Recommendation P.800. Subjects evaluate tested samples on a five-point scale
separately for speech quality, noise annoyance, and overall quality of samples.
Both objective and subjective speech quality tests outputs are often mapped to the
subjective quality Mean Opinion Score (MOS). Terms S-MOS, N-MOS, and G-MOS are
adopted from ETSI TS 103 106 [9] and ETSI EG 202 396-3 [10]. These terms replace in the
further text the original SIG, BAK, and OVRL ratings used in [3].
1.3.2 Subjective speech intelligibility testing
In audio communication, intelligibility is being used to measure the clarity of speech in
various conditions. It has a direct impact on the amount of information transferred by the
communication act among the communicating parties. Intelligibility tests [4], [11], [12] are
designed to evaluate the human (or automated listener) ability to understand the meaning
of spoken words. In most cases, the output of objective and subjective speech intelligibility
tests is represented by a percentage of total correct votes by the subjects for each sample.
Multiple methods and their modifications were developed [13] and are discussed next:
DRT - Diagnostic Rhyme Test
The DRT measures the intelligibility of speech over communication systems. The test mate-
rials contain 96 rhyming monosyllable word pairs (e.g., veal-feel) that were selected to differ
in the initial consonant. During the test, the listener is asked which of the two rhyming
words presented was spoken.
DMCT - Diagnostic Medial Consonant Test
The DMCT is a variation of-the DRT with test materials consisting of 96 bi-syllable word
pairs (e.g., stopper-stocker) selected to differ in only their intervocalic consonant.CHAPTER 1. INTRODUCTION 3
DALT - Diagnostic Alliteration Test
The DALT is another variation of the DRT. Ninety-six monosyllable word pairs (e.g., pack-
pat) selected to differ in their final consonant only.
MRT - Modified Rhyme Test
The MRT [14] was standardized by ANSI to measure the intelligibility of communication
systems. Its test material consists of 50 rhyming monosyllable word sets of 6 words (e.g., pin,
sin, tin, fin, din, win) selected with half to differ in the initial consonant and the other half
in the final consonant. As in the DRT case, the listener is asked which of the six presented
rhyming words was spoken.
1.4 Scope and Objective
This thesis is concentrated on subjective speech quality and subjective speech intelligibility
test techniques and related parallel tasks, which are meant to simulate real-life conditions
for the proposed tests.
To answer the most important questions of this thesis, the following hypotheses were
formulated:
1. Subjective tests provided in different laboratories are repeatable if test requirements
are strictly followed.
2. In VoIP communications, higher call qualities lead to longer call durations in average.
3. Subjective speech intelligibility values are lower when subjects perform additional (par-
allel) tasks instead of fully concentrating on the conversation.
4. Subjective speech quality test results performed with parallel task provide higher vote
dispersion (and thus RMS) while keeping the MOS values (arithmetical mean) un-
changed.
1.5 Structure of the Thesis
This doctoral thesis is written in the format of a thesis by publication approved by the Dean
of Faculty of Electrical Engineering and by the Directive for dissertation theses defense,
Article 1.
The thesis presents publications relevant to the topic of the thesis as individual chap-
ters. Each chapter begins with a summary section, where the main topic, conclusion, and
contribution of the research work is explained.CHAPTER 1. INTRODUCTION 4
The whole thesis is divided into nine parts with corresponding chapters.
Chapter 2 analyzes already existing approaches, State of the Art mechanisms, their
advantages, and disadvantages.
Chapter 3 deals with a repeatability verification of inter-lab and intra-lab subjective
speech quality assessment results.
The aim of Chapter 4 was to confirm call duration dependency on the quality of VoIP
calls.
Chapter 5 brings the idea of the parallel task in subjective speech intelligibility testing.
In Chapter 6, the parallel task is used in subjective speech quality measurement.
Chapter 7 presents the implementation of the parallel task in the Czech language.
The conclusion and summary, as well as hypotheses verification and future work, are
provided in Chapter 8Chapter 2
State of the Art
2.1 Introduction to Recommendations
Various standardized methods for performing subjective tests were designed for listening
tests and for conversation. They are also different in terms of listeners selection or rating
scales. The most commonly used standards for subjective tests are:
2.1.1 ITU-T Recommendation P.800
ITU-T P.800 [2] includes a set of methods for the quality of speech transmission evaluation.
For covered methods, the standard defines test room parameters (dimensions, reverberation,
noise levels, etc.). The listeners are allowed to participate the tests once a specified period
of time. Some regularly used methods are:
• Absolute Category Rating (ACR) is a listening test where the subjects evaluate the
sample on a scale from 1 (bad) to 5 (excellent) without knowledge of the reference
signal.
• The Conversation-opinion test is a conversational test, where two subjects evaluate the
quality of the conversation on the same scale as in the ACR.
• Comparison Category Rating (CCR), Degradation Category Rating (DCR), and Quantal-
Response Detectability Tests are methods that use various rating scales and various
ways of comparing a degraded signal with a reference.
2.1.2 ITU-T Recommendation P.835
ITU-T P.835 [3] describes methods for evaluating speech quality in the event of noisy (and
partially de-noised) speech. It is used, e.g., to compare various noise suppression algorithms.
The methodology makes it possible to evaluate speech quality and noise levels separately.
5CHAPTER 2. STATE OF THE ART 6 The test environment parameters are adopted from ITU-T P.800. Listeners evaluate tested samples on a five-point scale. 2.1.3 ITU-R Recommendation BS.1116 Recommendation ITU-R BS.1116-3 [15] serves to assess minor faults in audio systems and for comparing technologies with high transmission quality. The ”double-blind triple-stimulus with hidden reference” method uses a comparison of a reference sample with two tested samples, where one of the tested samples is a hidden reference. Unlike the P.800 series, this standard suggests using of expert listeners for more reliable fault detection. The lis- tener evaluates interference in the tested sample on a scale from 1 (very annoying) to 5 (imperceptible). The standard prescribes the characteristics of the audio equipment that is used, and also the dimensions and parameters of the test room. 2.1.4 ITU-R Recommendation BS.1534 MUSHRA Recommendation ITU-R BS.1534 [16] ”Multiple Stimuli with Hidden Reference and Anchor” is similar to BS.1116, but designed to test systems with lower transmission quality and greater disturbances. The use of expert listeners makes it possible to achieve more accurate results with fewer evaluators [17]. Researchers in [18] found no difference in the ratings of naive and expert listeners when there were only timbre artifacts in the tested signal. In contrast, [19] shows that spatial artifacts are more rigorously evaluated by expert listeners. Listeners have access to all the tested samples at the same time, and samples can be freely compared with the reference. In the test set, there is also one hidden reference, and there are one or two anchors (intentionally degraded/filtered references). Listeners evaluate samples on a scale of 0-100 points, often using sliders in a computer program. 2.1.5 Crowdtesting Crowdtesting is a method that uses some crowdfunding practices for QoE testing in multi- media applications. Each tester/user evaluates the quality of the transmission himself in his own environment. The advantage is a large and diverse panel of internationally geographi- cally distributed users in realistic user settings, and a reduction in cost and in organizational demands. The problem is to ensure that the evaluation is reliable. Advanced statistical methods are required to identify reliable user ratings and to ensure high data quality. The method is described in more detail in [20], [21], and [22].
CHAPTER 2. STATE OF THE ART                                                                     7

2.1.6     Comparison of Recommendations
Table 2.1 describes commonly used recommendations, their advantages and disadvantages.

 Table 2.1: Comparison of various recommendations, their advantages and disadvantages
 Recommendation           Description              Advantages              Disadvantages
                          Listening and           Traditional and          Less sensitive to
 ITU-T P.800
                       conversational tests       proven method           small impairments
                                                                         Complex setup, real-
                                                Allows for delay and
 ITU-T P.805           Conversational tests                                  time network
                                                  echo evaluation
                                                                          simulator required
                                                Results show smaller
                       Listening tests with                                Time consuming
                                             variance than with P.800
 ITU-T P.835           separate speech and                               (each sample played
                                             for noisy and/or denoised
                     noise quality judgement                                 three times)
                                                       samples
                        Listening tests for
                                                  Sensitive to small       Expert listeners
 ITU-R BS.1116          small impairments
                                                    impairments                required
                            judgement
                          Listening tests
 ITU-R BS.1534                                Sensitive to intermediate Time consuming (triple
                      with hidden reference
 MUSHRA                                         level of impairments      stimulus listening)
                            and anchor
                         Deploying larger                                 Complex measures
 Crowdtesting          amount of (remote)      Cost and time efficient    needed to exclude
                             listeners                                   unreliable responses

2.2      Problem Definition
The main issue of subjective tests is the fundamental philosophy of currently used testing
methods. They suggest that the test subjects are comfortably seated in a test room (usu-
ally anechoic or semi-anechoic) and are entirely focused on listening to the tested material.
However, in real life, the users usually perform multiple tasks at once (such as talking on
the phone and working on a PC, walking or driving a vehicle, or monitoring a screen with
airplane location and approach situation while communicating with the airplane pilot on the
radio-link).
   Most of the existing approaches and related standardized recommendations assume that
the method of laboratory testing with subjects fully concentrated on subjective tests provides
the most robust results, which is not always true.
   To bring the above stated subjective tests results closer to the real-life conditions, addi-
tional psychomotor (or parallel) tasks are implemented into those tests. This technique is
aimed to distract the users’ attention from the main subjective testing procedure.
CHAPTER 2. STATE OF THE ART 8
2.3 Defined Types of Parallel Tasks
In scientific literature, parallel-task techniques can be divided into three types: Mentally
oriented tasks, Physically oriented tasks and Hybrid tasks. Some of available experiments
are discussed in Table 2.2.
Table 2.2: Resource Summary
Reference Test type Parallel task Parallel task type Language
Speech Memorizing Mentally
[23] N/A
intelligibility digits oriented
Speech Memorizing Mentally
[24] English
intelligibility digits oriented
Speech Word repetition; Mentally
[25] English
intelligibility Memorizing digits oriented
Speech Memorizing Mentally
[26] Korean
intelligibility sentences, Arithmetic oriented
Speech Pressing Mentally
[27] German
intelligibility color buttons oriented
Matching Mentally
[28] QoE test N/A
colored squares oriented
Speech Forward / backward discrimination Mentally
[29] English
intelligibility and speech understanding oriented
Memorizing tones; Physically
[30] Other N/A
memorizing words oriented
Speech Turning a Mentally
[31] English
intelligibility nut on a bolt oriented
Telephone
[32] Other Hybrid English
call
Tasting;
[33] QoE test Car Hybrid English
driving
2.3.1 Mentally Oriented Tasks
Among observed experiments with mentally oriented parallel-tasks, memory-related tasks
requiring subsequent repetition and memorization of information are used the most fre-
quently. For instance, in the experiment [23], the test subjects had to identify prescribed
letters while remembering the five digits displayed or played before the description. The
results of this experiment depend on both the quality of the used codec and the intelligi-
bility of the description and on the way the numbers are presented and how the conditions
are sorted (serial/random). Memorization tasks are also used in [24], [28], and [29]. In the
experiment [24], the primary test condition consisted of the different levels of noise in the
test sentence background. The listeners’ task was to repeat the last word of the sentence or
try to guess it if it was unintelligible. The second task for the listeners was to repeat the last
words after eight sentences. The next experiment [28] included a group of 64 children for aCHAPTER 2. STATE OF THE ART 9 speech intelligibility test. A task for half of them was to remember digits, and for the other half – to pay their primary attention to word repetition. Single-task and dual-task perfor- mances were compared. Results show that significant dual-task decrements were found for digit recall, but no dual-task decrements were found for word recognition. In [29], subjects, as a parallel task, had to write down the sentence they heard or write down the sum of first and third numbers they heard. In experiments [25] and [30], listeners were asked to solve simple mathematical examples while pressing the corresponding keys to respond to different colors displayed on a screen. [25] was primarily about comparing different speech synthesis systems. In [30], human and synthesized speech with transmission degradation (compression, noise, packet loss) were compared. In both experiments [25] and [30], the results showed that the worse the quality of speech (and thus the clarity of the assignment of the primary task) is, the longer the reaction times in the secondary task. In [30], under the worst-case transmission, some subjects completely omitted the secondary task. In the next experiment [31], younger and older adults had to understand the target talker with and without determining how many masking voices were presented in samples time reserved. 2.3.2 Physically Oriented Tasks Physically oriented tasks usually include activities like running, cycling, or other physical or sporting exercises. For example, the experiment [26] consisted of two parts. The first part included professional golfers as subjects that performed the golf-putting task on a carpeted indoor putting green. At the same time, they had to listen to a series of tones from the audio player and to identify and report a particular tone. The results showed that the subjects performed better with an additional listening task than without it. In the second part, the respondents’ task was to lead the soccer ball by slalom from cones while listening to a series of words, meanwhile identifying and repeating the target word. The group of respondents consisted of experienced football players and non-players. Experienced players played better in the slalom in a parallel-task test. The presence of a secondary task and distraction led experienced athletes to better perform automatic and rehearsal moves. 2.3.3 Hybrid Tasks Hybrid tasks include both physical and mental activities. In the experiment [27], subjects had to drive a car in a simulated driving environment while handling a telephone call. In contrast to driving without a phone, the driver was significantly more likely to miss traffic marks while telephoning. They also had longer reaction times. The next experiment [33] deals with two different hybrid parallel tasks. In the first part, the subjects’ task was to
CHAPTER 2. STATE OF THE ART                                                                   10

drive a car on a PC-based car-driving simulator while assessing a music loudness of various
car sound systems. The next part of the experiment was focused on a sense of taste of
subjects. Several substances of different tastes, namely salt, sugar, wheat, and sweeteners,
were chosen as the main ingredients. The task was to differentiate among samples with
different proportions of these ingredients. For the first part of the experiment, results show
that the subjects were less critical of low-quality and medium-quality music recordings.
However, high-quality recordings were identified with no sensitivity degradation. For the
next part, similarly to the driving task, the quality in medium-quality audios is not sensitively
perceived when the subject is under a load.
Chapter 3

Comparison of Different Laboratory
Test Results of Subjective Speech
Quality Measurement

3.1       Summary
At the very beginning of the research, it was necessary to understand the basics of subjective
speech quality testing, as well to confirm the repeatability of the results among the test
provided by different laboratories. For this purpose, four different tests running the same set
of speech samples were provided in 3 laboratories deploying ITU-T P.835 methodology. Two
of the laboratories were located in the USA (Mountain View, CA and Boulder, CO, USA)
and one in Europe (Prague, Czech Republic). After that, the test results have been compared
in terms of Pearson correlation, RMSE, RMSE*, and numbers of pairwise comparisons. The
results of the tests show the level of inter-lab and intra-lab repeatability with the deployment
of identical test speech samples, and in strictly followed rules and requirements of ITU-T
P.800 and ITU-T P.835. This confirms that the performed tests were highly repeatable.

3.2       Publication
The detailed information about the research and test results are presented below in the
article [34].

                                              11
Int J Speech Technol (2017) 20:69–74
DOI 10.1007/s10772-016-9389-6
Subjective speech quality measurement repeatability: comparison
of laboratory test results
Jan Holub1 • Hakob Avetisyan1 • Scott Isabelle2
Received: 9 September 2016 / Accepted: 21 October 2016 / Published online: 3 November 2016
Ó Springer Science+Business Media New York 2016
Abstract This article reports on a multi-lab subjective audiovisual subjective and objective tests are being per-
listening experiment aiming at inter-lab and intra-lab test formed to analyze and improve the audiovisual quality of
results repeatability verification. An identical set of speech future products. Subjective speech quality testing is based
samples corresponding to contemporary networks has been on collecting subjective opinions (votes) from human test
tested by three independent labs deploying ITU-T P.835 subjects following standardized procedures as specified e.g.
methodology. The tests results have been compared in ITU-T P.800. (1996). Objective methods attempt to
regarding Pearson correlation, RMSE, RMSE* and num- replace human test subjects with relevant signal processing
bers of opposite pair-wise comparisons. The results show procedures, comparing clean and distorted speech samples
the level of inter-lab and intra-lab repeatability in the case algorithmically. Their final output parameter is often
of identical test speech samples utilization and thus confirm mapped into subjective quality scale (MOS) (ITU-T P.863
the subjective tests are highly repeatable in case they fol- 2014) The difference between subjective and objective
low recommendation requirements strictly. The tests also speech quality assessment is that subjective tests are more
show differences in results in case subject expectations are reliable but compared to objective tests also more
set differently using a wider set of test speech samples (as demanding in terms of time, effort and price. To be sure
presented in one of the labs). that test results are relevant they are often held in different
laboratories in parallel and afterwards the results agree-
Keywords Mean opinion score Speech quality ment is checked. However, in such repeated experiments,
Subjective testing Test repeatability Test reproducibility there is usually one or more parameters that differ lab-to-
lab, typically language used and deployed test subject
nationality are varied (Goodman and Nash 1982). The
1 Introduction purpose of our testing was to understand the level of inter-
lab and intra-lab test results repeatability while keeping all
Nowadays technology is being developed with incredibly parameters as identical as possible, including the language
high speed. New gadgets are appearing every month with and nationality aspects.
different characteristics and functions. A substantial part of In Chapter II, description of the experiment with basic
them process voice data and each of them is required to information about test locations and dates, considered
provide as high quality as possible. For this purpose, standards, number conditions of tested subjects, used
equipment, etc. is introduced.
Chapter III shows data analysis on obtained results of
& Hakob Avetisyan mean opinion scores (MOS) of speech quality, noise
avetihak@fel.cvut.cz
annoyance, and overall quality (as per ITU-T P.835 2003)
1
Department of Measurement, Faculty of Electrical and correlations between each couple of tests were calcu-
Engineering, Czech Technical University in Prague, Prague, lated. Afterwards, pairwise comparisons between each
Czech Republic couple of tests were performed without and with consid-
2
Boston University, Boston, USA eration of CI 95 coefficient interval.
12370 Int J Speech Technol (2017) 20:69–74
Chapter IV contains the conclusion and final remarks 5
about tests.
4
2 Experiment description
For data analysis four subjective tests were held in three
B1 tests
various laboratories. They are named as A, B and C. Two 3
of them were located in the US (Mountain View, CA and
Boulder, CO, USA) and one in Europe (Prague, Czech
Republic). Test A was performed in December 2014. B1 2
and B2 tests were held in April and July, 2015 respectively,
and C tests were held in May, 2015. B1 and B2 tests were
performed in the same laboratory however, subjects for B2
test were different from B1 test. 1
1 2 3 4 5
To be able to verify the inter-lab and intra-lab test
A tests
results repeatability, the same sample set had to be used in
all experiments. The speech sample set was prepared fol- Fig. 1 Speech MOS (S-MOS) and noise annoyance MOS (N-MOS)
lowing all relevant requirements of ITU-T P.800 (1996) of A and B1 tests. Blue circles show dependencies of S-MOS values.
and P.835 standards, i.e. two male and two female talkers, Orange squares show dependencies of N-MOS values. (Color
figure online)
studio quality recording apparatus with high SNR, ane-
choic recording environment, test sentences have been
5
selected from Harvard set of phonetically balanced sen-
tences (Appendix of IEEE Subcommittee on Subjective
Measurements 1969). The final selection contained 22
conditions, each condition being represented by at least 16 4
sentences (4 different sentences spoken by four different
speakers). Contemporary coders (wideband versions of
B1 tests
Adaptive Multi-Rate audio codec (AMR) (3GPP TS 26
3
071) and Codec for Enhanced Voice Services (EVS) (2015)
and selected cases of background noise (cafeteria, road,
etc.) have been used to create a balanced set of realistic
speech samples with reasonably uniform coverage of 2
quality range (see Figs. 1, 2, 3, 4, 5, 6, 7, 8, 9, 10, 11 and
12). It shall be noted that data set A contained a larger set
of conditions, for a total of 60, of which 22 were tested in 1
tests B and C. Only those 22 common conditions are 1 2 3 4 5
compared in this article, however, the fact the A tests were A tests
originally performed using wider set of conditions can
create bias between A and others tests. Fig. 2 Overall quality MOS (G-MOS) of A and B1 tests
The test methodology was based on ITU-T P.835 stan-
dard. This procedure is particularly suitable for samples judged during the second playout and, similarly to the first
processed by noise cancelling algorithms or coders where a half of samples, the third playout is for judging the overall
certain part of background noise is removed but the speech sample quality. The samples are played out in random order
itself is partially corrupted, too. The basic idea of the P.835 using different randomization for each listening panel.
is to repeat the assessment of each speech sample three The study (Pinson et al. 2012) shows that 24 is the
times, asking the subjects to focus on different aspect of the minimal number of subjects when tests are performed in a
sample quality during each playout: For the first half of controlled environment and 35 in the case of the public
samples, the subjects are asked to focus on speech quality environment or narrow range of audiovisual quality. In our
only during the first playout, to noise annoyance during the case (controlled environment), each condition has been
second playout and to overall sample quality during the last presented to 32 listeners (4 panels with eight listeners per
third playout. For the second half of samples, the first panel). All of them were naive native US English speakers.
playout is to judge noise annoyance, the speech quality is Also, the tests performed in Prague laboratory used native
123Int J Speech Technol (2017) 20:69–74 71
5 5
4 4
C tests
B2 tests
3 3
2 2
1 1
1 2 3 4 5 1 2 3 4 5
A tests A tests
Fig. 3 Speech MOS and noise annoyance MOS of A and B2 tests. Fig. 5 Speech MOS and noise annoyance MOS of A and C tests.
Blue circles show dependencies of S-MOS values. Orange squares Blue circles show dependencies of S-MOS values. Orange squares
show dependencies of N-MOS values. (Color figure online) show dependencies of N-MOS values. (Color figure online)
5 5
4 4
B2 tests
C tests
3 3
2 2
1 1
1 2 3 4 5 1 2 3 4 5
A tests A tests
Fig. 4 Overall quality MOS (G-MOS) of A and B2 tests Fig. 6 Overall quality MOS (G-MOS) of A and C tests
American listeners recruited from expats and other US A professional voting device has been used to collect the
citizens living in Prague or temporarily visiting the city. votes. The tests were conducted in low-reverberation lis-
Thorough recruiting procedure assures no subject lived tening rooms conforming to requirements of P.800 in full
outside the U.S.A. for more than 6 months prior the test. (reverberation time below 500 ms, background noise
The test participants were recruited by the listening labs below 30 dB SPL (A) without significant peaks in spectra).
using their common acquisition procedures, with the ratio
between male and female listeners between 40:60% and
60:40%. The age distribution approximately followed 3 Data analysis and results
human population age distribution in the range between 18
and 65 years of age. By further data processing, the corresponding MOS are
For the sound reproduction, Sennheiser HD 280 PRO obtained separately for speech quality (S-MOS), noise
professional headphones have been used. annoyance (N-MOS) and overall sample quality (G-MOS).
12372 Int J Speech Technol (2017) 20:69–74
5 5
4 4
B2 tests
C tests
3 3
2 2
1 1
1 2 3 4 5 1 2 3 4 5
B1 tests B1 tests
Fig. 7 Speech MOS and noise annoyance MOS of B1 and B2 tests. Fig. 9 Speech MOS and noise annoyance MOS of B1 and C tests.
Blue circles show dependencies of S-MOS values. Orange squares Blue circles show dependencies of S-MOS values. Orange squares
show dependencies of N-MOS values. (Color figure online) show dependencies of N-MOS values. (Color figure online)
5 5
4 4
B2 tests
C tests
3 3
2 2
1 1
1 2 3 4 5 1 2 3 4 5
B1 tests B1 tests
Fig. 8 Overall quality MOS (G-MOS) of B1 and B2 tests Fig. 10 Overall quality MOS (G-MOS) of B1 and C tests
The terms S-MOS, N-MOS, and G-MOS are adopted from A and others tests, setting the user expectations lower than
ETSI TS 103 106 (2014) and ETSI EG 202 396-3 (2008). in the other experiments.
These terms replace in the further text the original SIG, Speech and noise MOS correlations between A and B1
BAK, and OVRL ratings used in P.835. Correlations tests are shown in Fig. 1. Their values are 0.953 and 0.982
between test MOS are provided in Tables 1, 2, and 3. respectively.
In all tests involving A laboratory, the A results in MOS Figure 2 shows global MOS correlations between A and
categories above 3 seem to be systematically higher in S-, B1. Its value is 0.976.
N- and G-MOS. It was already mentioned that data set A In Fig. 3, speech and noise MOS correlations between A
contained a larger set of conditions, for a total of 60, of and B2 tests are shown. Their correlation values are 0.954
which 22 were tested also in tests B and C. We assume that and 0.985 respectively.
the fact the A tests were originally performed using a wider Figure 4 shows global MOS correlations between A and
set of conditions creates the above-mentioned bias between B2. Its value is 0.9812.
123Int J Speech Technol (2017) 20:69–74 73
Speech and noise MOS correlations between A and C Figure 6 shows global MOS correlations between A and
tests are shown in Fig. 5. Their values are 0.98 and 0.992 C. Its value is 0.986.
respectively. Speech and noise MOS correlations between B1 and B2
tests are shown in Fig. 7. Their values are 0.983 and 0.981
5 respectively.
Figure 8 shows global MOS correlations between B1
and B2. Its value is 0.992.
Speech and noise MOS correlations between B1 and C
4 tests are shown in Fig. 9. Their values are 0.979 and 0.977
respectively.
Figure 10 shows global MOS correlations between B1
C tests
3 and C. Its value is 0.989.
Speech and noise MOS correlations between B2 and C
tests are shown in Fig. 11. Their values are 0.968 and 0.985
respectively.
2 Figure 12 shows global MOS correlations between B2
and C. Its value is 0.986.
As can be seen in graphs, subjects’ votes were highly
1 similar, and correlation values were extremely close to its
1 2 3 4 5 maximum value.
B2 tests All the correlations of speech qualities, noise annoy-
ances, and overall qualities are introduced in tables below.
Fig. 11 Speech MOS and noise annoyance MOS of B2 and C tests. Table 1 represents correlations between speech qualities
Blue circles show dependencies of S-MOS values. Orange squares
show dependencies of N-MOS values. (Color figure online)
(S-MOS) of tests.
5
Table 2 Correlations between N-MOS of tests
A B1 B2 C
4 A 1 0.9816 0.9852 0.9922
B1 0.9816 1 0.9810 0.9768
B2 0.9852 0.9810 1 0.9853
C tests
C 0.9922 0.9768 0.9853 1
3
2
Table 3 Correlations between G-MOS of tests
A B1 B2 C
1 A 1 0.9762 0.9812 0.9857
1 2 3 4 5 B1 0.9762 1 0.9918 0.9893
B2 tests B2 0.9812 0.9918 1 0.9861
C 0.9857 0.9893 0.9861 1
Fig. 12 Overall quality MOS (G-MOS) of B2 and C tests
Table 1 Correlations between S-MOS of tests Table 4 Pairwise comparison between G-MOS for each pair of tests
A B1 B2 C A B1 B2 C
A 1 0.9529 0.9535 0.9800 A 0 14 (6.1%) 19 (8.2%) 11 (4.8%)
B1 0.9529 1 0.9833 0.9794 B1 14 (6.1%) 0 9 (4.8%) 6 (2.6%)
B2 0.9535 0.9833 1 0.9684 B2 19 (8.2%) 9 (4.8%) 0 12 (5.2%)
C 0.9800 0.9794 0.9684 1 C 11 (4.8%) 6 (2.6%) 12 (5.2%) 0
12374 Int J Speech Technol (2017) 20:69–74
Table 5 Average CI 95 of the tests 4 Conclusion
Average CI Average CI Average CI
95: S-MOS 95: N-MOS 95: G-MOS The results of data analysis of four subjective tests made in
three different laboratories show the level of inter-lab and
A 0.13 0.13 0.14
intra-lab repeatability in case of identical test speech
B 0.13 0.11 0.11
samples are used and confirm the subjective tests are highly
C 0.16 0.14 0.13
repeatable in case P.800 and P.835 rules and requirements
are strictly followed. The tests also show minor differences
in results in case subject expectations are set differently
Table 6 Pairwise comparison
A B C using a wider set of test speech samples presented in one of
between G-MOS for each pair
of tests with consideration of CI A 0 0 (0%) 0 (0%)
the labs.
95
B 0 (0%) 0 0 (0%)
Acknowledgements Authors thank Andrew Catellier and Stephen
C 0 (0%) 0 (0%) 0 Voran at the United States Department of Commerce’s Institute for
Telecommunication Sciences in Boulder Colorado for providing the
test premises and test subjects and also for valuable discussions
Table 2 represents correlations between noise annoy- related to this project.
ance scores (N-MOS) of tests.
Table 3 represents correlations between global qualities
(G-MOS) of tests. References
3.1 Pairwise comparisons of each test Appendix of IEEE Subcommittee on Subjective Measurements IEEE
Recommended Practices for Speech Quality Measurements.
(1969). IEEE Transactions on Audio and Electroacoustics. Vol
After data correlations, pairwise comparisons for each 17, pp. 227–246.
couple of tests were evaluated. The principle of comparison European Telecommunications Standards Institute. (2008). Speech
was the following: First, each global MOS value of each processing, transmission and quality aspects (STQ); speech
test was compared with all remaining global MOS values quality performance in the presence of background noise part 3:
Background noise transmission—Objective test methods. Euro-
of the same test. Afterwards, absolute differences (of every pean Telecommunications Standards Institute, ETSI EG 202
couple of tests) were calculated. Totally there were 231 396-3.
cases (22 datasets). European Telecommunications Standards Institute. (2014). Speech
Table 4 shows results of pairwise comparison between and multimedia transmission quality (STQ); speech quality
performance in the presence of background noise: Background
global qualities (G-MOS) for each pair of tests. First noise transmission for mobile terminals—Objective test meth-
numbers show the quantity of identified differences. ods. European Telecommunications Standards Institute, ETSI TS
Numbers in brackets show the difference percentage. 103 106.
Goodman, D. J., & Nash, R. D. (1982). Subjective quality of the same
speech transmission conditions in seven different countries.
3.2 Pairwise comparisons with consideration IEEE Transactions on Communications, 30(4), 642–654.
of subjective test confidence intervals 3GPP TR 26.952. (2015). Codec for Enhanced Voice Services (EVS);
Performance Characterization.
Due to the differences in pairwise comparisons between the 3GPP TS 26 071. Mandatory speech CODEC speech processing
functions; AMR speech Codec; General description
tests, pairwise comparisons with consideration of confi- ITU-T Rec. P.800. (1996). Methods for subjective determination of
dence intervals (CI 95) have been done. In Table 5 average transmission quality, Series P: Telephone transmission quality,
confidence intervals of the tests are presented. Laboratory ITU, Geneva, am. 1998.
B is represented only by its first test run (previously pre- ITU-T Rec. P.835. (2003). Methods for objective and subjective
assessment of quality, Series P: Telephone transmission quality,
sented as B1). Telephone Installations, Local Line Networks, ITU, Geneva.
During those comparisons, absolute differences of ITU-T Rec. P.863. (2014). Methods for objective and subjective
G-MOS of each pair of tests have been calculated. assessment of speech quality, Series P: Terminals and subjective
RMSE* (ITU-T TD12rev1 2009) (root mean squared and objective assessment methods, ITU, Geneva.
ITU-T TD12rev1. (2009). Statistical evaluation. Procedure for
error with suppressed influence of subjective testing P.OLQA v.1.0, SwissQual AG (Author: Jens Berger),
uncertainty) analysis shows the differences between the CI ITUTSG12 Meeting, Geneva, Switzerland, March 10–19, 2009.
95% interval borders of the pair (zero if the CI 95% Pinson, M. H., Janowski, L., Pepion, R., Huynh-Thu, Q., Schmidmer,
intervals overlap each other). C., Corriveau, P., et al. (2012). The influence of subjects and
environment on audiovisual subjective tests: An international
The CI 95 tests show that all the existing differences in study. IEEE Journal of Selected Topics in Signal Processing,
all pairwise comparisons have disappeared. The results are 6(6), 640–651.
shown in Table 6.
123Chapter 4
Call Duration Dependency on the
Quality of VoIP Calls Analysis
4.1 Summary
To verify the importance of providing subjective speech quality and speech intelligibility
tests in communication systems, it was necessary to present that users tend to talk longer
by their mobile devices if their call quality is higher. Call duration serves as an input
parameter in many network- and service-models [35]. It is affected by various factors [36],
particularly by the amount of information to be exchanged, social circumstances [37], gender
of the call parties [38] or their nationalities [39] and is generally of great interest when
examining large amounts of network data [40], [41]. For this purpose, over 16 million live call
records over VoIP telecommunications networks deploying ITU-T G.711 [42], ITU-T G.729
[43], and AMR-NB 12.2k [44] codecs have been analyzed with an average call duration of
220s. Distributions of call duration dependency on Critical Minute Ratio and call duration
dependency on the average MOS were considered. Further analysis showed that the results
were not as expected, and the average call duration appeared a non-monotonic function of
call quality. It turns out that alongside the assumption that better user experience brings
longer call durations is valid only for moderate to high quality, and lower quality also yields
longer call durations, which contradicts common expectations.
4.2 Publication
Since the results were surprising and meaningful to the scientist community, they were
published in the article [45].
18638 IEEE WIRELESS COMMUNICATIONS LETTERS, VOL. 7, NO. 4, AUGUST 2018
Analysis of the Dependency of Call Duration on the Quality of VoIP Calls
Jan Holub , Michael Wallbaum, Noah Smith, and Hakob Avetisyan
Abstract—This letter analyses call detail records of 16 mil- call quality. In some parts of the industry, e.g., in international
lion live calls over Internet-protocol-based telecommunications wholesale business, the ACD is used as a cost-effective indi-
networks. The objective is to examine the dependency between cator of subjective call quality. The underlying assumption is
average call duration and call quality as perceived by the user.
Surprisingly, the analysis suggests that the connection between that higher call duration means better user experience.
quality and duration is non-monotonic. This contradicts the com- Call duration, meaning the time difference between call
mon assumption, that higher call quality leads to longer calls. In establishment and call termination, serves as input parameter
light of this new finding, the use of average call duration as an in many network- and service-models [3]. It is influenced by
indicator for (aggregated) user experience must be reconsidered. a number of factors [4], particularly by the calling and called
The results also impact modeling of user behavior. Based on the
finding, such models must account for quality since user behavior party situation, amount of information to be exchanged, social
is not fully inherent, but also depends on external factors like circumstances [5], gender of the call parties [6] or their nation-
codec choice and network performance. alities [7] and is generally of great interest when examining
Index Terms—ACD, call detail record, call duration, Internet large amounts of network data [8], [9].
protocol, VoIP, voice quality, speech codecs, telephony.
II. BACKGROUND
This letter is based on call detail records (CDR) produced by
I. I NTRODUCTION a commercial non-intrusive VoIP monitoring system measur-
T IS widely assumed that longer call durations indicate
I better call quality. Indeed, this dependency between call
quality and average call duration (ACD) was reported for a
ing the quality of real calls in the network of a communication
service provider. The system method analyses the Session
Initiation Protocol (SIP) signaling messages as well as the
mobile network in 2004 [1]. However, the study was con- flow of Real-time Transport Protocol (RTP) packets, their
ducted in times when most of the mobile calls were charged interarrival times and the information contained in the pro-
based on their duration so that users were motivated to keep tocol headers. For every five-second segment of each RTP
calls as short as possible. Other conditions, such as the transi- flow, the system generates a quality summary with several
tion to IP-based packet switching and the introduction of new hundred metrics. Each summary contains basic information,
codecs, have also changed, which motivates a second look at such as the source/destination IP addresses, the used codec, as
the relation between call quality and duration. well as details about packet losses, interarrival times and the
Telephone calls carried over IP networks are affected by estimated quality. Estimates for the subjective quality are cal-
technical impairments, influencing the users’ subjective per- culated using the E-Model with information about the packet
ception of the call. Common technical impairments include loss, jitter, and the used codec as input. The E-Model yields
coding distortion, packet loss, packet delay and its variations an R-factor value for every time slice, which is mapped to
(jitter). The relation between the amount of each impairment an estimated MOS (Mean Opinion Score) value. MOS is the
and the final quality as perceived by a service user is not commonly used metric for subjective call quality. Finally,
simple, as impairments can mask each other; or two impair- the system marks ‘critical’ five-second segments which suffer
ments, each unnoticeable by itself, can multiply their effect from burst loss or excessive jitter. Specifically, a five-second
and become subjectively annoying. segment is marked as ‘critical’ if more than three packets are
Monitoring systems analyzing live calls in telecommunica- lost in sequence or if the packet interarrival time exceeds the
tions networks apply algorithmic models that attempt to esti- packet rate by 40 ms or more.
mate the subjective quality based on objective measurements The monitoring system’s CDRs describe the characteristics
of selected technical impairments. Commercial monitoring of each call from the signaling and media quality perspec-
products for voice over IP (VoIP) services often use deriva- tive. They summarize the five-second data, e.g., by storing the
tives of the E-model defined in ITU-T G.107 [2] to estimate minimum, average and maximum R-factor and MOS for each
call direction. Other quality metrics provided by the CDRs are
Manuscript received January 3, 2018; revised February 6, 2018; accepted
February 9, 2018. Date of publication February 15, 2018; date of current described in the next section.
version August 21, 2018. The associate editor coordinating the review of this
paper and approving it for publication was S. Zhou. (Corresponding author: III. DATA S ET C HARACTERISTICS
Jan Holub.)
J. Holub and H. Avetisyan are with the Department of Measurement, FEE, The data was provided as a database of CDRs, with each
Czech Technical University, CZ-166 27 Prague, Czech Republic (e-mail: database record corresponding to one call in the network. The
holubjan@fel.cvut.cz; avetihak@fel.cvut.cz). following parameters were used for the analysis: call duration,
M. Wallbaum and N. Smith are with Voipfuture GmbH, 20097 Hamburg,
Germany (e-mail: mwallbaum@voipfuture.com; nsmith@voipfuture.com). used audio codec, critical minute ratio (CMR) per media direc-
Digital Object Identifier 10.1109/LWC.2018.2806442 tion and average R-factor/MOS per media direction. CMR is
2162-2345 c 2018 IEEE. Translations and content mining are permitted for academic research only. Personal use is also permitted, but republication/
redistribution requires IEEE permission. See http://www.ieee.org/publications_standards/publications/rights/index.html for more information.You can also read