PERSPECTIVE Q2 2022 METROPOLITAN DETROIT COMMERCIAL REAL ESTATE - PA Commercial
←
→
Page content transcription
If your browser does not render page correctly, please read the page content below

PERSPECTIVE Q2 2022
METROPOLITAN DETROIT COMMERCIAL REAL ESTATE

OPPORTUNITY ZONES IN YEAR-5 AND ANTICIPATED
ADJUSTMENTS
Anthony J. Pellegrino | Senior Associate | P.A. Commercial

Four years ago, we published an article on the       sale of your investment any time after year
structure of the Opportunity Zone (OZ) program       10. As a result, the program has caught the
and how to take advantage of it. In year             eye of funds and investment dollars actively in
five, we will reflect on how this program has        application across the country.
advanced and what we can expect moving
forward with newly proposed adjustments.             The last four years have proven successful
                                                     for the opportunity zone in the areas of self-
The OZ is a capital gain deferment program           storage, multi-family, single-family, affordable
similar to a 1031 exchange but with new              housing, industrial-warehousing, renewable
allowances on funding sources, a differing exit      energy business, student housing, community
strategy, and limited geography designated           development, and more. In 2021 a Brookings
by the Governor of each state. Opportunity           Institute Report cited 780,862 new jobs were
Zones are designed to incentivize investment         created in Opportunity Zone tracts related to
into the country’s existing and shifting needs. It   the impact of OZ investment. By early 2020, it
connects industrial trade zones, housing, urban      was reported that 75 billion dollars had been
clean-up, and innovation needs to a high level       invested into Opportunity Zones through the
of private capital. It also allows small investors   program. OZ’s have a typical capital stack ratio
to participate and take the ten-year benefit for     of 4:1, providing a clearer picture of the total
themselves or future generations. The program’s      capital impact.
main benefit is a zero capital gains tax on the

                                                                                                              1
                                                                                        PERSPECTIVE Q2 2022
                                                                                          P.A. COMMERCIAL
PERSPECTIVE Q2 2022
METROPOLITAN DETROIT COMMERCIAL REAL ESTATE

The economy and country have development
                                                    With the new adjustments, we could expect:
needs that have not slowed down. Industrial,
housing, technology, and energy innovation          •   Extension the deferment date until 2028
are key sectors for our nation and continue to
mechanize our growth as an economy. Current         •   Removal of OZ designations for Median
market challenges such as rising construction           Family Income Tracts (MFI)
costs, interest rates, and inflation are directly
                                                    •   Reinstatement and expansion of reporting
challenging development proformas to match
                                                        requirements and oversight.
those growth-sector needs. The incentives of
the OZ combined with capital deferment needs        •   Allowing Opportunity-Funds to invest in
are a feasible way to pick up the slack moving          other Opportunity-Funds. (O-Funds)
forward with the new market challenges. Let’s
not forget, requirements under the United           •   Creation of a 1-billion-dollar fund for the
States-Mexico-Canada-Agreement (USMCA)                  territories of the District of Columbia.
are also nearing and continue to call for more
United States production minimums in auto and
other industries.                                   Before investing your funds into a 1031
                                                    Exchange or Opportunity Zone, always
What should investors expect next?
                                                    consult a tax professional. We appreciate
In early April, a group of bipartisan senators      you taking the time to read our update on
introduced the first substantial adjustments        Opportunity Zones and we enjoy serving as
to the OZ. Some are welcoming this as an            a resource to our client base.
opportunity for Governors to reconsider the
geography of their OZ districts. We can expect
more people to take advantage of the program
as it is popularized, especially if we experience
a capital gains increase.

                                                                                                             2
                                                                                       PERSPECTIVE Q2 2022
                                                                                         P.A. COMMERCIAL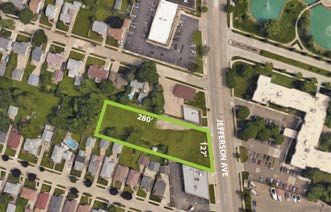
OFFICE MARKET REPORT                                                                                           Q2
METRO DETROIT
                                                                                                               2022
Many Detroit area businesses have continued utilizing hybrid working
                                                                                       FEATURED OFFICE LISTINGS
arrangements heading into 22Q2. As a result, office demand in the Detroit
                                                                                       IN THE METRO-DETROIT AREA
area dropped sharply last year, with just under 600,00 SF being returned
to the market. This trend continued through the early months of 2022, with
roughly 330,000 SF being returned to the market, with vacancy now at 11.6%.

LEASING
The subdued pace of leasing that finished off last year continued early
in 2022, but during the past few months, there was a spike in demand for
office space in the Detroit area. During 22Q2, just under 400,000 SF of space
was absorbed, the most significant amount since the pandemic hit. Recent               UP TO 14,630 SF FOR LEASE | DETROIT’S CBD

demand improvements are occurring as businesses debate the best return
to work policies. Detroit falls in the middle of the pack when assessing
affordability as compared to other Midwest markets, with average asking
rents of $21/SF as of 22Q1

SALES
Investment activity in 2021 started gaining some momentum, with 21Q4
seeing over $200 million in assets changing hands. Top submarkets for
                                                                                       OFFICE INVESTMENT| FARMINGTON HILLS
investor interest included Macomb West with $118 million and the Southern
I-275 Corridor with $91 million in sales. Pricing has picked up recently to $167/
SF during 22Q1 from closing out last year during 21Q4 at $107/SF. Meanwhile,
the market cap rate has compressed slightly to 9.3%

CONSTRUCTION
Roughly 2.2 million SF of space is underway, representing 1.1% of the market’s
inventory. Of the space underway, about 62% is already pre-leased.
                                                                                       2,600 SF OFFICE/RETAIL | MADISON HEIGHTS

Metro Detroit’s Office Market Statistics
 Market Area                          Inventory      Vacancy      Market        Market            SF Under           Market
                                      SF             %            Rent p/SF     Sale p/SF         Construction       CAP Rate

 The Pointes/Harper Woods             1.4 M         5.7%          $23.30        $111              0                  9.9%

 CBD                                  27.1 M        9.1%          $24.44        $139              855 K              9.3%
 Detroit - W of Woodward              4.9 M         21.8%         $21.88        $113              472 K              9.4%
 Detroit - E of Woodward              5.8 M         16.5%         $22.47        $112              0                  9.7%
 Southfield                           23.7 M        18.3%         $18.54        $112              0                  8.7%

 Farmington                           9.8 M         13.3%         $20.77        $142              0                  8.7%

 Southern I-275 Corridor              12.4 M        11.4%         $19.80        $132              27.1 K             9%

 Central I-96 Corridor                6.2 M         11%           $23.76        $166              48.6 K             8.5%
 Troy North                           5.5 M         18%           $20.88        $127              0                  8.6%
 Troy South                           13 M          25.6%         $21.36        $122              0                  8.8%
 Royal Oak                            5.6 M         9.8%          $20.95        $122              190 K              9.1%
 Macomb West                          9.6 M         6.2%          $18.35        $114              35.6 K             9.4%

 Macomb East                          8.5 M         7.8%          $17.92        $107              67.3 K             9.7%

 Airport District                     3.1 M         4.2%          $19.40        $110              0                  9.7%

                                                                                                                                   3
                                                                                                             PERSPECTIVE Q2 2022
For additional market information, contact P.A. Commercial. Source: CoStar.                                    P.A. COMMERCIAL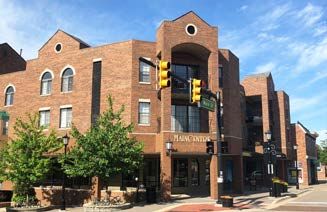
INDUSTRIAL MARKET REPORT Q2
METRO DETROIT
2022
Almost halfway through spring 2022, market conditions continue to work
in industrial landlords’ favor. Leasing for this type is just below the all-time FEATURED INDUSTRIAL LISTINGS
high, set at the start of 2022, and the vacancy rate of 4.5% is sitting near an IN THE METRO-DETROIT AREA
all-time low. Continued growth is expected in the Central I-96 Corridor as
these areas adjacent to the intersection of interstates 275 and 96/696 have
more space for development than submarkets closer to the urban core.
LEASING
Detroit’s industrial market has been operating at nearly full capacity for
almost half a decade, with availabilities running below the U.S. average
throughout most of 2015–21. The West of Van Dyke Submarket possesses the HIGH-BAY INDUSTRIAL FOR SALE | WARREN
largest industrial inventory in the Detroit area, representing 10% of the metro
area’s industrial space. However, the Airport District, the second-largest
submarket, accounted for the most significant amount of leasing into 2022,
taking in 36% of activity.
SALES
Sales activity over the past year marked a turnaround, with sales topping out
at $1.1 billion. Sales transactions were diffused throughout the metropolitan
12,721 SF FOR LEASE | STERLING HEIGHTS
area without a clear focal point of investor interest. The submarket with the
highest sales, West of Van Dyke/Macomb, only represented 14% of total
volume.
CONSTRUCTION
Since the start of the pandemic, there has been an uptick in construction
activity, with just more than 7.2 million SF under construction as of 2022q2, but
this represents about 1.2% of inventory, compared to 3.4% for the U.S.
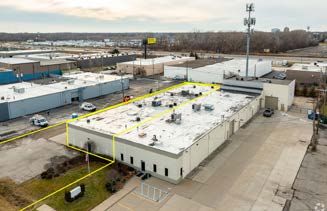
95,000 SF, OPPORTUNITY ZONE| REDFORD
Metro Detroit’s Industrial Market Statistics
Inventory Vacancy Market Market SF Under Market
Market Area
SF % Rent p/SF Sale p/SF Construction CAP Rate
Airport District 55.3 M 2.1% $7.98 $64 1.8 M 8.7%
Detroit East 46.3 M 12% $6.40 $56 0 8.7%
Detroit West 47.9 M 8.5% $6.11 $52 1M 9%
Groesbeck Central 15.7 M 2.3% $7.95 $68 0 9.4%
Groesbeck South 19.2 M 3.8% $7.23 $63 0 9.2%
Groesbeck North 32.6 M 1.3% $8.35 $76 310 K 8.9%
W of Van Dyke/Macomb 64.1 M 2% $8.79 $72 1.6 M 8.5%
Auburn Hills, Pontiac, Rochester 54.9 M 5.9% $9.13 $90 872 K 8.5%
Royal Oak 15.7 M 3% $8.04 $81 0 9.0%
Livonia 42.2 M 2.7% $8.28 $72 365 K 8.5%
Central I-96 Corridor 35.7 M 6.2% $10.27 $95 494 K 8.6%
Southern I-275 19.5 M 3.8% $7.92 $66 602 K 8.8%
Southfield 6.2 M 3.5% $9.25 $82 0 9%
Farmington/Farmington Hills 11.7 M 5.2% $9.55 $82 0 8.8%
Troy Area East 12.6 M 3.1% $8.66 $81 0 9.2%
Troy Area West 9.2 M 5.3% $9.72 $81 0 8.8%
4
PERSPECTIVE Q2 2022
For additional market information, contact P.A. Commercial. Source: CoStar.
P.A. COMMERCIAL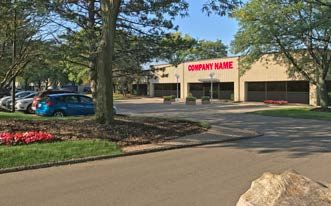
RECENT TRANSACTIONS Q2
OFFICE | INDUSTRIAL | RETAIL | LAND 2022
Below is a sample of property listings that the P.A. Commercial brokerage team have sold or
leased during Q1 - Q2 2022.
For a full list of office, industrial, retail, land, and other investment opportunities - please visit
www.pacommercial.com
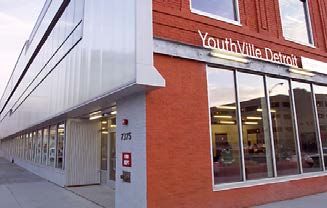
OFFICE SALE - ST. CLAIR SHORES OFFICE LEASE - DETROIT FLEX LEASE - LIVONIA
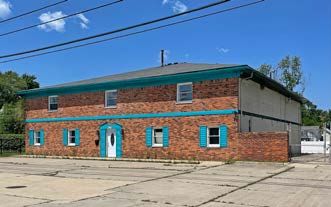
FLEX SALE - HAZEL PARK OFFICE LEASE - CLINTON TWP. INDUSTRIAL SALE- COMMERCE TWP.
RETAIL LEASE - NORTHVILLE LAND SALE - ST. CLAIR SHORES INDUSTRIAL LEASE - SHELBY TWP
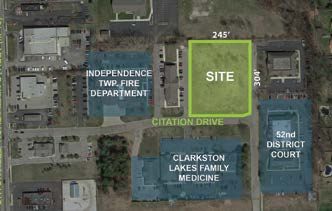
MEDICAL OFFICE SALE - CLINTON TWP. INDUSTRIAL SALE - HARRISON TWP. LAND SALE - CLARKSTON
5
PERSPECTIVE Q2 2022
P.A. COMMERCIAL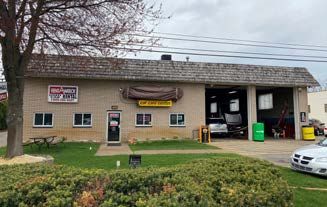
You can also read