Peru's Energy Policy and Climate Change - Presentation to the IFP Energies Nouvelles - Fondation Tuck
←
→
Page content transcription
If your browser does not render page correctly, please read the page content below
Presentation to the
  IFP Energies Nouvelles
                                 March 2015

Peru’s Energy Policy
and Climate Change

                     Eleodoro Mayorga Alba
                           Paris, March 2025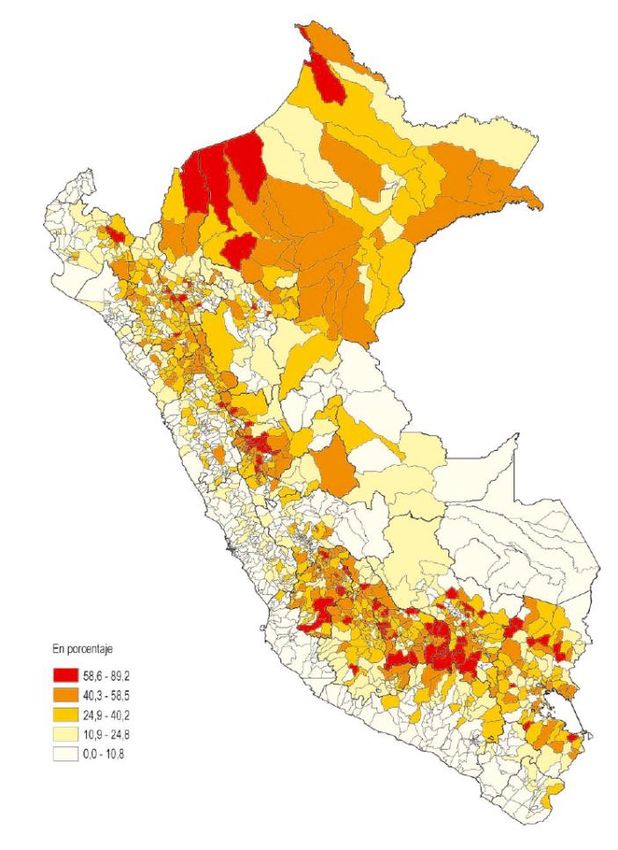
Content

1- Perú in Numbers

2- The energy outlook to 2025
   Diagnostic – The last decade
   Options to fight climate change

3- Main Challenges & Conclusions
Section # 1
Peru in Numbers
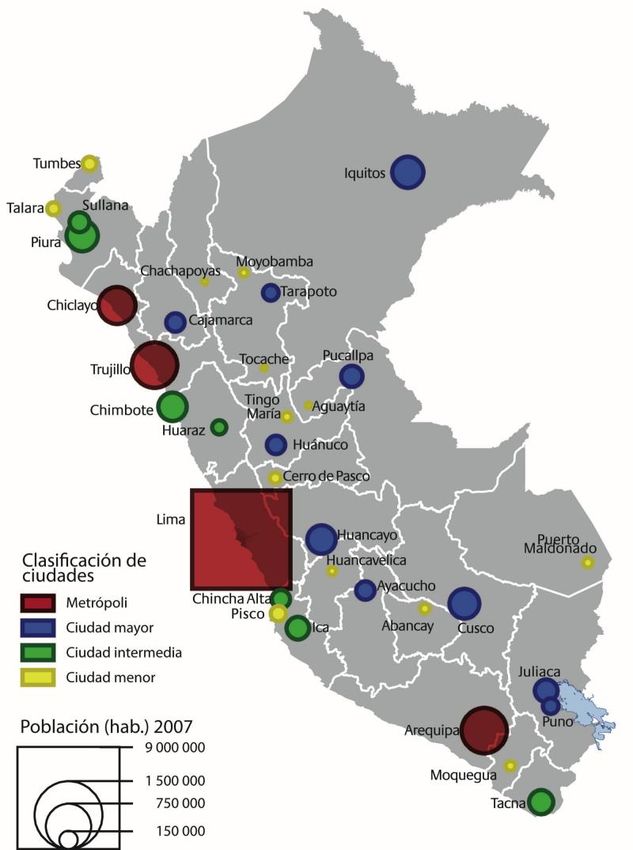
Basic information

• Population: +30 million

    • Annual change: 1.1%

    • Urban population: 75%

    • Coastal area: 52%

• High degree of economic
 concentration in Lima.

• High economic disparity
 between Lima and provinces.

                               Source: INEI and Geo Graphos.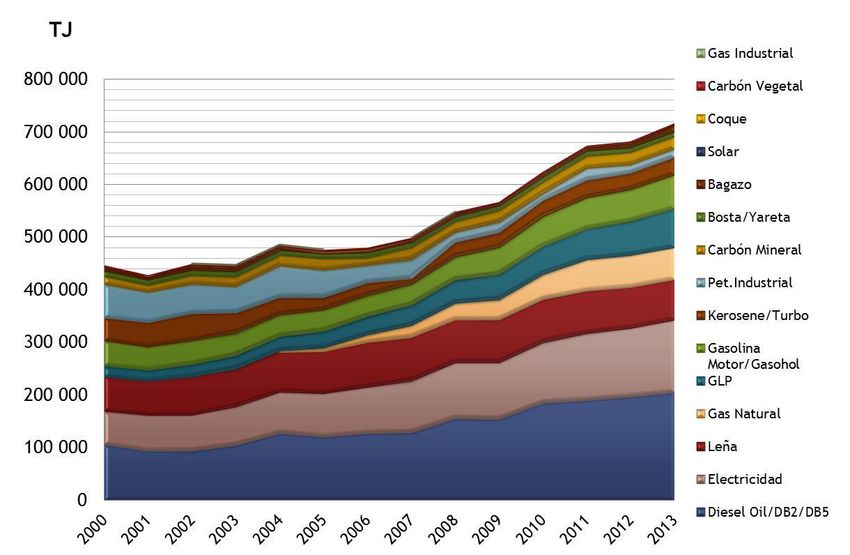
Stable economic model for 20 years
• The strong state intervention in the economy that
prevailed in the 70's and 80's was replaced by:
Privatization and concession programs.
Regulatory agencies (Osiptel, Ositran, Osinergmin, others).
A dual currency system (Soles and USD), with Central Bank
autonomy and free capital mobility.
• Now Peru is an open economy:
There are 20 free trade agreements, which account for 95% of
exports.
Non-discriminatory treatment of foreign investors.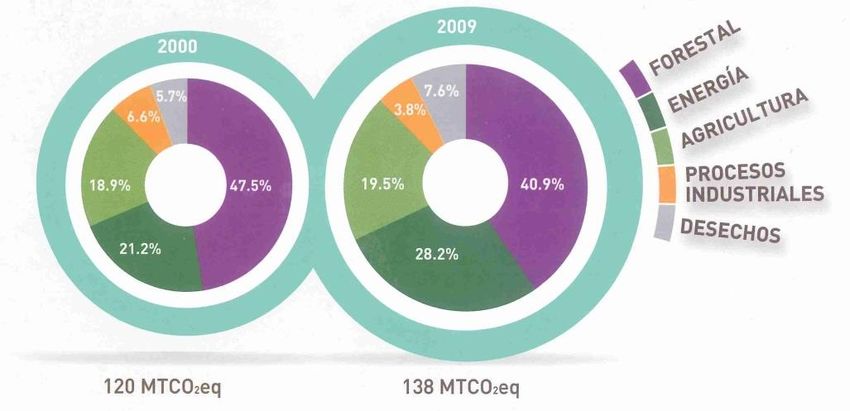
Economic indicators
  14%
  12%
           Average :
  10%       5.46%
                       Sustained growth
   8%
                       1993-2012 (annual
   6%
                          change %)
   4%
   2%
   0%
   -2%
         93
         94
         95
         96
         97
         98
         99
         00
         01
         02
         03
         04
         05
         06
         07
         08
         09
         10
         11
         12
                        In 2014, the drop of
                        commodity prices
                       impacted Peru GDP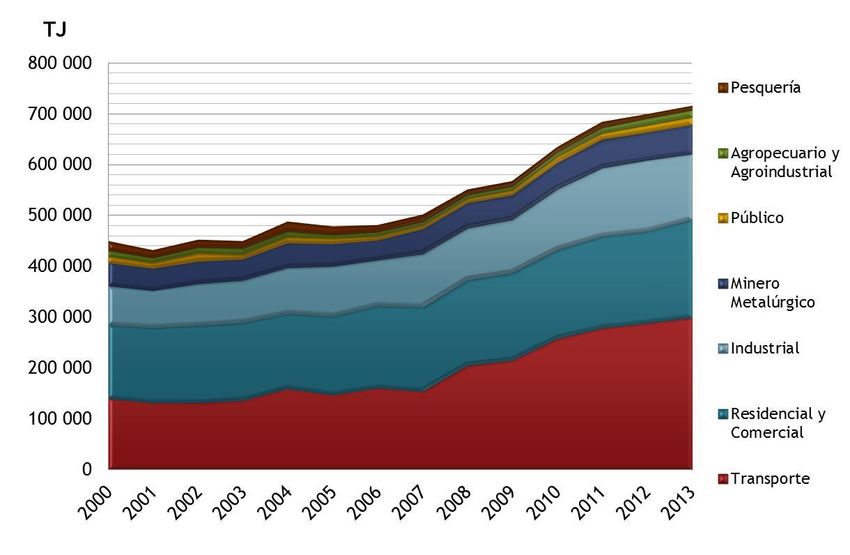
Growth and inflation in Latin America

             7,0

             6,5

             6,0
                               Chile and
             5,5
                               Colombia
Var. % GDP

             5,0

             4,5

             4,0

             3,5

             3,0

             2,5
                                                              (29.2 ; 0.4)
             2,0
                   0,0   2,0       4,0                6,0   8,0              10,0
                                         Inflation (%)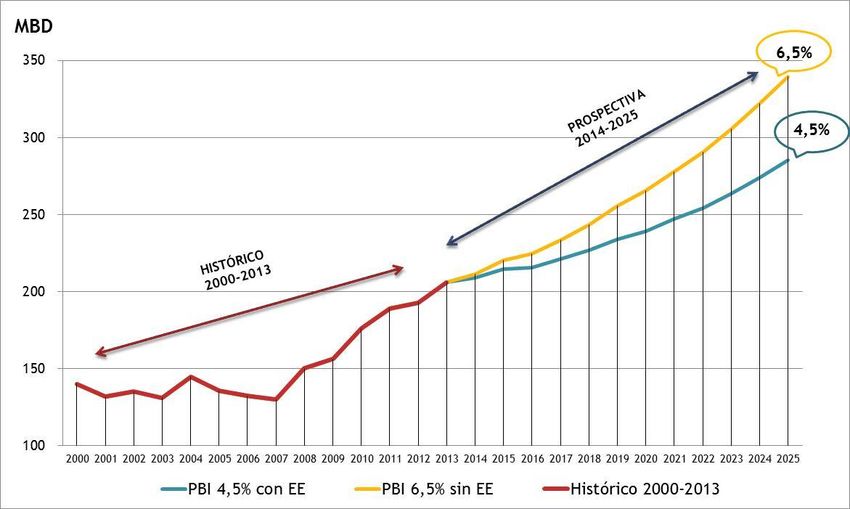
Mining Production in Peru

                               Global       Global
                 Mineral      Ranking      Ranking
                                2002         2014

                  Silver         1             2
                  Copper         5             2
                   Zinc          3             2
                   Lead          4             4
                    Tin          2             3
                   Gold          7             6

 Mining exports account for more than half of total commercial trade balance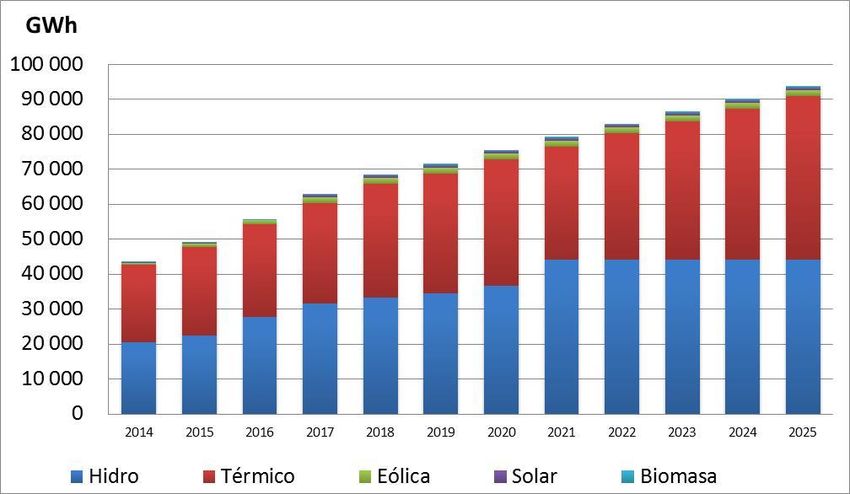
Mining sector projected growth
                Copper exports and mega projects
                            (1,000 metric tons)
3 000

                                                            2 633
2 500                                                        225    Quellaveco
                                                    2 175    120    A.Toquepala
                                            1 989            272    A. Cerro Verde
2 000
                                  1 769                      315    Las Bambas
                         1 532                               177    Toromocho
1 500            1 350                                       143    Antapaccay
        1 257
                                                             166    A. Antamina

1 000

 500

   0
        2011     2012    2013     2014      2015    2016    2017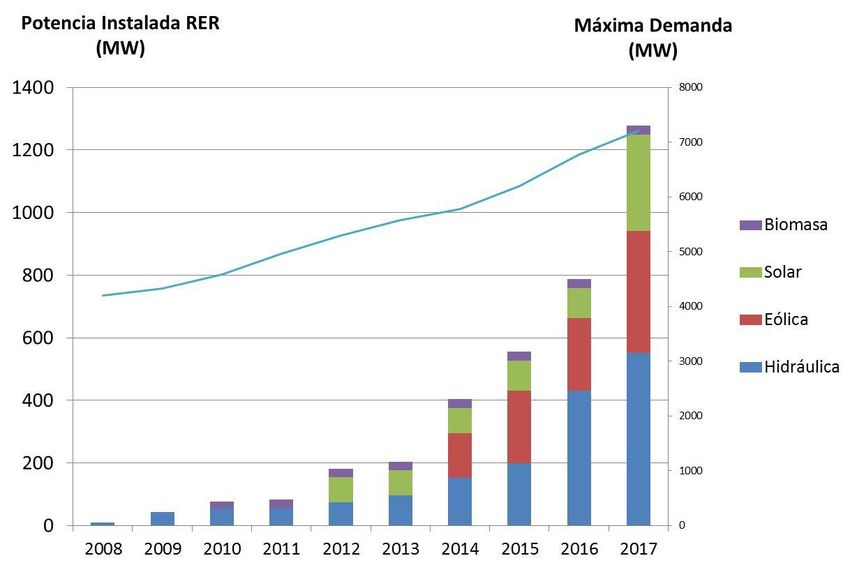
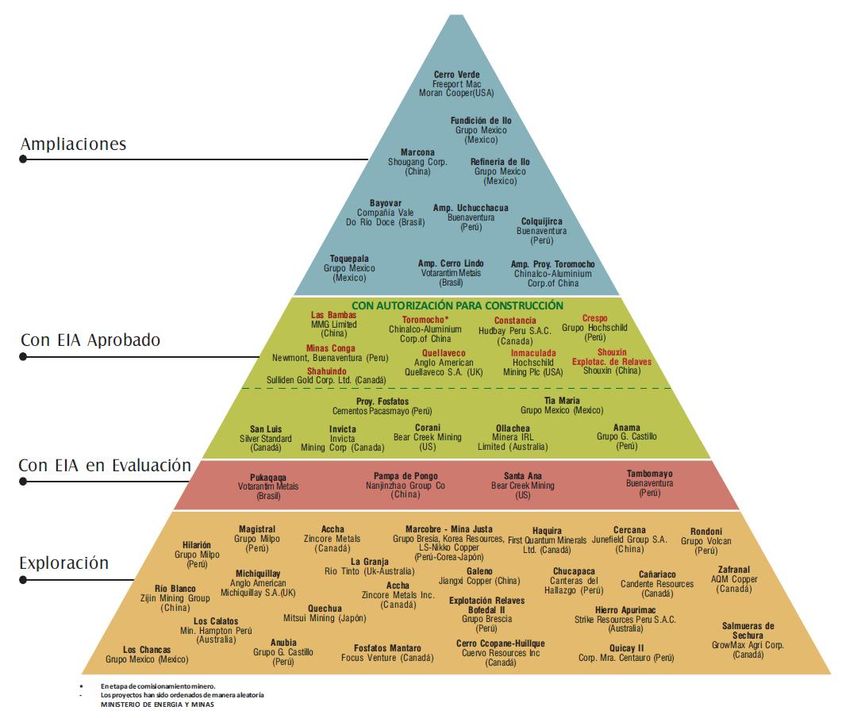
Portfolio of mining projects
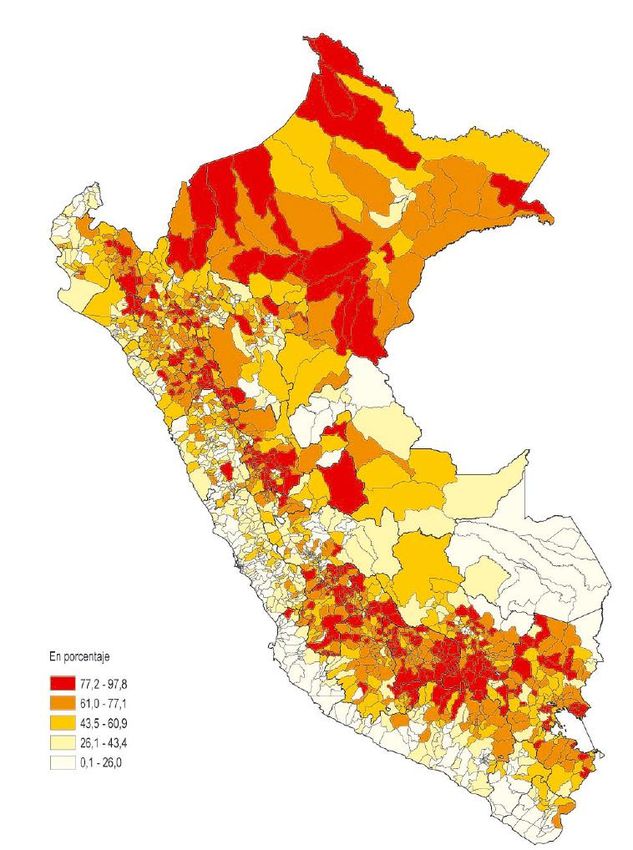
US$ 61,278 MILLDistribution of wealth >>> Poverty >>> and Extreme Poverty
Important structural weaknesses
•   Weak institutional framework.
•   Social conflicts in some regions.
•   The infrastructure gap remains important (million US$):

                      Infrastructure investment gap, 2012-2021
                                             Gap
                          Sectors                         % of total
                                          (million US$)
            Hydraulic infrastructure          8,682          26.2
            Water and Sanitation              5,335          16.0
            Drinking water                    1,569           4.7
            Sanitary sewer and treating
             blackwater
                                              3,766          11.3
            Telecommunications               19,170          57.8
             Broadband                       11,852          35.7
             Mobile Phones                    4,973          15.0
              Fixed                           2,345           7.1
            Total                            33,187         100.0
Competitiveness (WEF)
Institutions
Innovation Infrastructure
Business Macroeconomic
sophistication environment
Market Size Health and primary
education
Technological Health and secondary
readiness education
Financial market Goods market
development efficiency
Labor market
efficiencySection # 2 Peru’s energy sector Outlook to 2025
The last 10 years:
 •   The development of domestic natural gas has allowed
     Peru to dispose of sufficient energy for achieving high
     rates of economic growth.

 •   The electricity generation mix has incorporated up to 50%
     of modern gas thermal units.

 •   The consumption of traditional biomass fuels has declined
     (charcoal, wood,…) whereas the demand for gas and
     LPG has increased significantly.

 •   The consumption of diesel for transport has continued to
     grow in spite the starting in Lima of the operation of a first
     mass transport system.

 •   Hydroelectricity is a key energy source whereas the
     production of non-conventional renewables sources is still
     at the beginning.
Final energy consumption
By economic sectorFinal energy consumption
By energy source
Por SectoresProduction of Hydrocarbons
1. La propuesta de plan para el mediano plazo (hasta el horizonte 2025).
2. La propuesta para institucionalizar el proceso de planeamiento
energético en nuestro país.Production of electricity
In 2003 hydroelectricity represented 81% of total electricity generation. The
difference was thermal generation mainly with diesel and heavy fuels. Since 2004
onwards, gas thermal generation units have covered the demand growth.
2013
1. La propuesta de plan para el mediano plazo (hasta el horizonte 2025).
2. La propuesta para institucionalizar el proceso de planeamiento
energético en nuestro país.The supply of primary energy Year 2003 Year 2013
Energy Intensity and Per capita
                      consumption

TJ/103 hab                                                             TJ/106US$

        30                                                                     8

        28                                                                     7

                                                                               6
        26
                                                                               5    Per cápita
        24
                                                                                   consumption
                                                                               4
        22
                                                                               3
        20
                                                                               2

        18                                                                     1

        16                                                                     0

               Demanda de Energía per capita   Intensidad Energética
The oil and gas trade balance
Start up of
natural gas
exportsCrude oil P1 and P2 reserves There is a number of interesting prospects to be drilled in the coming months
Natural gas P1 and P2 reserves

                                                                             There are
                                                                            more than
                                                                            50 years of
                                                                             domestic
                                                                           consumption

There is a number of prospects that will be drilled in the coming months that could
significantly improve the gas reserves of Peru.
Projection to 2025 > Key Objectives: • A competitive energy supply. • Energy security and universal access. • A sustainable development of the country’s energy resources, with minimal environmental impact and low carbon emissions.
Main assumptions
1. Growth scenarios:
    • Base Case: The Peruvian economy grows at an annual rate of
      4.5%.
    • Alternative Case: The GDP growth rises to an annual average of
      6.5%. This case is developed to ensure that energy reserves and
      infrastructures are compatible to such high growth scenario.

2. Energy prices: will continue to follow international trends with the
exception of gas from Block 88. The drop of oil prices will mainly impact
the development of new oil supply sources.

3. Resource availability: Peru disposes of sufficient gas reserves
and hydro and renewable energy resources to respond to the growth of its
energy demand and to initiate exports to the region.

4. Renewables in power generation mix: To increase up to 5%.
Final energy demand The EE projections comprise the impact of energy conservation programmes.
Energy Conservation Policies
Residential sector
• Replacing conventional lightening with more efficient technologies.
• Replacing electric water heaters for solar water heaters.
• Introducing improved cooking stoves.

Industrial Sector and Services
• Replacing all industrial furnaces and conventional motors for more efficient
   units.
• Introducing cogeneration appliances.
• Replacing conventional lightening with more efficient technologies
Transport Sector
• To develop mass transport electricity or gas based systems in main cities
• To regulate the efficiency in new vehicles.
• To improve the vehicles park incl. more efficient CNG , LNG or electric units.
Petroleum products demand

Consumption up to 2025 will increase from 210 thousand barrels per day
(MBD) to 285 MBD in the base case and to 339 MBD in the alternative scenario
The natural gas demand

The natural gas demand will more than double in the next ten years to
achieve the expected economic growth.
Projecting final energy consumption
                   By energy sources

                                                       2025       2025
                                              2014   GDP 4,5%   GDP 6,5%
      Electricity                             19%      18%        20%
      Natural Gas                             13%      35%        35%
      Diesel                                  28%      19%        18%
      LPG                                     10%      12%        12%
      Motor Gasolines                          8%      4%         4%
      Turbo Jet                                5%      4%         4%
      Industrial fuel oil                      2%      0%         1%
      Mineral Coal & Derv.                     3%      3%         3%
      Traditional biomass (*)                 12%      5%         3%
                        Total                 100%    100%       100%
(*) Includes charcoal, wood, bagasse, etc .
Projecting the crude oil production At average crude oil prices of 70-80 USD/barrel, oil production is expected to increase from 62 MBD in 2013 to 153 MBD by 2021. At 40 USD/Barrel it would not reach 100 MBD
Gas
                                         (2025)
                                Tumbes

    Talara

         Paita             Piura

                                                      Cajamarca

                          Chiclayo
                                                                                                                    Distancia de Ductos en Km
                                                                                                                  Sierra Central – Trujillo: 1100
                                          Trujillo
                                                                                        Pucallpa                  Tumbes-Piura: 400
                                             Chimbote                                                             Trujillo-Piura: 500

                                                           Paramonga
                                                                        Tarma
                                                                                                   Camisea
             Proyecto de Masificación del uso de GN -
             Concesión Norte (Gases del Pacífico S.A.C.)
             Proyecto de Masificación del uso de GN –
             Concesión Sur Oeste (Fenosa Perú S.A.)
             Proyecto de Masificación del uso de GN –                           Humay              Abancay                         Cusco
             Zonas Alto Andinas (Transportadora de Gas
             Natural Comprimido Andino S.A.C.)
                                                                       Ica

                                                                                                                                                      Puno
                                                                       Marcona
         Distancia de Ductos en Km
-      Camisea – Lima : 850                                                                                             Arequipa
-       Perú LNG : 300                                                                                       Mollendo                      Moquegua
                                                                                                                             Ilo                             Bolivia
-       Ica-Marcona: 300
-       GSP con regionales: 1400                                                                                                                 Tacna

-       Loop Marcona-Mollendo: 500
Projecting the production of liquid fuels
MBD
350
300 -0,95%
250
3,71%
200
4,13%
150
3,01%
100
50 4,60%
0
2014 2015 2016 2017 2018 2019 2020 2021 2022 2023 2024 2025
GLP GASOLINA MOTOR TURBO JET DIESEL 2 PET. INDUSTRIAL
Imports will decrease as the refineries upgradings are completed and the production of
condensates increases along with gas production.Projecting the electricity production
PBI: 4,5% PBI: 6,5%
In both scenarios more than 60% of the electricity
generated comes from renewable sources.Energy intensity
Per capita energy consumption
Impact of Renewables in the SEIN
Section # 3
Peru’s energy sector
 Main Challenges &
    Conclusions
Main Challenges
1. Execute the investment plan in generation, transmission and distribution of
electricity, including renewables
a. Keep orthodox macro-economic policies and
b. A pricing policy in line with the international trend
2. Reduce oil imports
a. To promote the replacement of Diesel B5 by GN (CNG and LNG)
b. Promote the development of a national network of pipelines.
c. Diversifying exploration activity in riskier frontier basins, increasing exploration
commitments in existing contracts and promoting sustainable technologies with the
exploitation of proved undeveloped reserves.
d. Encourage exploration of areas with high prospectivity of gas resources.
e. Continue modernization projects refineries to have increased production of liquid
hydrocarbons derived from better quality.
3. Prepare the energy transition to reduce emissions of greenhouse gases
a. Encourage the replacement of traditional biomass and even LPG by GN in the Residential
and Transportation sectors.
b. Set national policies reduction in greenhouse gasesInvestments
Investments - mainly by private companies - should double
between 2014 and 2025
in current USD
Escenario PBI 4,5 % PBI 6,5%
Generation 6,700 7,300
Electricity Transmission and distribution 1,700 1,700
Upstream 5,200 6,000
Gas Transport and distribution 11,549 11,679
Petrochemicals 5,000 5,000
Upstream 16,000 18,000
Petróleo Downstream (refineries) 3,500 3,500
Total (MM US$) 49,649 53,179GDP vs Emissions of GhG Fuente: MINAM, 2010; INEI
GHG Emissions by sector
From Lima to Paris
• The UN Climate Change Conference, COP21 will be held in
  Paris, from 30 November to 11 December 2015.
• The objective of this conference is to achieve, for the first
  time in over 20 years of UN negotiations, a binding and
  universal agreement on climate, from all the nations of the
  world.
• The overarching goal is to reduce greenhouse gas emissions
  to limit the global temperature increase to 2 degrees Celsius
  above pre-industrial levels.
• Countries have agreed to outline actions they intend to take
  within a global agreement by March 2015. These
  commitments are known as Intended Nationally Determined
  Contributions or INDCs.
The Climate Change
The distribution of causes and effects of climate change is not
uniform. In particular, low-income countries, only marginally contribute
to the accumulation of GhG could suffer the greatest impact of global
warming.

Among the areas that would be most affected are Africa, South and
South-East Asia and Latin America, while countries such as China
and the USA would have a comparatively minor impacts and record a
greater responsibility in the accumulation of GhG.

Peru would be among the ten countries most vulnerable to climate
events. The main effects are associated preliminarily with:
   • glacial retreat,
   • increased frequency and intensity of rains (El Niño, in
       particular) and
   • raising the sea level.
Measures taken in Peru • Perú has been actively taking part since the 90’s in the Clean Development Mechanism. • The Government is preparing in addition to the INDC a number of voluntary NAMAs (National Appropriate Mitigation Actions) including measures in relation to forest conservation, energy and solid wastes. • Peru will be disproportionally impacted by climate change; it needs to actively prepare mitigation as well as adaptation measures.
Emisions of GgG by sector
     Case PBI 4,5% (Gg CO2 eq)
Reduction of GhG per unit of GDP By 2025, natural gas will be a dominating source in the energy matrix; this will subsequently allow the introduction of a larger share of renewables.
Final Remarks
• Final energy demand is expected to continue strongly correlated to GDP
  growth, the startup of new mines, and the impact of energy conservation
  programs in residential, industrial and transport sectors.
• It should be met with domestic resources, making use of low cost technologies.
  Gas will be for the projected period the most demanded energy source at the
  level of final consumers as well as for transformation into electricity and
  petrochemicals. Thus it is critical to boost the exploration and development of
  hydrocarbons, to construct gas pipelines and to upgrade the refineries.
• Energy access is another important task for the next decade, key to
  consolidate the sector reforms. This includes electricity access and
  development of gas networks in main cities.
• Energy efficiency policies will be directed to increase the sector
  competitiveness, to reduce environmental impacts as well as inequality in
  energy access. A key concern is the reduction of diesel consumption in the
  transport sector.
• The commitment to develop clean renewable energy sources will continue so
  as to take advantage of Peru’s potential and contribute to global reduction of
  CO2 emissions.
You can also read