Pharma Strategies in Latin America Keys to Success - March 15th, 2016 - Mapi 2015, All Rights Reserved - FDAnews
←
→
Page content transcription
If your browser does not render page correctly, please read the page content below
Pharma Strategies in Latin America
Keys to Success
                       March 15th, 2016

                     © Mapi 2015, All Rights Reserved
Pharma Strategies in Latin America
Keys to Success - Part 1
FDANEWS Webinar – March 15, 2016
Key Webinar Information: Host Introductions
Featured Webinar Hosts
Silvia Bendiner –
Director of Strategic Regulatory Affairs and Life Sciences,
Mapi Group
Fernando Ferrer –
Life Sciences Expert in Global and Latin American
Business Growth and Expansion Strategies;
Mapi Group Consultant
© Mapi 2015, All rights
3 reserved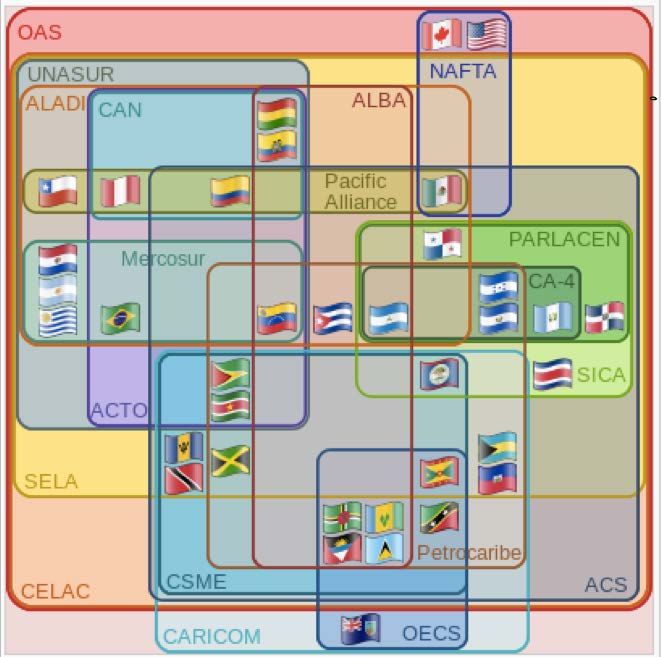
Air Force One will take President Obama
       to Latin America
              March 2016:
              President Barack
           Obama to visiting
           Argentina and the
           recently elected
President Mauricio Macri.

                      9 LATAM Countries visited by Mr. Obama
                          Mexico (5)      Costa Rica
   ✓                      Brazil          El Salvador
                          Chile           Panama
       ✓                                  Jamaica
                          Colombia
                                          Trinidad and Tobago
                                                References are available upon request

                                                   © Mapi 2015, All rights
                           4                             reserved
President Barack Obama visiting
President Raul Castro in Cuba

                                  References are available upon request

                                     © Mapi 2015, All rights
                     5                     reserved
Regulatory Landscape – Latin America
LATAM region does not have a centralized or harmonized
procedure for drug registration,
Adoption or adaptation of guidelines from ICH countries have
helped to harmonize the requirements for the development and
approval of new medicines.
LATAM countries have been aligning regionally and reinforcing
harmonization, through initiatives of the Pan American Health
Organization (PAHO) via the Pan American Network for Drug
Regulatory Harmonization (PANDRH).
References are available upon request
© Mapi 2015, All rights
6 reserved
Regulatory Landscape – Latin America
Supranational key regulating bodies in Latin
America
PAHO/OPS – Pan American Health Organization
PANDRH/Red PARF – Pan American Network for
Drug Regulatory Harmonization
WHO/OMS – World Health Organization
ICH – International Council for Harmonization of
Technical Requirements for Pharmaceuticals for
Human Use, Global Cooperation Groups
References are available upon request
© Mapi 2015, All rights
7 reserved
Regulatory Convergence - PANDRAH
Promotes efficiency, transparency, standardization
of regulatory function strengthening through active
participation and cooperation with NRAs in the
LATAM region.
Periodically defines strategies and mechanisms for
regulatory convergence, supports their
dissemination, adoption, and implementation by
PAN AMERICAN NRAs.
NETWORK FOR DRUG
REGULATORY Promotes the strengthening of competencies in
HARMONIZATION Good Regulatory Practices and Regulatory
Sciences.
PANDRAH: Comprised of
NRAs, Industry Promotes the exchange of experiences and
Associations, Academia
and NGOs; regulatory knowledge between NRAs within
PANDRH, as well as with NRAs outside of the
Strategic Development Region.
Plan 2014-2012
Participation of Industry, Academia and NGOs play
a critical support role in the implementation
PANDRAH’s strategic development plan.
References are available upon request
© Mapi 2015, All rights
8 reserved
PANDRAH – Regional Working Groups
PAN AMERICAN NETWORK Good Manufacturing Practices
FOR DRUG REGULATORY
HARMONIZATION (PANDRH) Bioequivalence and Bioavailability
Good Clinical Practices
Participating Regulatory
Agencies Combating Counterfeit Drugs
Good Laboratory Practices
NAFTA: US, Canada and
Mexico Pharmacopeia
Medicinal Plants
MERCOSUR: Argentina,
Brazil, Paraguay, Uruguay, Drug Classification
Venezuela and Bolivia.
Drug Registration
SICA: Central American Pharmacovigilance
countries
Vaccines
ANDEAN: Colombia, Ecuador,
Venezuela, Peru, Bolivia.
Promotion and Marketing
Biotechnology Products
CARICOM: The Caribbean
References are available upon request
© Mapi 2015, All rights
9 reserved
Regulatory Convergence - Function Strengthening
             across Latin America
•   CD50.R9: Strengthening National Regulatory Authorities for Medicines and
    Biologics for the qualification of regulatory authorities of regional reference
•   Currently, there are seven regulatory authorities in the Americas that qualified as
    competent and efficient in the performance (Level 4 category) per WHO
    recommended regulatory functions;
     1.   Argentina (2009)
     2.   Brazil (2010)
     3.   Colombia (2010)
     4.   Cuba (2010)
     5.   Mexico (2012)
     6.   Canada
     7.   United States of America

     •    The key topics for alignment have included sharing safety data, developing a
          common pharmacopeia, recognizing reciprocal acknowledgement of clinical site
          and GMP inspections.
•   On-going Institutional development plans in process for: Costa Rica, Chile,
    Dominican Republic, Ecuador, El Salvador, Guatemala, Honduras, Panamá,
    Paraguay, Trinidad & Tobago.
                                                                           References are available upon request

                                                                              © Mapi 2015, All rights
                                             10                                     reserved
Natural
Environment
Political
Economical
Organizational
Environment
S-W
Technological Social
Industrial
© Mapi 2015, All rights
11 reservedNations with over 200 years
with stable Democracies Elections 2016 – 2019 in Major Countries
BOL ARG GUA PAN VEN BRA URU MEX PAR ELS COR CUB T&T CHI COL HON BEL ECU JAM NIC DOR HAI PER
HUM AL A, Ollanta Apr-16
PRIVERT Jocelerme Apr-16
MEDINA, Danilo May-16
ORTEGA, Daniel Nov-16
SIMPSON MILLER, Portia Dec-16
CORRE A, Rafael Feb-17
BARROW, Dean Jun-17
HERNANDEZ,Juan Nov-17
Year of Independence of the 33 Latin American Nations SANTOS, Juan Manuel Nov-17
BACHELET,Michelle Nov-17
CARMONA, Anthony Feb-18
CASTRO RUZ, Raúl *Feb-18
SOLIS, Luis Guillermo Feb-18
SANCHEZ CEREN, Salvador Mar-18
CARTES, Horacio Apr-18
PEÑA NIETO, Enrique Jul-18
VAZQUEZ, Tabare Oct-18
ROUSSEFF , Dilma Oct-18
MADURO, Nicolás Apr-19
VARELA, Juan Carlos May-19
MORALES,Jimmy Sep-19
MACRI,Mauricio Oct-19
MORALES, Evo Dec-19
Jan-16 Aug-16 Feb-17 Sep-17Mar-18Oct-18May-19Nov-19 Jun-20
References are available upon request
© Mapi 2015, All rights
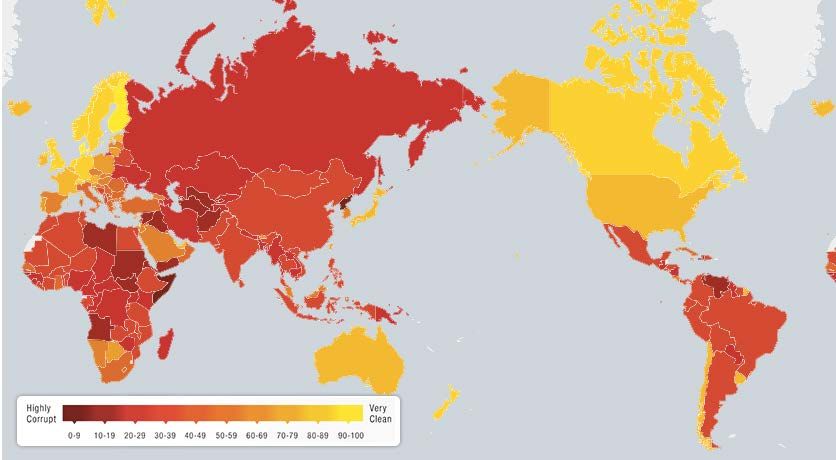
12 reservedWorldwide Corruption Perception of Public Sectors -
2015
– Australia, Brazil, Libya,
Spain and Turkey, have
deteriorated
– 2/3 of countries
worldwide have a
serious corruption Transparency
100
2014 2015
problem.
– Not one single country, 50
anywhere in the world,
is corruption-free. 0
References are available upon request
© Mapi 2015, All rights
13 reservedCoexistence of Growth Markets and Emerging
Markets in Latin America
~ 200 countries in the world
Developed Markets Growth Markets Emerging Markets
• High average income per capita • Current share of global GDP ≥ 1% • Current share of global GDP < 1%
• Advanced stages of economic • Favorable demographics and • Generally low GDP and incomes
development rising productivity going forward per capita, but rapidly increasing
in places
• Open and transparent financial • Adequate market size and depth • Scope for improvement of
markets to achieve scale and liquidity investment environment
33 Countries 8 Countries 160+ Countries
Brazil, Russia, India, China, + South
For example: US, EURO Zone, UK, For example; Nigeria, Vietnam,
Japan, Australia, Korea, Mexico, Indonesia and Philippines, Iran, Egypt, Pakistan and
New Zealand, Switzerland, Israel Turkey Bangladesh.
References are available upon request
© Mapi 2015, All rights
14 reservedG20 Members
The world’s largest advanced and emerging
economies
75% of international global-trade
85% of global GDP
2/3 of the world's population
Top 3 Latin American Economies
Argentina EU Turkey Australia
Brazil France Saudi Arabia China
Mexico Germany South Africa India
Canada Italy Indonesia
United States UK Japan
Russia South Korea References are available upon request
© Mapi 2015, All rights
15 reservedVarious initiatives helping the Political and
Economic integration
CAN - Comunidad Andina de Naciones 1969
Caricom - Comunidad del Caribe 1973
Mercosur - Mercado Común del Sur 1991
SICA / SIECA - Sistema de la Integración 1991
Centroamericana
NAFTA - North American Free Trade Agreement 1994
ALBA - Alianza Bolivariana para los pueblos de
2004
nuestra America
CAFTA-DR - Central American-Dominican Republic
Free Trade Agreement 2007
CELAC - Comunidad de Estados Latinoamericanos y
Caribeños 2010
UNASUR - Unión de Naciones Suramerican. 12 South
American Countries 2011
OEA - Organización de los Estados Americanos 1948
Bilateral free trade agreements with other Nations
and Economic Alliances --
References are available upon request
© Mapi 2015, All rights
16 reservedUS Dollar is getting much stronger in Latin America
6.58
7.00
Jan-15 Mar-16
Europe, UK, Canada,
6.00
China devaluated
5.00
8 – 12%
4.00
3.00
2.00 1.44
0.94 0.71
1.00
0.84 12% 0.63 13% 1.18 21% 6.08 8%
0.00
USD / EUR USD / GBP USD / CAD USD / CNY
20.00 18.85
Jan-15 Mar-16
Argentina,
15.44
15.00
Brazil, Mexico, 10.00
devaluated 5.00 4.09
8.57 80% 2.60 57% 14.59 29%
29 – 80%
0.00
USD / ARS USD / BRL USD / MXN
References are available upon request
© Mapi 2015, All rights
17 reservedVenezuela & Brazil with negative growth.
Venezuela & Argentina with high inflation rates
8.0 7.3
GDP growth (%) 6.7 6.2
6.0 4.5 4.0 4.4
4.0 2.8 2.6 2.8 3.2 2.4 2.4 2.2
1.7 1.8 2.0 2.0 2.1 2.3 2.3 2.3 1.6 1.5 1.7
2.0 1.3
0.5 0.6 0.9
0.0 0.1
0.0
-0.1
2015(f)
2016(f)
2015(f)
2016(f)
2015(f)
2016(f)
2015(f)
2016(f)
2015(f)
2016(f)
2015(f)
2016(f)
2015(f)
2016(f)
2015(f)
2016(f)
2015(f)
2016(f)
2015(f)
2016(f)
2015(f)
2016(f)
2015(f)
2016(f)
2014
2014
2014
2014
2014
2014
2014
2014
2014
2014
2014
2014
-2.0
-4.0 -3.0
Arg Arg Arg Bra Bra Bra Chl Chl Chl Col Col Col MexMexMex Per Per Per Ven Ven Ven Cub Cub Cub Ger Ger Ger USAUSAUSAChinChinChin Jap Jap Jap
-6.0
-3.7 -4.0
-8.0
-10.0
-10.0-10.0 2014 – 2015f – 2016f
Arg, Bra, Chi, Col, Mex,
10.0 9.5 Inflation (yearly average) (%) Per, Ven, Cuba, Germany,
7.5
USA, China, Japan
8.0
6.4
6.0 5.3
4.4 4.3 4.3 4.4 4.0 4.4
4.0 3.8 3.6 3.9
4.0 3.6
3.2
2.8 2.8 2.7
2.0
2.0 1.6 1.5 1.8
0.8 1.0 1.1 0.9 0.6
24 30 38 62 159 204 0.2 0.1
0.0
2015(f)
2016(f)
2015(f)
2016(f)
2015(f)
2016(f)
2015(f)
2016(f)
2015(f)
2016(f)
2015(f)
2016(f)
2015(f)
2016(f)
2015(f)
2016(f)
2015(f)
2016(f)
2015(f)
2016(f)
2015(f)
2016(f)
2015(f)
2016(f)
2014
2014
2014
2014
2014
2014
2014
2014
2014
2014
2014
2014
Arg Arg Arg Bra Bra Bra Chl Chl Chl Col Col Col MexMexMex Per Per Per Ven Ven Ven Cub Cub Cub Ger Ger Ger USA USA USAChinChinChin Jap Jap Jap
References are available upon request
© Mapi 2015, All rights
18 reservedVenezuela and Brazil with higher budget deficit
-5.4 2014
Ja Ja Ja Ch Ch Ch US US US Ge Ge Ge Cu Cu Cu Ve Ve Ve Pe Pe Pe M M M Co Co Co Ch Ch Ch Br Br Br Ar Ar Ar
p p p in in in A A A r r r b b b n n n r r r ex ex ex l l l l l l a a a g g g
-7.1 2015(f)
Budget balance (% GDP) -5.5 2016(f)
-6.2 2014
-10.0 2015(f) Brazil
-8.7 2016(f)
-1.5 2014
2014 – 2015f – 2016f -3.3 2015(f)
-2.2 2016(f)
Arg, Bra, Chi, Col, Mex, -1.7 2014
Per, Ven, Cuba, Germany, -3.1
-3.0
2015(f)
2016(f)
USA, China, Japan -4.5 2014
-4.0 2015(f)
-3.5 2016(f)
-0.3 2014
-2.7 2015(f)
-3.0 2016(f)
-14.9 2014
-24.3 -24.3
2015(f) Venezuela
-25 2016(f)
-2.2 2014
-4.1 2015(f)
-3.2 2016(f)
2014 0.3
2015(f) 0.9
2016(f) 0.6
-4.1 2014
-3.8 2015(f)
-3.6 2016(f)
-1.2 2014
-1.9 2015(f)
-2.3 2016(f)
-7.3 2014
-6.6 2015(f) Japan
-6.6 2016(f)
-15.0 -10.0 -5.0 0.0
References are available upon request
© Mapi 2015, All rights
19 reservedColombia, Brazil, Peru and Venezuela with higher
deficit
-0.1
Ja Ja Ja ChChCh U U U G G G CuCuCuVeVeVe Pe Pe Pe M M M CoCoCoChChCh Br Br Br Ar Ar Ar
Current account balance (% GDP)
p p p in in in SA SA SA er er er b b b n n n r r r ex ex ex l l l l l l a a a g g g
-2.1 2015(f)
-2.3
-4.4 2014 2014 – 2015f – 2016f
Brazil -3.4
-2.4 2016(f) Arg, Bra, Chi, Col, Mex,
-1.1 Per, Ven, Cuba, Germany,
2015(f)
-0.7
-1.6 USA, China, Japan
-5.2 2014
Colombia -6.2
-5.2 2016(f)
-1.9
-2.4 2015(f)
-2.0
-4.0 2014
Peru -4.0
-3.8 2016(f)
5.2
-3.0 2015(f)
Venezuela -4.0
2014 2.4
-0.4
-1.0 2016(f)
7.8
2015(f) 8.3
8.2
-2.2 2014
-2.6
-2.9 2016(f)
1.6
2015(f) 2.4
2.3
2014 0.5
1.9
2016(f) 2.0
-7.0 -5.0 -3.0 -1.0 1.0 3.0 5.0 7.0 9.0
References are available upon request
© Mapi 2015, All rights
20 reservedPeru, Cuba and Chile with the lowest debt-to-GDP
ratio
250 246 246 248
Public debt (% GDP)
200 2014 – 2015f – 2016f
Arg, Bra, Chi, Col, Mex,
Per, Ven, Cuba, Germany,
USA, China, Japan
150
105 105 106
100
75 75 71
68 68
59 Chile
52 55 52 53 53 Cuba
45 49 51 50 52 52 46
50 44 Peru 41 43
37 39 38 35 32 31
26
21 23
0
2015(f)
2016(f)
2015(f)
2016(f)
2015(f)
2016(f)
2015(f)
2016(f)
2015(f)
2016(f)
2015(f)
2016(f)
2015(f)
2016(f)
2015(f)
2016(f)
2015(f)
2016(f)
2015(f)
2016(f)
2015(f)
2016(f)
2015(f)
2016(f)
2014
2014
2014
2014
2014
2014
2014
2014
2014
2014
2014
2014
Arg Arg Arg Bra Bra Bra Chl Chl Chl Col Col Col MexMexMex Per Per Per Ven Ven Ven Cub Cub Cub Ger Ger Ger USA USA USAChinChinChin Jap Jap Jap
References are available upon request
© Mapi 2015, All rights
21 reservedLatin America and the Caribbean
o 615 million of inhabitants (8.5% WW)
122
People Language Nations Territories
391.7 Spanish 18 -
204.3 Portuguese 1 - 29
Privileged and Confidential
11.3 French 1 5 47
6.8 English 12 9 204
0.9 Dutch 1 6
615 LA&CB 33 20 30
o 20.5 millions of km2 (14% WW)
o along South and Central America, the Caribbean and part of North America
o GDP PPP U$D 9.5 trillion (8.4% WW, 4th after EU, China and USA)
o 18 countries (Continental + Dom. R.) account for 43
94% of the population 18
97% of the area Top 7
95% of the GDP Economies:
493 Million
People
Source: 2015 Analysis multiple sources.
IMF, Gazetteer, World Bank, CIA
References are available upon request
© Mapi 2015, All rights
22 reservedNRA’s moving towards Convergence
• National Regulatory Agencies (NRA) in Latin America are:
• transitioning towards Convergence in Regulatory Systems
Development guiding national regulatory policy.
• prioritizing their regulatory legal frameworks, structure and quality
management systems;
• defining core regulatory functions based on national policy
objectives;
• cooperating with partner / reference NRAs for regulatory policy
decision making, that is, leveraging regulatory processes as those
taken by more well established / resourced NRAs;
• International partner cooperation: PAHO/WHO, Gates Foundation,
World Bank.
• Private Sector: through the Pan American Network for Drug Regulatory
Harmonization (PANDHR),Industry Associations, Academia and NGO
References are available upon request
© Mapi 2015, All rights
23 reservedCaribbean Regulatory System (CRS)
The CRS will become a regulatory unit for CARICOM (Caribbean
Community Member States) based within CARPHA (the Caribbean Public
Health Agency) in Trinidad & Tobago.
The CRS to manage a centralized medicines registration process
focused initially on the WHO list of essential medicines (registration of
generic medicines for the treatment of no communicable diseases, as
well as some other priority antibiotics).
The process to be managed through an electronic platform to
facilitate issue of a single common registration.
The registration process: based on an abbreviated review procedure
leveraging information on registration and marketing authorizations
granted by Reference Authorities and/or WHO Prequalification
(information to be supplied by the manufacturer).
Initiative supported by the US FDA, Mexico, Argentina and the Gates
Foundation. Technical guidance by the WHO/PAHO
References are available upon request
© Mapi 2015, All rights
24 reservedLATAM - Regional Regulatory Requirements
Individual country legal requirements
MAA: Local presence/ direct representation-hosting/distributor
Market Authorization approval ownership
Language
Patent, trademarks, Intellectual Property
Individual country Regulatory dossier/MA requirements
Specific to NCE’s, generics, similar, biologic, vaccines, orphan drugs
International certifications, other specific docs.
Need for a local clinical trial or international trials accepted
GMP Inspection requirements
Reference product
Packaging and Labeling/country specific
References are available upon request
© Mapi 2015, All rights
25 reservedRegistration of Medicinal products in the Americas
ICH - CTD Regulatory Dossier
Module 1
Administrative and Legal Information – Country specific
Module 2:
Quality Information
Module 3:
Non clinical studies
Module 4:
Clinical studies
Annex I
Summary of Product Characteristics (SPC)
Annex II
Information on Labeling and Package inserts
Each country has its own application form to request health registration pursuant to
its own legislation.
Reference: PAHO Technical Document #10, PAHO – June, 2013
© Mapi 2015, All rights
26 reservedLATAM submission dossier platform
Common Key Data Requirements & Country Specifics Req.
Common RA content
Country specific
ARG MX - CO BR Renewals, Variations (level 1-2-3)
Administrative and Legal Documentation
BRAZIL Technical Reports: Product Information Primary Packaging Module 1
Production, QC, Stability, Pharmaceutical Equivalence,
Clinical & Pharmacological Report, Price Report Secondary Packaging Package Insert
API
Quality Information API & FPP Module 2
FPP
Pharmacology Pharmacokinetics Toxicology – General & Special
New excipients, New Route of Administration, Fixed Dose
New Fixed Dose Combinations
Combinations Module 3
Carcinogenicity Other Tox. studies Local Tolerance
Clinical Studies: Phases I,II,III & IV Pharmacovigilance Plan – Studies Special Populations Module 4
Annex I
Annex II - Information on Labelling and Package Insert
Summary of Product Characteristics
Sample: Developing a Regional Regulatory Strategy Dossier Roadmap – e Submission Tool
References are available upon request
© Mapi 2015, All rights
27 reservedStability Requirements across the Americas
Countries
Climatic
Country
zone
II Argentina, Mexico, Uruguay, United States of America
Bahamas, Belize, Canada, Chile, Costa Rica, Dominica, Dominican
IVA Republic, Ecuador, El Salvador, Grenada, Guatemala, Haiti, Honduras,
Jamaica, Nicaragua, Paraguay, Saint Kitts and Nevis, Trinidad and Tobago
Antigua and Barbuda, Barbados, Bolivia, Brazil, Colombia, Cuba, Guyana,
IVB Panama, Peru, Saint Lucia, Saint Vincent and the Grenadines, Suriname,
Venezuela
Climatic Long-term
Definition of Climate Criteria
zone testing conditions
II I Temperate ≤ 15 °C / ≤ 11 hPa 21 °C / 45% RH
IVA Subtropical and > 15 to 22 °C / > 11 to 18
II 25 °C / 60% RH
Mediterranean hPa
IVB III Hot and dry > 22 °C / ≤ 15 hPa 30 °C / 35% RH
IVA Hot and humid > 22 °C / > 15 to 27 hPa 30 °C / 65% RH
IVB Hot and very humid > 22 °C / > 27 hPa 30 °C / 75% RH
References are available upon request
© Mapi 2015, All rights
28 reservedGMP Certification – Inspection Requirements
• The majority of Latin American countries follow the WHO GMP
requirements.
• Argentina, Brazil, Colombia and Mexico enforce their own
inspection and GMP certification regimes (including international
inspections for API and Finished Product).
• Bolivia, Chile, Costa Rica, Dominican Republic, Guatemala,
Nicaragua, Panama, Peru, Puerto Rico, Venezuela and others
accept foreign GMP certifications.
• Brazilian GMP certification is mandatory for product registration
approval.
• Argentina, Colombia and Mexico accept GMP certifications from
high vigilance countries (i.e. USA, Europe, etc.).
References are available upon request
© Mapi 2015, All rights
29 reservedPopulation 2015 in Latin America
6 countries > 20 Million inhabitants
204
200
24 Nations with Population > 0.5 Million
150 122
100
47 43
50 30 29
Privileged and Confidential
18 16 15 11 11 10 10 9 7 6 6 5 4 3 3 1 1 1
0
Very different population profile in LA vs US and Canada
US and Canada 2015
Source: Census, CIA 2015
© Mapi 2015, All rights
30 reservedPhysicians and Beds /1000
Physicians /1000 population
4.3
3.9
2.5 2.3
1.9 1.9 2.1 2.1 2.1
1.5 1.5 1.7
1.2
Privileged and Confidential
1.1
0.7
0.2
Beds /1000 population
4.7
3.8
2.7 2.9
2.3 2.5
2.1
1.5 1.5 1.5
0.9 0.7 0.9
13.9 9.7 10.3
References are available upon request
© Mapi 2015, All rights
31 reservedThe challenges of the Pharmaceutical business in
Latin America
The Latin American countries when taken together possess
certain regional common many peculiarities and
characteristics in their political, differences that range from
geographical, socio-economic, infrastructure to local regulations
racial and cultural profile and market access,
all of which must be understood in order to create and implement
business strategies to capture the market of over 600 million
people.
References are available upon request
© Mapi 2015, All rights
32 reservedMajor Cultural Dimensions on the Major Latin
American Economies
Hierarchy should be respected and inequalities
amongst people exist
Collectivism and loyalty within the group
Consensus and cooperation in general, but
also with individualism, competitiveness and
reward orientation
Strong need for rules and legal systems in
order to structure life, but the individual’s
need to obey these laws is weak
References are available upon request
© Mapi 2015, All rights
33 reservedTechnologies impacting on the stakeholders and
medicine use
Patient-related Increased use of
- Social media medicines in a
- Apps appropriate
- Monitoring
safe
Provider-related cost-effective way
- Remote monitoring Medicine
- Diagnostics Use
- Decision-support tools
Prevention in the
- Electronic health records use of medicines
overuse
Payer-related misuse
- Real-world data analysis irresponsible use
- Value-based insurance
References are available upon request
© Mapi 2015, All rights
34 reservedThe paths of patients seeking information in the web
77 % of online health seekers in
the US start at search engines
Patient ? Search engine Data Social Media Testimonies Groups
References are available upon request
© Mapi 2015, All rights
35 reservedOnline retail sales to grow at a CAGR of 17%
between 2014 - 2019 to $85 billion in sales
Brazil leads the e-commerce in LATAM.
Latin America is one of the fastest-
Argentina is the fastest growing market
growing regions for e-commerce.
[with a CAGR 2014 – 2019 of 28% ! ]
2015 2019 e
Others Others Brazil
37% Brazil 34% 35%
42%
Argentina Argentina Mexico
9% Mexico 15% 16%
12%
Breakdown of Latin America e-commerce sales, by Country
References are available upon request
© Mapi 2015, All rights
36 reservedNew consumers and new purchasing
habits will impact the life science industry
who are ordering groceries online for home delivery?
Generation Z (ages 15 - 20) 28%
Millennials (ages 21- 34) 30%
Generation X (ages 35 - 49) 22%
Baby Boomers (ages 50 - 64) 17%
Silent Generation (ages 65+) 9%
0% 5% 10% 15% 20% 25% 30%
1. home delivery
2. in-store pickup
3. drive-through pickup
six e-commerce options
4. curbside pickup
5. virtual supermarket
6. automatic subscription
© Mapi 2015, All rights
37 reservedLatin America will continue growing above the
Global Pharmaceutical market
CAGR % **Const. US$
#Global Retail Market in
Global Market 2019: US$ 1.3 Trillion
4.8%
Privileged and Confidential
Asia*/Africa/Australia
8.4%
North America
4.2%
Europe (EU+non-EU)
2.8%
Japan
0.7%
Latin America
6.3%
0.0% 2.0% 4.0% 6.0% 8.0% 10.0% 12.0% 14.0%
2009-2014 2015 2015-2019
** Constant $ uses Q4 14 average exchange rates (Q1 2015 rates for Algeria, Belgium, Brazil, #at ex-manufacturer price levels, not including rebates and discounts. Contains Audited +
Chile, China, Colombia, Egypt, Mexico, Peru, Russia, Saudi Arabia, United Arab Emirates and Unaudited data. All CAGR calculations are 5 years
USA).
* including Indian Sub-continent
References are available upon request
© Mapi 2015, All rights
38 reserved4 Latin American Countries within the top 20
Pharmaceutical Global Markets
Rank 2014 2017 2019
1 United States United States United States
2 China China China
3 Japan Japan Japan
4 Germany Brazil Germany
5 France Germany Brazil
6 Brazil France France
7 Italy Italy UK
8 UK Russia Italy
9 Canada India Canada
10 Spain Canada India
11 India UK Spain
12 Russia Spain Russia
13 South Korea Australia Venezuela
14 Australia Argentina South Korea
15 Venezuela South Korea Mexico
16 Mexico Mexico Australia
17 Turkey Turkey Turkey
18 Poland Indonesia Saudi Arabia
19 Argentina Venezuela Poland
20 Belgium Poland Indonesia
References are available upon request
© Mapi 2015, All rights
39 reservedOverview - Clinical Trials: ClinicalTrials.gov
World =222,811*
Canada 6%
Europe
25%
USA
40%
ASIA PACIFIC
ME 4% 18%
Latin
America Africa
5% 2%
Source: ClinicalTrials.gov | Oct 2015
© Mapi 2015, All rights
41 reservedInclusion of communities and minorities
The selection and inclusion of patients in
clinical studies will continue evolving to
encompass a greater number of what are now
considered minorities
Latin American and Hispanic communities will have
the opportunity to actively participate in more clinical
trials
© Mapi 2015, All rights
42 reserved© Mapi 2015, All rights
43 reserved
Fernando Ferrer© Mapi 2015, All rights 44 reserved
Designating an Orphan Product: Drug and
Biological Products
FDA, Q&A. “What if the sponsor has
difficulty finding data on prevalence? What
if data is not available? What are the best prevalence
estimate resources? What should a sponsor do
if the best resource they can find is 10-20
years old (or from other countries only)?”
“If data is old, the sponsor should explain
why the data is still pertinent and, if from a
foreign source, why data with that
country’s population could also be
representative of US population.”
© Mapi 2015, All rights
45 reservedIs Latin America a foreign source
representative of US population?
USA 10 Latin America
2016 - Population in Million 321 524
White/Mestizo/Hispanic - Million 257 363
WMH in % 80% 69%
Black/African/Mulato/Moreno - Million 41 127
BAMM in % 13% 24%
Indigenous/Other - Million 23 34
IO in % 7% 7%
420 to 560 million people with a Rare Disease in the world
EU 30 – 40 Million 10 Latin American countries:
USA 25 – 30 Million 40 million
10 Latin American population considered: Argentina, Brazil, Chile, Colombia, Cuba, Ecuador, Mexico, Peru, Puerto Rico, Venezuela
References are available upon request
© Mapi 2015, All rights
46 reservedLatin America Provides
Excellent geographical location/time zones
Large, urban patient populations in all therapeutic
indications enables faster enrollment and f/up
Large drug naïve patient populations with common and
special disease profiles
Rapid compliant patient recruitment
Highly involved and experienced investigators
Ready and professional supply of research facilities and
contract research organizations (CROs) offering
professional services for partnering solutions in clinical
trial conduction
Increasing competition for investigators and patients
References are available upon request
© Mapi 2015, All rights
47 reservedPractice and Quality in Latin America
Healthcare systems in LA have improved
substantially throughout the last years
Regulations have become stricter and formal in line
with foreign regulatory and health authorities
USA and EC-equivalent medical standards
More patients per site can be enrolled
Highly experienced monitoring and project
management teams thoroughly trained on GCP and
ICH guidelines
Research has become more proficient with
improved standards of operation
References are available upon request
© Mapi 2015, All rights
48 reservedCommunities will be better represented in clinical
trials
government, industry/services, HCPs and
patients/ patient organizations should be
prepared to respond appropriately
the senior management of life science
organizations should consider this trend in
making their corporate decisions
© Mapi 2015, All rights
49 reserved
Fernando Ferrer 49Road Map towards a successful global regulatory
strategy including Latin America (I)
Perform short and long-term planning with an
appropriate product strategy, analyze the
regulatory requirements for MAA, factor
related investments.
Consider common Regulatory
requirements/country specific
Analyze dossier gaps
References are available upon request
© Mapi 2015, All rights
50 reservedRoad Map towards a successful global regulatory
strategy including Latin America (II)
Verify country specific acceptance of GMP
certificates/CPP/CMP
Take into consideration country specific
stability testing requirements(climatic zones),
local testing and labelling requirements
Analyze local clinical requirements and
extension of clinical trial development activities
into the Latin American territory.
References are available upon request
© Mapi 2015, All rights
51 reservedLength of registration time for innovative drugs
in select countries 2015
400
360 Days to grant registration for
350 innovative drugs in selected
300
countries as of 2015
300 290
270
Mexico is showing a great
250
improvement
Number of days
220
203
200
180
150
150
120 120
100 90
60
50
0
Source: Pharmaceutical Executive, April 2015
© Mapi 2015, All rights
52 reservedAgency review timeframes NCE
Argentina: 4 months
Brazil: 12 months
Mexico: 2 - 4.5 months to approve a new
registration using the Authorized Third Party
scheme.
Colombia: 12 months.
References are available upon request
© Mapi 2015, All rights
53 reservedInclude Latin America in the priority list
Engage early on in the product
development phase with well established,
reputable, international professional teams
with sound expertise and global mindset with
the ability to interact and respond to the high
standards and demands of multinational
companies.
Master project leadership and project
management which are equally relevant to
undertake a LATAM project cross regionally.
References are available upon request
© Mapi 2015, All rights
54 reservedIntegrate internal and external teams
Work with integrated professional teams as
Regulatory, Medical Affairs, Business
Development, Market Access experts and others as
required having the understanding and internal
capabilities to depict the general and specific tasks
required for geographical expansion.
Keep current with regulatory changes,
developments and requirements per individual
country across the region.
Mastering the countries ‘ local language and
understanding local idiosyncrasies is helpful
increasing perspectives of successful market access
References are available upon request
© Mapi 2015, All rights
55 reservedEntry Models Opportunities and Challenges
High demand of Time Savings
Time and Resources High
Gain experience Investment/Cash
Follows the Corp Flow/Credit
model
Green M&A Integration is key
Field JV
Mix
Distribution Shortening time to
Less Investment Hosting market, fast track
& profit
Upfront
Potential lost of
investments
effectiveness
Flexibility,
Communication and
Experience &
alignment
Cultural awareness
References are available upon request
© Mapi 2015, All rights
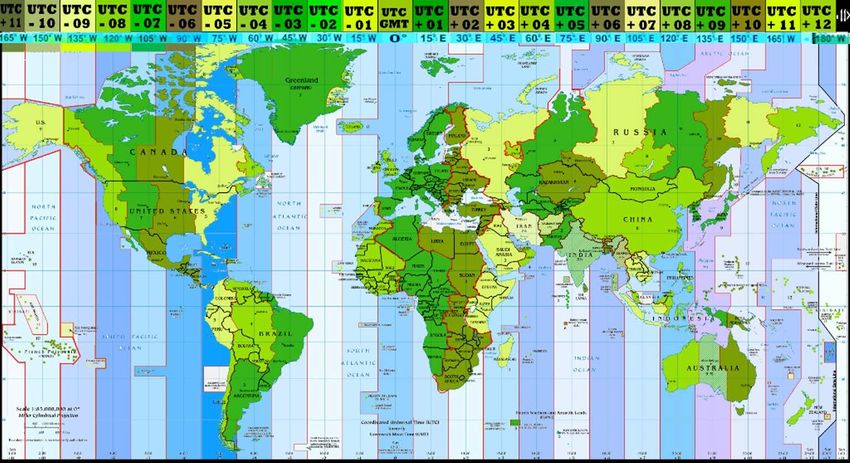
56 reservedCurrent Time Zone in 5 hours range within the
Americas
7
10
8
12 1 3 9 4
3
2 3 12:30
2
4
9
4 6
References are available upon request
© Mapi 2015, All rights
57 reservedLatin America - Snapshot
33 independent Nations: Diversity in race and origin:
Continent ~ 200 years, Transaction currencies: Mestizo, White, Black,
Caribbean ~ 40 years Local and US$. Natives
Democracies Multiple Collaboration Christians 90%, Unaffiliated
Top growing economies: Alliances and Trade 7.7%, Folk 1.7%.
Argentina, Brazil, Chile, Agreements High income inequality,
Colombia, Cuba, Mexico, Complex Tax systems security concerns
Peru, Venezuela Rational and Emotional.
Industrialization
Top ranked countries in
concentrated in the major
using mobiles: Brazil (6), Rich in Natural Resources
economies, and major
Mexico (14), Argentina(23) (Oil, Minerals) and Food
cities/states.
Converging but not The leading region in clean
IP: Brazil’s ANVISA has
harmonized regulations, and efficient energy
‘prior consent’ authority
bureaucracy.
for pharmaceuticals
References are available upon request
© Mapi 2015, All rights
58 reserved© Mapi 2015, All rights 59 reserved
Thank You!

                                                                                 ®

     Additional Questions? Ask our Webinar Hosts directly!
                              Silvia Bendiner - Webinar Host: Phone + 1 321 972 2082
                                                         sbendiner@mapigroup.com

                  Fernando Ferrer, BSC., MBA - Webinar Host: Phone + 1 908 326 6417
                                                    fferrer@multinationalpartnerships.com

                                    ®
                                                                                            © Mapi 2015, All Rights Reserved
Multinational Partnerships® is a Registered Trade
Mark of Multinational Partnerships LLC
You can also read