A Boon for Latin America and the Caribbean? - The Recent Commodity Price Surge
←
→
Page content transcription
If your browser does not render page correctly, please read the page content below

The Recent Commodity Price Surge:
A Boon for Latin America
and the Caribbean?
© 2021, United Nations Conference on Trade and Development

This work is available open access by complying with the Creative Commons licence
created for intergovernmental organizations, available at
http://creativecommons.org/licenses/by/3.0/igo/.

In line with this license, material in this publication may be freely quoted or reprinted, but
acknowledgement is requested, together with a copy of the publication containing the
quotation or reprint to be sent to the UNCTAD secretariat.

The findings, interpretations and conclusions expressed herein are those of the authors and
do not necessarily reflect the views of the United Nations or its officials or Member States.

The designation employed and the presentation of material on any map in this work do not
imply the expression of any opinion whatsoever on the part of the United Nations
concerning the legal status of any country, territory, city or area or of its authorities, or
concerning the delimitation of its frontiers or boundaries.

This document has not been edited.

                               UNCTAD/DITC/COM/INF/2021/6

ii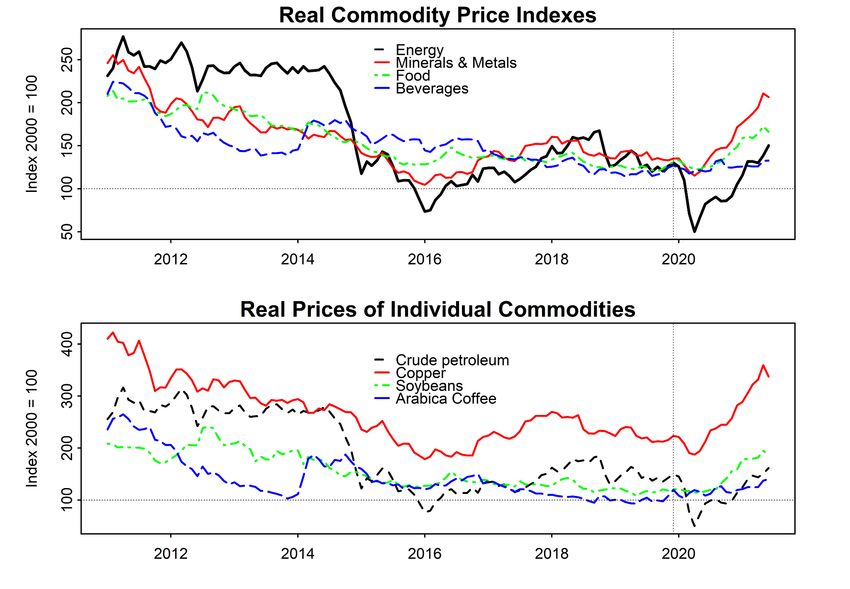
The Recent Commodity Price Surge:
                                                A Boon for Latin America and the Caribbean?

Acknowledgements
This document was prepared by Rodrigo Cárcamo-Díaz and Stefan Csordas, Economic
Affairs Officers at UNCTAD Commodities Branch, Division on International Trade and
Commodities.

The authors would like to thank Marco Fugazza for his valuable comments on earlier versions
of this paper and Danièle Boglio for desktop publishing and administrative assistance.

This document has not been edited. Any remaining errors are the responsibility of the authors.

Contacts
UNCTAD
Division on International Trade and Commodities
Commodities Branch
Geneva, Switzerland
Email: commodities@unctad.org
Tel: +41 22 917 6286
Website: https://unctad.org/topic/commodities

Notes
Use of the term “dollar” ($) refers to United States dollars.
The term “billion” signifies 1 000 million.
The term “tons” refers to metric tons.
Use of a dash between years (e.g. 2000–2001) signifies the full period involved, including
the initial and final years.

Acronyms
AMIS ....... Agricultural Market Information System
IGC .......... International Grains Council
Bpd ......... barrels per day
LAC ......... Latin America and the Caribbean
CDDCs .... Commodity-Dependent Developing Countries
OPEC ...... Organization of Petroleum Exporting Countries
CLP ......... Chilean peso
PEN ......... Peruvian nuevo sol
COP ........ Colombian peso
VIX ........... Chicago Board Options Exchange Market Volatility Index

                                                                                             iii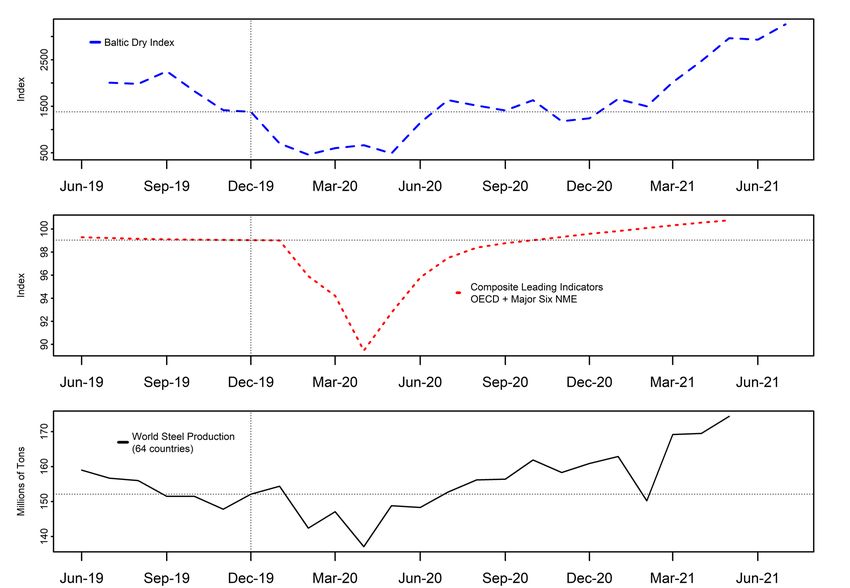
The Recent Commodity Price Surge:
A Boon for Latin America and the Caribbean?

Abstract
This study reviews and analyses the evolution of commodity prices between the start of the
Covid-19 pandemic and mid-2021, a period during which commodity prices have increased,
in some cases very substantially. It presents the key factors driving these price increases and
discusses potential impacts for Commodity-Dependent Developing Countries (CDDCs) in the
Latin America and the Caribbean (LAC) region.

Table of content
I.    Introduction ..................................................................................................................... 1

II.   Export commodity dependence in Latin America and the Caribbean............................. 1

III. Recent commodity price evolution .................................................................................. 3

IV. Factors affecting recent commodity price increases ...................................................... 6

V.    Possible impacts in Latin America and the Caribbean .................................................. 10

VI. Conclusions ................................................................................................................... 15

Bibliography .......................................................................................................................... 17

iv
The Recent Commodity Price Surge:
                                                        A Boon for Latin America and the Caribbean?

    I.     Introduction
In recent months, commodity prices across the board have increased significantly. This is an
important development for the countries in Latin America and the Caribbean (LAC) since
commodity sectors play a vital role for many economies in the region. This is illustrated by
the fact that 14 countries in LAC are classified as commodity dependent (Figure 1).

Figure 1:       Share of primary commodities in total merchandise exports of
                countries in Latin America and the Caribbean (per cent, average
                2015-19)

    100
     90
     80
     70
     60
     50
     40
     30
     20
     10
      0
                   Saint Vincent and the…

                    Trinidad and Tobago

                               Guatemala
                                     Haiti
                                   Mexico
                              El Salvador

                                Argentina

          Bolivia (Plurinational State of)
                    Saint Kitts and Nevis

                                Dominica

                     Dominican Republic
                   Antigua and Barbuda

                              Saint Lucia

                                     Cuba
                                    Brazil

                                    Belize
                                 Colombia

          Venezuela (Bolivarian Rep. of)
                                  Panama

                                Barbados

                                   Guyana

                                  Jamaica

                                Suriname
                                  Grenada

                                  Uruguay

                                 Paraguay

                                     Peru

                                  Ecuador
                                 Bahamas

                               Costa Rica

                                Honduras

                                Nicaragua

                                     Chile

                     Agriculture       Minerals         Energy         commodity dependence threshold

Source: Authors’ calculations using data from UNCTADStat.
Notes: (1) The three categories agriculture, minerals and energy highlight the commodity group with the largest
average share in total merchandise exports. (2) Agriculture = SITC 0, 1, 2 (less 27 and 28) and 4; Minerals= SITC
27, 28, 667, 68 and 971; Fuels = SITC 3.

In this note, we analyze the recent rise in commodity prices, highlight its main drivers, and
discuss potential implications for the LAC region.

    II.    Export commodity dependence in Latin America
           and the Caribbean
An important determinant of a country’s sensitivity to commodity price shocks is the share
of commodities in its exports, 1 which is the basis of the concept of commodity dependence.
A country is export commodity-dependent when commodities account for 60 per cent or

1
  Another consideration is the degree to which countries import commodities, as any net effect of a commodity price
change depends on the net overall commodity import position and the magnitude of the changes of each commodity
imported and exported. For countries that are large importers of food and energy commodities, for example, but only
moderate net exporters of other commodities, the dominant effect of an overall commodity price increase can be the
opposite of that experienced by net commodity exporters. In this note we mainly focus on the effects of the price
increase on export commodity-dependent countries.

                                                                                                                 1
The Recent Commodity Price Surge:
A Boon for Latin America and the Caribbean?
more of its total merchandise export revenue. According to this criterion, all countries in
South America as well as Jamaica and Belize can be classified as commodity-dependent
developing countries (CDDCs). This means that 14 out of 33 countries (42 per cent) in the
LAC region are commodity-dependent. Additionally, 7 countries in the region do not meet
the 60 per cent threshold but have a commodity share of 50-60 per cent so that the
commodity sectors play a major role in their economies. 2
Table 1 shows the average commodity export shares as well as the leading export commodity
groups for the 14 CDDCs in the LAC region. In these countries, the average (median) share
of the leading commodity group in total merchandise exports was 27.0 per cent (24.2 per
cent) in the period 2015-2019.
Table 1: Leading commodity exports in LAC CDDCs (2015-2019)
Country Leading commodity Average annual Average annual
export product group share of leading share of
commodity group in commodities in total
total merchandise merchandise exports
exports (per cent) (per cent)
Argentina Feeding stuff for 17.0 68.5
animals (no unmilled
cereals)
Belize Sugar, molasses and 21.8 68.7
honey
Bolivia (Plurinational Natural gas, whether 33.5 94.0
State of) or not liquefied
Brazil Oil seeds and 11.8 63.9
oleaginous fruits
(excluding flour)
Chile Copper ores and 23.4 86.6
concentrates; copper
mattes; cement
copper
Colombia Petroleum oils, oils 31.3 78.5
from bitumin.
materials, crude
Ecuador Petroleum oils, oils 34.0 93.4
from bitumin.
materials, crude
Guyana Gold, non-monetary 47.1 88.9
(excluding gold ores
and concentrates)
Jamaica Aluminium ores and 48.4 90.0
concentrates (incl.
alumina)
2
These are Cuba, Guatemala, Grenada, Trinidad and Tobago, Nicaragua, Saint Lucia and Honduras.
2The Recent Commodity Price Surge:
A Boon for Latin America and the Caribbean?
Country Leading commodity Average annual Average annual
export product group share of leading share of
commodity group in commodities in total
total merchandise merchandise exports
exports (per cent) (per cent)
Paraguay Oil seeds and 24.9 88.6
oleaginous fruits
(excluding flour)
Peru Copper ores and 24.9 89.7
concentrates; copper
mattes; cement
copper
Suriname Gold, non-monetary 74.7 96.0
(excluding gold ores
and concentrates)
Uruguay Meat of bovine 21.4 79.1
animals, fresh, chilled
or frozen
Venezuela (Bolivarian Petroleum oils, oils 67.0 85.9
Republic of) from bitumin.
materials, crude
Source: Authors’ calculations using data from UNCTADStat.
Note: Leading commodity export product groups are based on average export values at SITC 3-digit level within
primary commodities defined as SITC 0, 1, 2, 3, 4, 68, 667 and 971 in the period 2015-2019.
III. Recent commodity price evolution
The upper panel of Figure 2 presents the monthly evolution of four major commodity price
indexes between 2011 and 2021 while the lower panel shows real prices of key commodities
included in each of the indexes. All series are deflated by the monthly United States
Consumer Price Index. Figure 2 also includes a horizontal line marking the level of each index
in the year 2000, when prices across all commodity categories were low, and a vertical line
marking the “start” of the Covid-19 pandemic in December 2019.
Figure 2 is very informative about the impact of the pandemic on the different commodity
prices, and three points are worth highlighting. First, we can observe that Energy was the
only commodity group that suffered a severe decline in early 2020 following the onset of the
Covid-19 pandemic, with a price decline of 61.5 per cent in real terms in the four months
January - April 2020. Minerals and Metals experienced a much smaller decline (14.7 per cent)
during the same period and prices of the Food and Beverage groups were little affected.
Indeed, prices of commodities like soybeans and arabica coffee, as shown in the lower panel
of Figure 2, were not affected except for an increase in short-term volatility. These
developments reflect the impact of the restrictions to movement that were imposed around
the world in 2020 to slow the spread of Covid-19, which affected in particular energy prices;
and the increase in uncertainty that brought about a slowdown in investment, which affected
the prices of minerals and metals.
3The Recent Commodity Price Surge: A Boon for Latin America and the Caribbean? Figure 2: Real prices of selected individual commodities and group indexes Source: Authors’ calculations using World Bank and United States Bureau of Labor Statistics data. Second, what is extraordinary about the drop in energy prices was not only its size but also its speed: the 61.5 per cent real price decline in four months was identical in terms of percentage and speed (but smaller in terms of price declines, due to base differences) to the hitherto largest and fastest fall in energy prices, which occurred between August and December 2008 as a result of the global financial crisis. Third, recent price increases for the Mining and Metals, Food and Energy groups resulted in real price levels in June 2021 previously not seen since September 2011, June 2014 and October 2018, respectively. For the Minerals and Metals commodity group prices in June 2021 were 22.5 per cent below the peak levels attained in March 2008 before the global financial crisis. Similarly, for the Food commodity group, prices in June 2021 were 25 per cent below the peak prices reached in June 2008. However, Energy prices are at present far below the levels registered pre-financial crisis, in part due expanding supply of gas and petroleum during the last decade, including due to fracking. Table 2 focuses on the evolution of the real prices of each commodity group during the Covid- 19 pandemic, showing for each commodity group: i) the month when the lowest index value was registered after the start of the Covid-19 emergency in December 2019; ii) the index growth in percentage points registered between that minimum and the last price observation available (June 2021), and iii) the index growth in percentage points registered between the start of the Covid-19 emergency in December 2019 and the last observation available (June 2021). 4
The Recent Commodity Price Surge:
                                                      A Boon for Latin America and the Caribbean?

Table 2 shows that while prices of all commodity groups increased with respect to the
beginning of the Covid-19 emergency, there was significant heterogeneity in terms of the
magnitude of price increases across different commodity groups. On the one hand, prices of
Minerals and Metals increased by 53.3 per cent since the start of the Covid-19 pandemic and
prices of Food increased 27 per cent. On the other hand, prices of Beverages and Raw
Materials only increased 4.7 per cent and 4.5 per cent, respectively. Energy prices have
increased by 15.6 per cent since the start of the pandemic and doubled with respect to the
minimum levels registered in April 2020. Prices of commodities in the Precious Metals group
increased continuously during the pandemic, buoyed by investor demand as a safe asset in
the face of expansive monetary policies around the world and the increase in uncertainty due
to the Covid-19 pandemic.

Table 2:        Real price evolution of aggregate commodity price indexes during the
                pandemic (December 2019 – June 2021)
                 Group                           Minimum              Max Growth              Covid-19
                                                                                              Growth
    Minerals & Metals                           01/04/2020                 79.2                     52.9
    Food                                        01/05/2020                 35.4                     26.6
    Precious Metals                             01/12/2019                 22.7                     22.7
    Energy                                      01/04/2020                 199.8                    15.3
    Beverages                                   01/03/2020                 12.7                     4.4
    Raw Materials                               01/04/2020                 10.5                     4.2
Source: Authors’ calculations using World Bank data and United States Bureau of Labor Statistics.

Table 3 complements the information provided by Table 2, showing the same growth rates
and the month with the lowest level of each real price series during the Covid-19 pandemic
for individual commodities exported by countries in the LAC region. Within the Minerals and
Metals group 3 key commodities like copper, iron ore and aluminium experienced significant
price increases, with iron ore showing the largest price increases. Among food commodities
there were large price increases for maize, soybeans and products of the latter (soybean oil
and soybean meal), which drove the price increase of the Food commodities group. 4 Finally,
in the Beverages group, coffee experienced moderate price increases (from a relatively low
base) caused by supply issues during the period and increasing demand, while for cocoa the
combination of supply side developments like bumper crops in West Africa with reduced
grindings in key markets during the Covid-19 pandemic, resulted in prices in June 2021 that
were 7.8 per cent below in real terms than prices at the start of the Covid -19 pandemic in
December 2019.

3
  Combined, these three commodities account for 84 per cent of the Minerals and Metals group.
4
  Combined, maize, soybeans, soybean oil and soybean meal account for 37.5 per cent of the Food commodity
group.

                                                                                                           5
The Recent Commodity Price Surge:
A Boon for Latin America and the Caribbean?
Table 3: Real price evolution of selected commodities (December 2019 – June
2021)
Product Minimum Max Growth Covid-19
Growth
Iron Ore 01/04/2020 139.3 120.5
Coal 01/08/2020 148.2 87.1
Tin 01/04/2020 105.5 80.7
Maize 01/05/2020 91.6 66.6
Soybean Oil 01/04/2020 97.5 62.4
Soybeans 01/05/2020 64.8 55.8
Copper 01/04/2020 80.0 51.0
Silver 01/03/2020 72.7 50.1
Aluminium 01/04/2020 58.4 31.6
Soybean Meal 01/05/2020 30.9 27.0
Nickel 01/03/2020 44.5 23.9
Zinc 01/03/2020 47.6 23.8
Cotton 01/04/2020 40.5 18.6
Gold 01/12/2019 18.2 18.2
Arabica Coffee 01/02/2020 35.5 16.9
Wheat 01/06/2020 30.3 10.3
Petroleum (Average) 01/04/2020 222.6 8.0
Fish Meal 01/02/2020 5.4 5.3
Banana 01/11/2020 4.5 2.8
Plywood 01/06/2021 0.0 -5.6
Cocoa 01/07/2020 7.5 -7.8
Shrimp 01/10/2020 13.4 -8.5
Source: Authors’ calculations using World Bank data.
IV. Factors affecting recent commodity price
increases
While the evolution of each commodity price is affected by numerous factors, a number of
broad-based factors can be highlighted that played a role in the recent increase in commodity
prices.
Clearly, the acceleration of world economic activity has boosted the demand for energy and
metal commodities. Figure 3 shows the recent evolution of three indicators of world
economic activity, the Baltic Dry Index, 5 the Amplitude-adjusted Composite Leading
5
As the main (but not the only) driver of the evolution of the Baltic Dry Index has been attributed to shipping demand
shocks (Jacks and Stuermer, 2021), this index and other indicators of dry cargo shipping costs have been used in the
6The Recent Commodity Price Surge:
A Boon for Latin America and the Caribbean?
Indicators 6 for OECD countries and six major emerging market economies, and World steel
production (with data for 64 countries from the World Steel Association). 7
Figure 3 shows the decline of world economic activity across all three indicators at the
beginning of the Covid-19 pandemic in December 2019 or shortly thereafter. The spread of
the pandemic was accompanied by severe restrictions of contacts and movements around
the globe leading to a decline of economic activity. The figure also shows the beginning of a
recovery in world economic activity starting in the second quarter of 2020 and accelerating
in the first quarter of 2021 as vaccination campaigns took off around the world. The growth
in world economic activity has been backstopped by expansive monetary and fiscal policies
across the board and the progressive lifting of restrictions of movement and activities. For
steel production, the recovery of the Chinese economy played a key role as the country
accounted for 56.7 per cent of the global production of crude steel and 56.2 per cent of the
global consumption of steel products in 2020. 8
In parallel to the increase in world economic activity, there has been an improvement of
investor expectations as indicated by the reduction in the volatility in international financial
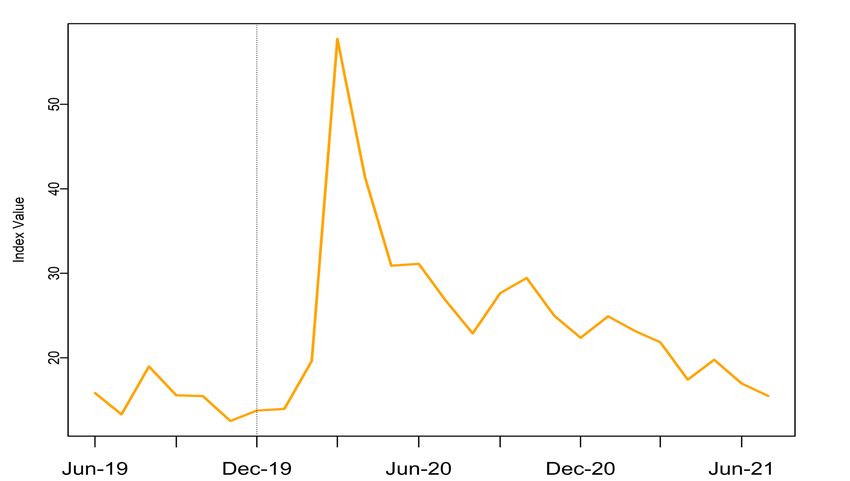
markets. This is highlighted by the evolution of the VIX index depicted in Figure 4. 9 Reduced
volatility and improved investor expectations have also led to increased attractiveness of
commodities as an asset class, pushing up the number of transactions and prices in some
commodity futures markets. The movements of the VIX index presented in Figure 4 shows
the progressive but slow improvement of investor expectations from June 2020 onwards,
after the widespread market uncertainty experienced during the first quarter of 2020 due to
the spread of the Covid-19 pandemic. More recently, policy announcements such as the
United States and European Union Covid-19 stimulus packages worth US$ 1.9 trillion and
EUR 750 billion, respectively, may have also supported a favourable outlook by investors and
consumers on near-term recovery and growth.
past in the literature (e.g. Killian, 2009) as an indicator of world real economic activity. The index is composed of three
sub-indices that measure different sizes of dry bulk carriers: Capesize, which can transport cargoes of about 150,000
tons, Panamax, moving cargoes of around 60-70,000 tons, and Supramax, with capacities between 48,000 and
60,000 tons. The index is constructed using data from commodity transport along 23 different shipping routes.
6
The Composite leading indicators of the OECD are used to identify early signals of turning points in business cycles
showing fluctuation of the economic activity around its long term potential level.
7
World production of steel has also been proposed as an indicator for the strength of world real economic activity
(Ravazzolo, F. and Vespignani, J.,2020).
8
Source: World Steel Association “World Steel in Figures 2021”.
9
The VIX Index provides a measure of constant, 30-day expected volatility of the United States stock market,
derived from real-time, mid-quote prices of Standard & Poor’s 500 Index (SPX) call and put options. See
https://www.cboe.com/tradable_products/vix/
7The Recent Commodity Price Surge: A Boon for Latin America and the Caribbean? Figure 3: Three indicators of world real economic activity Source: Authors’ calculations using data from Thomson Reuters, OECD and World Steel Association. Figure 4: Chicago board options exchange market volatility index (VIX) Source: Author’s calculations using Thomson Reuters data. Monthly averages of daily closing values. 8
The Recent Commodity Price Surge:
                                                           A Boon for Latin America and the Caribbean?

In light of recovering world economic activity, positive expectations, and expansive
macroeconomic policies, including fiscal stimulus, packages relaxed monetary policy and a
number of supply-side factors, it is no surprise that commodities linked to construction and
infrastructure, like iron ore, coal and copper, have been among the most dynamic
commodities in terms of price increases, as shown by Table 3. Indeed, the magnitude of
recent commodity price increases of the Minerals and Metals, and Energy groups of
commodities have led to a number of countervailing supply responses. For example, during
the 19th Organization of Petroleum Exporting Countries (OPEC) and Non-OPEC Ministerial
meeting on 18 July 2021, petroleum producing countries agreed to increase production by
0.4 million barrels per day (bpd) each month from August to December 2021. These supply
increases are expected to continue until the 5.8 million bpd production adjustment that was
implemented by OPEC+ is phased out. Also, it was decided to change the baseline for the
calculations of the production adjustments from May 2022. 10

Also, longer term trends such as the rapid growth of the market for low-carbon energy
technologies and electric vehicles are starting to impact minerals demand. For instance,
battery production is already the largest end use for cobalt and lithium and is absorbing
increasing shares of the market for class-I nickel. The global electric car stock has increased
by 43 per cent in 2020 and is expected to increase more than tenfold through 2030 (IEA,
2021a). Furthermore, the share of renewables in the global energy mix has increased from 27
per cent in 2019 to 29 per cent in 2020 (IEA, 2021b). As a consequence of these trends, the
IEA projects in its baseline scenario that the production of clean technologies will absorb
twice as much copper in 2040 than in 2020 and increase its demand for cobalt, nickel, and
lithium by factors of 6, 7 and 13, respectively (IEA, 2021c). The recent increases in food prices
are due to a number of factors affecting market fundamentals, as well as production costs
around the world. First, rising energy prices - as shown in Tables 1 and 2 and Figure 2 -
contribute to higher agricultural production costs both directly, through fuel price increases,
and indirectly, through the rise in fertilizer prices. 11 In the same vein, higher energy prices
have driven up transportation costs, which have added to the upwards pressure on food
commodity prices. Second, supply uncertainties have contributed to increasing prices of
certain agricultural commodities. For example, drought conditions have led to downward
revisions of the maize production forecast for the 2020/21 growing season in Brazil, one of
the world’s largest maize exporters. 12 Third, rising global demand has caused the supply-
demand balance to tighten for a number of food commodities. For instance, global utilization
of soybeans and maize is expected to outweigh global production in the 2020/21 marketing
season, leading to a reduction of global stocks (AMIS, 2021; IGC, 2021).

It is interesting to note that the increase in commodity prices took place despite the
appreciation of the United States dollar against other currencies like the Euro or Renminbi,

10
    This involves increasing the baselines for Saudi Arabia, the Russian Federation, Kuwait, Iraq and the United Arab
Emirates. See https://www.opec.org/opec_web/en/press_room/6512.htm
11
   The index of fertilizer prices of the World Bank, composed of nitrogenous fertilizer (manufactured using natural gas),
phosphates, and potassium fertilizers, rose in real terms 57.1 per cent between the start of the Covid-19 pandemic in
December 2019 and June 2021, including a rapid rise of 70.2 per cent between June 2020 and June 2021.
12
    According to the Country Brief for Brazil of January 19th, 2021, the Global Information and Early Warning
System of the Food and Agriculture Organization of the United Nations, for maize ”Yields are expected to be at
below‑average levels as reduced precipitation amounts from March to May and a cold spell in June adversely
affected crops”. See http://www.fao.org/giews/countrybrief/country.jsp?code=BRA

                                                                                                                       9
The Recent Commodity Price Surge:
A Boon for Latin America and the Caribbean?
starting in the second quarter of 2020. However, further appreciation of the United States
dollar, for example as a result of tightening of interest rates to contain inflationary pressures,
may dampen further commodity price increases. Overall, given the persisting uncertainty
regarding the evolution of the pandemic at the time of writing (July 2021), in particular
regarding the impact of the new virus variants, it can be expected that commodity prices will
remain volatile in the near future.
V. Possible impacts in Latin America and the
Caribbean
Most if not all countries in the LAC region rely on the production and export of commodities
as a source of economic growth through different channels. One channel operates through
investment in commodity sectors. In particular mining and energy are very capital intensive
sectors where foreign direct investment plays a key role. Another channel operates via capital
inflows, which are often positively correlated with the commodity price cycle. Also public and
private income and expenditure tend to follow commodity cycles. As a result, the evolution
of GDP growth in LAC is correlated with the observed evolution of commodity prices (e.g.
Alberola et al., 2016). For example, the (Pearson) correlation coefficient between changes in
the UNCTAD commodity prices index and the weighted average 13 GDP growth of CDDCs in
LAC in the period 2000-2020 indicates a linear correlation of 70 per cent between both
variables and is statistically significant with a 99 per cent confidence interval. Figure 5
provides an illustration of the link between GDP growth rates and commodity price changes
showing the growth rate of six large Latin American CDDCs and the growth rate of UNCTAD’s
commodity price index. It can be seen that GDP growth rates were high in CDDCs in LAC
during the commodity price boom between 2003 and 2011 (only briefly interrupted by the
global financial crisis). However, after the end of the boom period in 2011, GDP growth rates
in most CDDCs in LAC decelerated in line with falling commodity prices. The recent increase
in commodity prices can be expected to strengthen the post-pandemic recovery of CDDCs
in the LAC region as shown by growth projections for 2021 included in Figure 5. A key risk
factor to this positive outlook is the emergence of new variants of SARS-CoV-2 and their
potential to disrupt economic activity in the LAC region and across the globe, either directly
or via an increase in uncertainty.
13
GDP growth corresponds to the average annual growth rates of GDP of the 14 CDDCs in LAC, weighted by time-
varying shares of GDP at PPP. The UNCTAD commodity price index value for 2021 corresponds to the average of the
monthly year-on-year percentage changes for the months January-April 2021.
10The Recent Commodity Price Surge:
A Boon for Latin America and the Caribbean?
Figure 5: GDP growth rates of selected Latin American CDDCs and changes in
commodity prices
15 50
40
10
30
20
5
10
0 0
2000 2001 2002 2003 2004 2005 2006 2007 2008 2009 2010 2011 2012 2013 2014 2015 2016 2017 2018 2019 2020 2021
-10
-5
-20
-30
-10
-40
-15 -50
Brazil Chile
Colombia Ecuador
Peru Argentina
UNCTAD commodity price index, right axis
Source: Authors’ calculations using data from IMF, World Economic Outlook Database and UNCTADStat
database.
Note: (1) Data for 2020 onwards for Argentina and Ecuador are IMF estimates. (2) The UNCTAD commodity price
index value for 2021 corresponds to the average of the monthly year-on-year percentage changes for the months
January-April 2021.
Commodity price movements impact the fiscal balance not only through their effects on the
economic cycle but also through their link with fiscal revenue both directly (when exports are
taxed or public firms engage in commodity export) and indirectly (e.g. via income taxes on
exporting firms). Several studies have found evidence of procyclicality of fiscal policy at
different periods in different countries in the LAC region. 14 As shown by Figure 6, several
CDDCs in the LAC region experienced falling debt-to-GDP rations during the last commodity
price boom and rising debt-to-GDP ratios thereafter. As Figure 6 shows, there exist large
differences in debt-to-GDP ratio levels between different countries of the region. The recent
commodity price increases can be expected to have a positive impact on GDP growth and
public revenue in CDDCs in the LAC region, which could contribute to manage public
expenditure needs in the wake of the Covid-19 pandemic. 15
14
For example, see Klemm (2014) and the references therein. There is also evidence that the evolution of fiscal
balances during past commodity booms and busts has been heterogeneous across time and countries. See Cespedes
and Velasco (2011) and International Monetary Fund (2015).
15
However, at the time of writing there is still significant uncertainty surrounding the time of exit from the pandemic
and the evolution of fiscal expenditure associated with the latter, both factors that can affect fiscal balances across
the region.
11The Recent Commodity Price Surge:
A Boon for Latin America and the Caribbean?
Figure 6: Debt-to-GDP ratios for selected CDDCs
160
140
120
100
80
60
40
20
0
2000 2001 2002 2003 2004 2005 2006 2007 2008 2009 2010 2011 2012 2013 2014 2015 2016 2017 2018 2019 2020
Argentina Brazil Chile Colombia Peru Ecuador
Source: Authors’ calculations: IMF, World Economic Outlook Database
Note: Data for 2020 for Argentina, Colombia, Ecuador and Peru are estimations.
Another key impact of the recent commodity price increases on CDDCs in the LAC region
will be through the trade balance. For many commodity exporters in LAC, price increases
have led to significant increases in commodity export revenues in the first half of 2021,
relative to the same period of 2020 and in spite of stagnant or (in some cases) even falling
export volumes. For instance, Figure 7 shows that Brazil’s Free On Board export revenue
from oilseeds in the first 6 months of 2021 was 24.3 per cent higher than in the same period
of 2020 although exported volumes were slightly lower in the first half of 2021 with respect
to the same period in 2020. Similarly, Chile’s export revenue from copper ores and
concentrates was 48.8 per cent higher in the first half of 2021 than in the first half of 2020,
while exported volumes had only increased by 4.4 per cent. Further, Colombia’s export
revenue from petroleum and derivatives increased by 29.9 per cent in the period January-
May 2021 with respect to the same period of 2020, while exported volumes were 20.6 per
cent lower in 2021. On the other hand, commodity price increases have a negative effect on
the trade balances of net commodity importers in the LAC region, such as those importing
energy and food commodities. For example, Costa Rica’s Cost Insurance and Freight cereal
import bill during the first five months of 2021 was 34.8 per cent higher than during the same
period of 2020, while import volumes only increased by 5 per cent, as shown by Figure 8.
Other countries in the LAC region such as El Salvador and Honduras also saw their import
bills for basic food commodities increase disproportionately with respect to imported
volumes in the first half of 2021.
12The Recent Commodity Price Surge:
A Boon for Latin America and the Caribbean?
Figure 7: Export revenues and volumes of leading commodity group for
selected CDDCs in Latin America (2019-2021)
30 70
Millions
Billions
25 60
50
20
40
15
30
10
20
5 10
0 0
2019 2020 2021 2019 2020 2021 2019 2020 2021
Brazil Chile Colombia
(Oil-seeds and oleaginous (Copper ores and (Petroleum and derivatives)
fruits) concentrates)
Value ($, FOB) Volume (mt), right axis
Source: Authors’ calculations using data from the COMEX Stat database of the Ministry of Industry, Foreign Trade
and Services (Brazil), Dirección Nacional de Aduanas (Chile) and Departamento Administrativo Nacional de
Estadística (Colombia).
Note: Data for Brazil and Chile (Colombia) reflects cumulative export revenue from the months January-June
(January-May) of the respective years.
Figure 8: Import costs and volumes of basic food commodities for selected
countries in Latin America (2019-2021)
300 800
Millions
Thousands
700
250
600
200
500
150 400
300
100
200
50
100
0 0
2019 2020 2021 2019 2020 2021 2019 2020 2021
Costa Rica El Salvador Honduras
(Cereals) (Cereals and cereal preparations) (Vegetable products)
Value ($, CIF) Volume (mt), right axis
Source: Authors’ calculations using data from Portal Estadístico de Comercio Exterior of PROCOMER (Costa
Rica), Banco Central de Reserva de El Salvador and Banco Central de Honduras.
Notes: (1) Data for Costa Rica and Honduras (El Salvador) reflects cumulative export revenue from the months
January-May (January-June) of the respective years. (2) “Cereals” refers to HS chapter 10; “Cereals and cereal
preparation” refers SITC division 04; “Vegetable products” refers to HS section II (cereals accounted for an
average of 57.5 per cent of the import value under this section for Honduras in the period 2015-19 based on
Comtrade data).
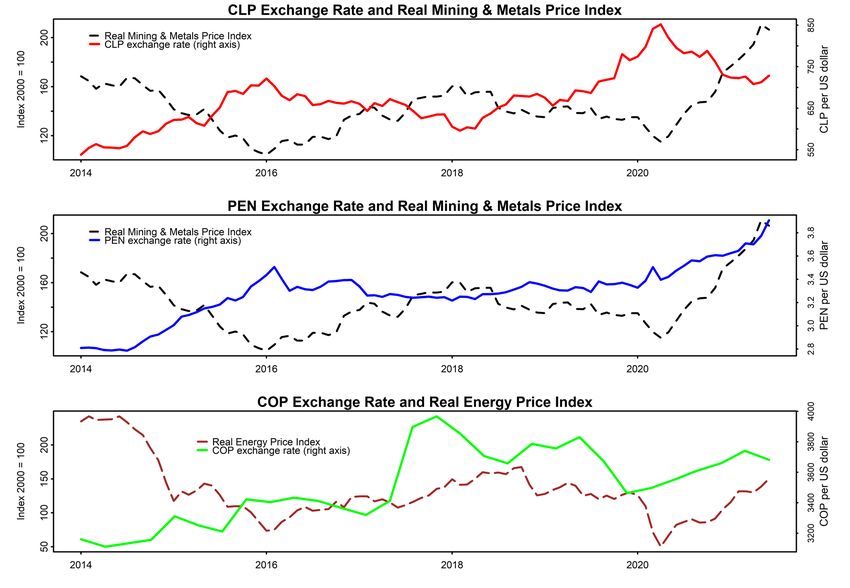
Finally, commodity price movements also result in changes in the nominal and real effective
exchange rates of CDDCs in the region, in particular for those countries that are most closely
13The Recent Commodity Price Surge: A Boon for Latin America and the Caribbean? integrated with international capital markets and which follow more flexible exchange rate regimes. In the past, there has been a close correlation between the evolution of nominal exchange rates of the domestic currencies of those countries vis a vis the United States dollar and the evolution of commodity prices of key export commodities in each country. For example, the (Pearson) correlation between the nominal monthly exchange rates of Chile, Peru and Colombia and the monthly real price index of Minerals and Metals (for Chile and Peru) and of Energy (for Colombia) for the period January 2000 - June 2021 was 63.7 per cent, 64.4 per cent and 68.9 per cent, respectively, and in all three cases significant with a 99 per cent confidence interval. 16 This indicates that a commodity price increase (decrease) of the relevant commodities for each country is closely associated with an appreciation (depreciation) of the nominal exchange rate. The latter relationship is illustrated by Figure 9, which presents in the top and central panel, respectively, the movements of the nominal monthly exchange rates of the Chilean peso and the Peruvian Nuevo Sol against the United States dollar together with the evolution of the real monthly mining and metal price index of the World Bank. The bottom panel shows the evolution of the nominal monthly exchange rate of the Colombian peso against the United States dollar, and the evolution of the real Energy price index of the World Bank. Figure 9: Select Nominal Exchange Rates and Real Commodity Price Indexes Source: Authors’ calculations using Bloomberg and World Bank data. 16 Interestingly, the correlation between nominal monthly exchange rates and relevant commodity prices seems to weaken for certain countries in 2020-2021, like Peru. 14
The Recent Commodity Price Surge:
                                                         A Boon for Latin America and the Caribbean?

 VI.       Conclusions
In this note, we have reviewed the recent increase of commodity prices, presented some key
factors driving these price increases and discussed potential impacts for Commodity-
Dependent Developing Countries (CDDCs) in the Latin America and the Caribbean (LAC)
region.

Commodity prices as a group have increased from the start of the Covid-19 pandemic in
December 2019, and especially with respect to the floors attained by several individual
commodities in the first half of 2020. However, there has been a wide heterogeneity across
groups and especially individual products.

While many different supply and demand factors are behind the recent commodity price
increases, it is worth highlighting the roles of two key drivers. First, the recovery in world
economic activity as countries advanced in their vaccination efforts and subsequently
removed a number of movement restrictions. Second, the improvement in investor and
consumer expectations also contributed to commodity price increases, in particular for
energy and mineral and metal commodities. For the latter group of commodities in particular,
factors associated with the global energy transition might also be contributing to the evolution
of prices over the longer term. For certain agricultural commodities like cocoa or maize,
supply-side developments have had an effect on the recent evolution of prices. An interesting
point is that the recent commodity price increase has taken place despite the appreciation
of the United States dollar vis-à-vis other currencies like the Euro or the Renminbi since April
2020, something that tends to dampen commodity demand by making commodities more
expensive in other currencies.

The different degrees of commodity dependence across the LAC region indicate that the
impacts of commodity price increases on trade and GDP growth in the CDDCs of the LAC
region will also be heterogeneous. This is compounded by differences in terms of public
indebtedness, domestic policy environments and other socio-political-economic factors
impacting on macroeconomic variables. Also, for countries in the LAC region that import
substantial amounts of basic commodities such as food and fuels, persistently high
commodity price levels could cause additional issues such as cost pressures on prices and
a rise in poverty and food insecurity.

Volatility is likely to remain a challenge for CDDCs in the LAC region. As illustrated in section
V, commodity price swings are accompanied by movements of key macroeconomic
indicators such as GDP growth, trade balances, debt positions and exchange rates. Also,
LAC countries that import key commodities such as food and energy are prone to shocks
and volatility transmitted via global commodity markets. Unquestionably, the near-term
priority for LAC countries is to rebuild their economies after the shock of the Covid-19
pandemic. In this context, high commodity prices, if they are persistent, 17 may provide a
welcome boost for commodity exporters in the region. However, the recent commodity price
hikes and the high level of uncertainty regarding future commodity market developments are

17
   At the time of writing (July 2021), while some fundamentals like world economic activity increases are expected to
continue to support commodity demand, countervailing developments in supply and demand of different commodities,
as well as potential further appreciation of the US dollar may dampen commodity prices and increase volatility.

                                                                                                                  15
The Recent Commodity Price Surge:
A Boon for Latin America and the Caribbean?
a reminder that, over the medium and longer term, it is also important to strengthen domestic
institutions and policy frameworks (including fiscal, monetary, macro-prudential and social
policies and their associated institutions) with a view to increasing the resilience of LAC
economies to the impacts of future exogenous shocks, such as commodity price fluctuations,
capital flow volatility and others. 18
18
For further reading see e.g. Arezki et al. (2012).
16The Recent Commodity Price Surge:
A Boon for Latin America and the Caribbean?
Bibliography
Alberola, E., Gondo, R., Lombardi, M.J., Urbina, D. (2016), “Output gaps and policy
stabilisation in Latin America: the effect of commodity and capital flow cycles”, Bank
of International Settlements Working Papers, No 568 , June 2016.
AMIS (2021), “Market Monitor No. 90, July 2021”, Rome: Agricultural Market Information
System (AMIS).
Arezki, R., Pattillo, C., Quintyn, M. and Zhu, M., Eds. (2012).” Commodity Price Volatility and
Inclusive Growth in Low-Income Countries”,. Washington, D.C.: International Monetary
Fund.
Céspedes, L.P. and Velasco, A. (2014), “Was this time different?: Fiscal policy in commodity
republics”, Journal of Development Economics, Vol. 106, pp. 92 - 106.
IEA (2021a), “Global EV Outlook 2021”, Paris: International Energy Agency.
IEA (2021b), “Global Energy Outlook 2021”, Paris: International Energy Agency.
IEA (2021c), “The Role of Critical Minerals in Clean Energy Transitions”, Paris: International
Energy Agency.
IGC (2021), “Grain Market Report No. 522, 24 June 2021”, London: International Grains
Council.
International Monetary Fund (2015), “Fiscal Policy in Latin America: Lessons and Legacies of
the Global Financial Crisis”, IMF Staff Discussion Note SDN/15/06, April 2015.
Jacks, D.S. and Stuermer, M. (2021), “Dry Bulk Shipping and the Evolution of Maritime
Transport Costs, 1850-2020”, National Bureau of Economic Research Working paper
No. W28627, March 2021.
Klemm, A. (2014), “Fiscal Policy in Latin America over the Cycle”, International Monetary Fund
Working Paper WP/14/59, April 2014.
Killian, L. (2009), “Not All Oil Price Shocks Are Alike: Disentangling Demand and Supply
Shocks in the Crude Oil Market”, The American Economic Review, Vol. 99(3), pp. 1053-
1069.
Ravazzolo, F. and Vespignani, J. (2020), “World steel production: A new monthly indicator of
global real economic activity”, Canadian Journal of Economics/Revue canadienne
d'économique, Vol. 53(2), pp. 743-766.
17You can also read