Phillip Securities Research Morning Call - StocksBNB
←
→
Page content transcription
If your browser does not render page correctly, please read the page content below
Phillip Securities Research Morning Call
20th July 2020
Stock Counter Updates Macro/Sector Outlook
SATS LTD REITS Monthly
Hyphen Pharma SG Weekly
ESR-Sabana REIT US Office REITS
Prime US REIT
Manulife US REIT
Phillip Securities Pte Ltd (A member of PhillipCapital) Co. Reg. No. 197501035Z © PhillipCapital 2020. All Rights Reserved. For internal circulation only.
Disclaimer: The information contained in this document is intended only for use during the presentation and should not be disseminated or distributed to parties outside the presentation.
Phillip Securities accepts no liability whatsoever with respect to the use of this document or its contents.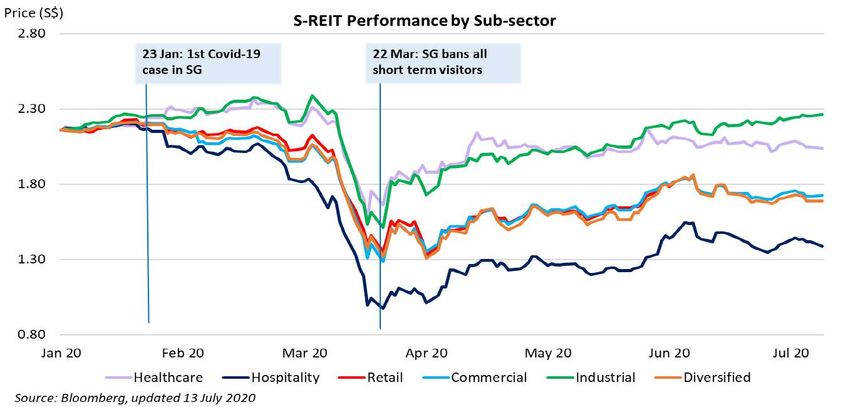
Hyphens Pharma International Ltd
                                                        Building channels to establish business longevity

                                                                                                                    Tay Wee Kuang
                                                                                                                  Research Analyst
                                                                                                   Phillip Securities Research Pte Ltd
                                                                                                                      20th July 2020

Phillip Securities Pte Ltd (A member of PhillipCapital) Co. Reg. No. 197501035Z © PhillipCapital 2020. All Rights Reserved. For internal circulation only.
Disclaimer: The information contained in this document is intended only for use during the presentation and should not be disseminated or distributed to parties outside the presentation.
Phillip Securities accepts no liability whatsoever with respect to the use of this document or its contents.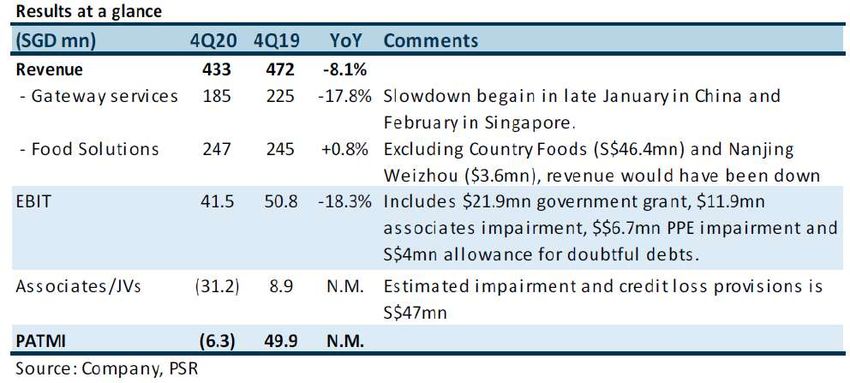
Hyphens Pharma International Ltd
ACCUMULATE (Initiation), TP: S$0.435, Last: S$0.420
Company Background
Listed on SGX-Catalist in May 2018
Principal business: sales, marketing and distribution of pharmaceutical and healthcare-related products
Business segments:
Specialty Pharma
Proprietary Brands
Medical Hypermart and Digital
Geographical footprint:
Singapore
Vietnam
Malaysia
Indonesia
Philippines
Phillip Securities Pte Ltd (A member of PhillipCapital) Co. Reg. No. 197501035Z © PhillipCapital 2020. All Rights Reserved. For internal circulation only.
Disclaimer: The information contained in this document is intended only for use during the presentation and should not be disseminated or distributed to parties outside the presentation.
Phillip Securities accepts no liability whatsoever with respect to the use of this document or its contents.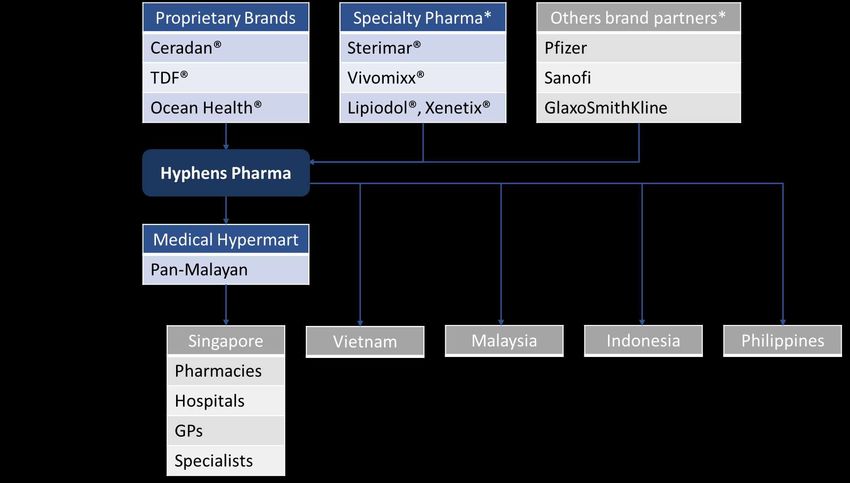
Hyphens Pharma International Ltd
    ACCUMULATE (Initiation), TP: S$0.435, Last: S$0.420

    Industry value chain for pharmaceutical/medical goods

Phillip Securities Pte Ltd (A member of PhillipCapital) Co. Reg. No. 197501035Z © PhillipCapital 2020. All Rights Reserved. For internal circulation only.
Disclaimer: The information contained in this document is intended only for use during the presentation and should not be disseminated or distributed to parties outside the presentation.
Phillip Securities accepts no liability whatsoever with respect to the use of this document or its contents.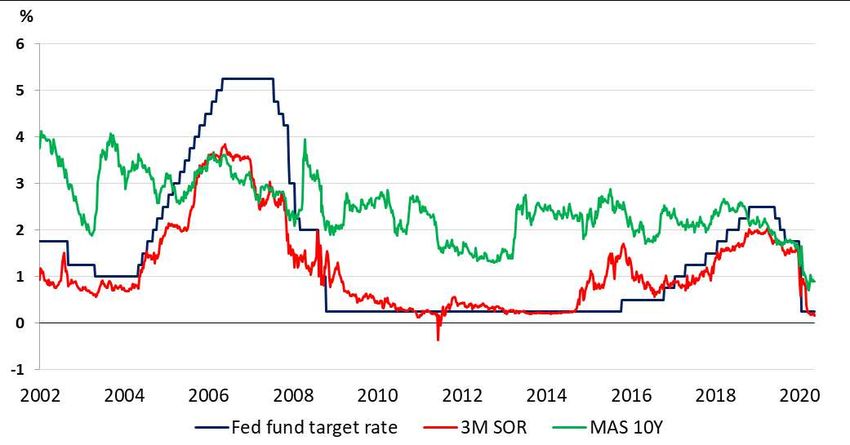
Hyphens Pharma International Ltd
    ACCUMULATE (Initiation), TP: S$0.435, Last: S$0.420

    Hyphens Pharma presence in the value chain

                        Higher value

                                                                                                                                                       Other intermediaries

                        Lower value

Phillip Securities Pte Ltd (A member of PhillipCapital) Co. Reg. No. 197501035Z © PhillipCapital 2020. All Rights Reserved. For internal circulation only.
Disclaimer: The information contained in this document is intended only for use during the presentation and should not be disseminated or distributed to parties outside the presentation.
Phillip Securities accepts no liability whatsoever with respect to the use of this document or its contents.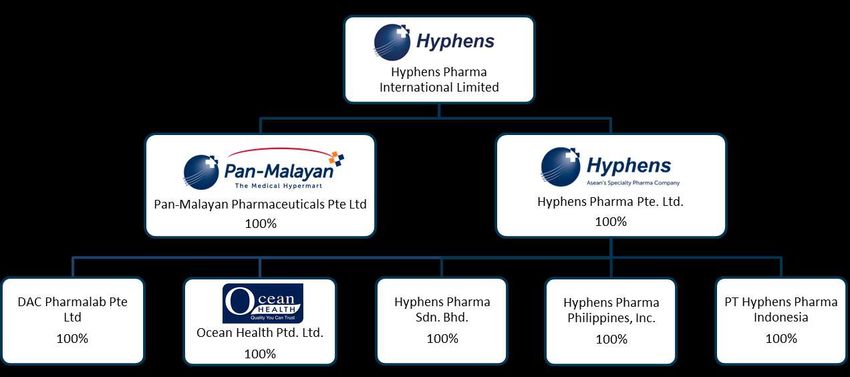
Hyphens Pharma International Ltd
ACCUMULATE (Initiation), TP: S$0.435, Last: S$0.420
Investment Thesis
I. High loyalty to specialty pharma products and proprietary brands.
Exclusive distributorship for product portfolio
Discerning customers, i.e. medical practitioners such as specialists, GPs, hospitals, pharmacies
II. Expanding retail presence through online and offline channels.
Access to retail sales channel through acquisition of Ocean Health® in 2016, i.e. Watson’s, Guardian etc.
Expanding product portfolio for sell-through
III. Presence as a channel integrator promotes business longevity.
Establish presence throughout the value chain from upstream to downstream activities
Preserve business value by engaging in higher value functions while outsourcing manufacturing and logistics
‘Asset-light’ operation
Phillip Securities Pte Ltd (A member of PhillipCapital) Co. Reg. No. 197501035Z © PhillipCapital 2020. All Rights Reserved. For internal circulation only.
Disclaimer: The information contained in this document is intended only for use during the presentation and should not be disseminated or distributed to parties outside the presentation.
Phillip Securities accepts no liability whatsoever with respect to the use of this document or its contents.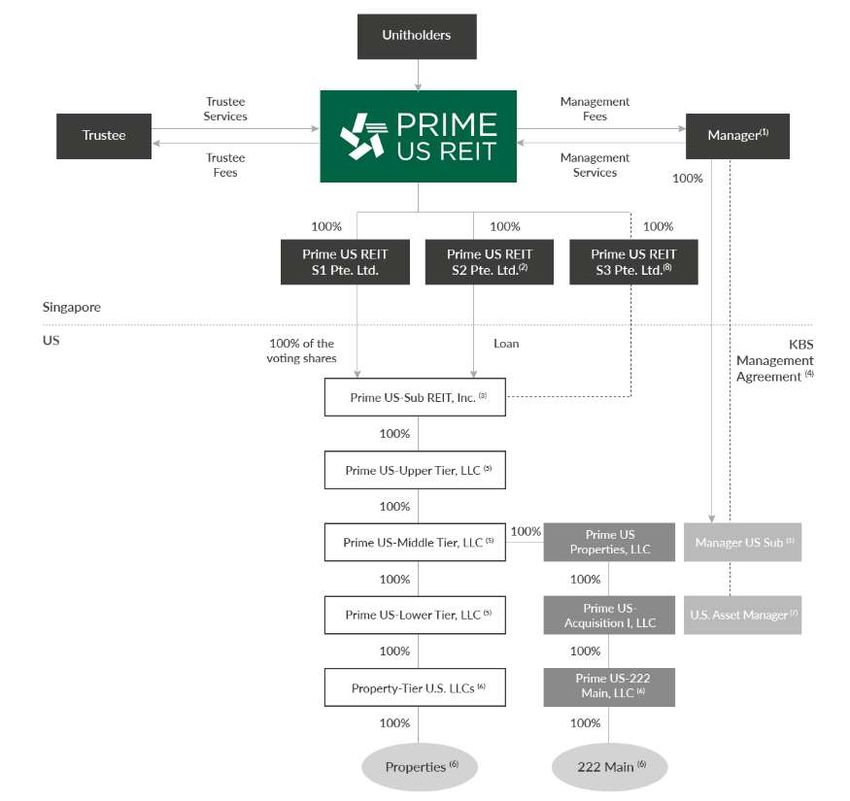
Hyphens Pharma International Ltd
ACCUMULATE (Initiation), TP: S$0.435, Last: S$0.420
Risk and Mitigations
I. Dependence on relationships with brand principals for specialty pharma portfolio.
Licensing agreement with brand principals is key within segment
Maintenance of healthy and longstanding working relations
II. Loss of demand from delayed product registrations and renewals.
Product registration to sell within a market typically expire within 2-3 years
Work with supply chain partners so manage inventory and prevent loss of demand through anticipating delays
III. Competition with other brand principals for proprietary brands portfolio.
Competitive environment within dermatology and health supplements segment
Recognition by patents and product training with medical practitioners to mitigate risks
Phillip Securities Pte Ltd (A member of PhillipCapital) Co. Reg. No. 197501035Z © PhillipCapital 2020. All Rights Reserved. For internal circulation only.
Disclaimer: The information contained in this document is intended only for use during the presentation and should not be disseminated or distributed to parties outside the presentation.
Phillip Securities accepts no liability whatsoever with respect to the use of this document or its contents.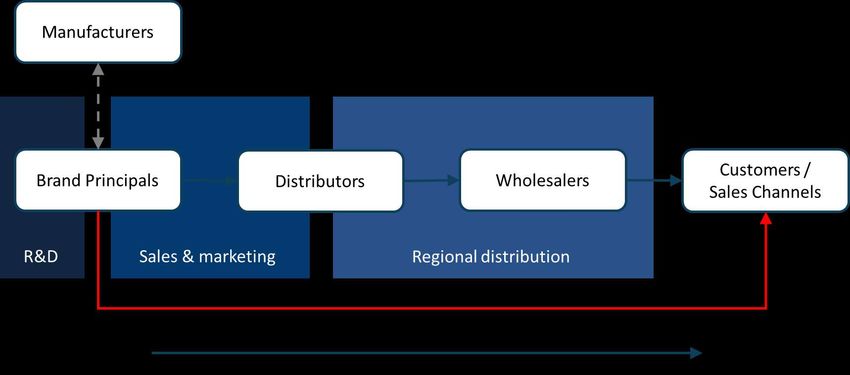
Hyphens Pharma International Ltd
ACCUMULATE (Initiation), TP: S$0.435, Last: S$0.420
Financial Highlights and Forecasts
I. Revenue
Robust growth for the next 3 years with growth in
Specialty Pharma and Proprietary Brands segment
II. Gross Profit Margin
Steady margins over next 3 years
III. Dividends
Distribute 30% of net profit
FY19 distribution of $0.01 per share (2 – 2.5% yield)
Valuation
Discounted Cash Flow Model (S$'000s) FY17 FY18 FY19 FY20e FY21e FY22e
WACC: 7.2% Revenue 112,652 120,930 119,442 131,776 144,982 160,729
11.6% 7.3% -1.2% 10.3% 10.0% 10.9%
Terminal growth rate: 1.5% Growth
FY17 FY18 FY19 FY20e FY21e FY22e
Initiate ACCUMULATE call with TP of $0.435 GP Margin 32.8% 33.7% 35.7% 34.1% 34.5% 34.8%
Phillip Securities Pte Ltd (A member of PhillipCapital) Co. Reg. No. 197501035Z © PhillipCapital 2020. All Rights Reserved. For internal circulation only.
Disclaimer: The information contained in this document is intended only for use during the presentation and should not be disseminated or distributed to parties outside the presentation.
Phillip Securities accepts no liability whatsoever with respect to the use of this document or its contents.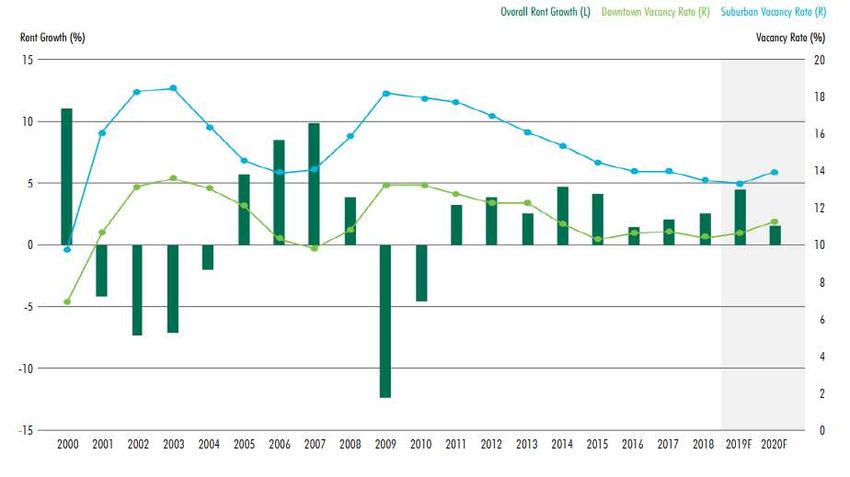
ESR REIT
                                         Merger of ESR REIT and Sabana Shari’ah Compliant REIT

                                                                                                                        Tan Jie Hui
                                                                                                                  Research Analyst
                                                                                                   Phillip Securities Research Pte Ltd
                                                                                                                      20th July 2020

Phillip Securities Pte Ltd (A member of PhillipCapital) Co. Reg. No. 197501035Z © PhillipCapital 2020. All Rights Reserved. For internal circulation only.
Disclaimer: The information contained in this document is intended only for use during the presentation and should not be disseminated or distributed to parties outside the presentation.
Phillip Securities accepts no liability whatsoever with respect to the use of this document or its contents.
ESR REIT– Merger with Sabana REIT
    (Not covered)
    Proposed merger solidifies ESR REIT’s position as the 5th largest industrial S-REIT by AUM.
    Post-Merger, Sabana REIT will become a wholly-owned sub-trust of ESR-REIT and the Enlarged REIT will continue to be
    managed by the ESR-REIT Manager. Merger is expected to be completed by 4Q20.

     Total acquisition cost: S$777.4mn comprising                                                                                                                                      ESR            Sabana     ESR-Sabana
     •     Consideration units (989.9mn shares; S$396.9mn)                                                                              No of shares (mn)                                    3,531        1,053         4,541
            •   Implied scheme consideration of S$0.377 per Sabana                                                                      Share price (S$)                                       0.40        0.38           0.40
                unit at a gross exchange ratio = 0.94x payable to                                                                       Market cap (S$mn)                                     1416          397          1821
                Sabana unit holders                                                                                                     NAV (S$mn)                                           1,449          539         1,988
     •     New debt (S$372.2mn)                                                                                                         GFA (mn sqft)                                          15.1          4.1          19.2
            •   Refinancing of Sabana REIT’s borrowings and interest                                                                    No of properties                                         57           18            75
                rate swaps of c. S$295.0m, upfront land premium of                                                                      AUM (S$bn)                                              3.2          0.9           4.1
                c.S$58.6m and professional fees of c.S$18.6mn                                                                           Tenants                                                 343         113           456
     •     Acquisition fee in units (S$8.3m)                                                                                            NAV/Share (S$)                                         0.41        0.51           0.44
            •   Payable in 20.7mn ESR-REIT Units to the ESR-REIT                                                                        Proposed DPU yield (%)                               6.8%         6.2%           7.0%
                Manager for the Merger based on illustrative issue
                                                                                                                                        Annualised DPU yield (%)
                price of S$0.401
                                                                                                                                        [after retention]                                    5.9%          2.5%          5.0%
                                                                                                                                       NAV: Net asset value; GFA: Gross Floor Area; AUM: Assets under management;
                                                                                                                                       DPU: Distribution per unit

Phillip Securities Pte Ltd (A member of PhillipCapital) Co. Reg. No. 197501035Z © PhillipCapital 2020. All Rights Reserved. For internal circulation only.
Disclaimer: The information contained in this document is intended only for use during the presentation and should not be disseminated or distributed to parties outside the presentation.
Phillip Securities accepts no liability whatsoever with respect to the use of this document or its contents.
ESR REIT– Merger with Sabana REIT
(Not covered)
ESR Sabana ESR-Sabana
Shareholders No of shares (mn) % Held No of shares (mn) % Held No of shares (mn) % Held
ESR Cayman 325 9.20% 220 20.90% 532 12.20%
Mr. Tong Jinquan 809 22.90% 35 3.30% 841 18.50%
Others 2398 67.90% 798 75.80% 3148 69.30%
Benefits to merger:
• DPU accretion of +3.5% and NAV accretion of +5.2% for ESR unitholders; +12.9% DPU accretion for Sabana unitholders
• Increased exposure to High-Specs and Logistics Segments
• Contribution from Hi-specs and logistics warehouse increased from 40-50%
• Contribution from General industrial decreased from 32% to 27%
• Greater diversification: Reduced concentration of top 10 tenants from 31% to 25% of GRI
• Greater presence in key industrial clusters due to 31.6% increase in no. of properties
• Organic growth: Additional 1.2mn sqft of unutilized GFA from Sabana REIT (1.02.2)
• Lower cost of debt (-25bps), longer WADE (+0.5 years), access to wider pools of capital
• Increased probability of inclusion in key indices due to increased market cap (EPRA Index inclusion threshold: S$1.3bn)
Phillip Securities Pte Ltd (A member of PhillipCapital) Co. Reg. No. 197501035Z © PhillipCapital 2020. All Rights Reserved. For internal circulation only.
Disclaimer: The information contained in this document is intended only for use during the presentation and should not be disseminated or distributed to parties outside the presentation.
Phillip Securities accepts no liability whatsoever with respect to the use of this document or its contents.US OFFICE REITS
Resilience amidst the new normal
Natalie Ong/ Tan Jie Hui
Research Analyst
Phillip Securities Research Pte Ltd
20 July 2020
Phillip Securities Pte Ltd (A member of PhillipCapital) Co. Reg. No. 197501035Z © PhillipCapital 2020. All Rights Reserved. For internal circulation only.
Disclaimer: The information contained in this document is intended only for use during the presentation and should not be disseminated or distributed to parties outside the presentation.
Phillip Securities accepts no liability whatsoever with respect to the use of this document or its contents.US OFFICE REITS
Sector Background
In the near-term, the pandemic has resulted is fewer workers in the office and more satellite offices being built up in the
suburbs. We believe working from home is not a permanent solution that can replace physical office materially.
Sector Merits
1. Attractive dividend yields.
2. Collaborative work in a dynamic environment to hold demand for office; long WALEs to support.
3. Office-using jobs less affected by unemployment; Looking forward to a stabilised normal.
4. Office space demand by Top 3 leasing drivers (Tech, financial and professional services) will moderate
not abate.
Key Risks
1. Structural change: Weaker economic outlook and takeaways from COVID-19 to push companies towards a
more mobile operating model.
2. Leasing and supply headwinds.
Phillip Securities Pte Ltd (A member of PhillipCapital) Co. Reg. No. 197501035Z © PhillipCapital 2020. All Rights Reserved. For internal circulation only.
Disclaimer: The information contained in this document is intended only for use during the presentation and should not be disseminated or distributed to parties outside the presentation.
Phillip Securities accepts no liability whatsoever with respect to the use of this document or its contents.US OFFICE REITS
Sector Merits Comparison Market Cap (mn) Last Price ($) P/NAV (x) Indicated Yield (%)
SG-Listed US office REITs
1. Attractive dividend yields. Manulife US REIT (USD) 1109 0.71 0.88 8.34
SG-Listed US office REITs Prime US REIT (USD) 806 0.77 0.86 8.24
Keppel Pacific Oak REIT (USD) 634 0.68 0.84 8.92
present attractive yield spreads
Average 850 0.86 8.50
of 7-8% to the US 10-year SG-Listed SG office REITs
treasury yields. Capitaland Commercial Trust (SGD) 6758 1.75 0.95 4.62
The yields of SG-listed US office Keppel REIT (SGD)
Average
3662
5210
1.08 0.80
0.88
5.19
4.90
REITs also outperform that of US-Listed office REITs
both SG office REITS and US- Alexandra Real Estate Equities (USD) 21685 163.03 2.17 2.60
listed US office REITs by 1.7x. Boston Properties (USD) 14182 91.28 2.42 4.29
Brandywine Realty Trust (USD) 1780 10.44 1.16 7.28
In terms of its risk-reward, we Corporate Office Properties Trust (USD) 2806 25.02 1.73 4.40
believe that US office REITs are Cousins Properties (USD) 4318 29.07 0.95 4.13
worth the investment in the long Hudson Pacific Properties (USD) 3619 23.61 1.09 4.23
Mack-Cali Realty Corporation (USD) 1325 14.63 0.92 5.47
run. SL Green Realty (USD) 3776 48.68 0.74 7.27
Average 6687 1.40 4.96
Phillip Securities Pte Ltd (A member of PhillipCapital) Co. Reg. No. 197501035Z © PhillipCapital 2020. All Rights Reserved. For internal circulation only.
Disclaimer: The information contained in this document is intended only for use during the presentation and should not be disseminated or distributed to parties outside the presentation.
Phillip Securities accepts no liability whatsoever with respect to the use of this document or its contents.US OFFICE REITS
Sector Merits
2. Collaborative work in a dynamic environment to hold demand for office; long WALEs to support.
• According to Gensler’s US Workplace Survey, since 2016, office work has evolved from an
individualistic mode (2016: 50%; 2019: 45%) to one that is more learning and collaborative (2016:
50%; 2019: 55%). Employees have spent 14-15% of their work time telecommuting.
• In the same timeframe, the office market was experiencing positive rent growth and declining
vacancies. This shows that telecommuting and office may not be mutually exclusive.
Phillip Securities Pte Ltd (A member of PhillipCapital) Co. Reg. No. 197501035Z © PhillipCapital 2020. All Rights Reserved. For internal circulation only.
Disclaimer: The information contained in this document is intended only for use during the presentation and should not be disseminated or distributed to parties outside the presentation.
Phillip Securities accepts no liability whatsoever with respect to the use of this document or its contents.US OFFICE REITS
Sector Merits
2. Collaborative work in a dynamic environment to hold demand for office; long WALEs to support.
• Employers do see merits in a dynamic working environment such as cross-functional collaboration,
which lead to mixed responses in their view of needing an office in 3 years.
• According to Moody’s Investor Service, 94% of the larger office leases will only start to expire 4
years from now, which suggests that landlords do have time to adjust to the future of work.
Lease terms for US office size of 10,000 sqft or more
Office space needs are expected to: 50%
43%
Reduce by more than 25% 3% 45%
40% 37%
Reduce between 16-25% 12% 35%
30%
Reduce between 5-15% 15% 25%
Stay about the same 19% 20%
15%
15%
Increase between 5-15% 26% 10% 6%
Increase between 16-25% 16% 5%
0%
Increase by more than 25% 9% 12 years
Phillip Securities Pte Ltd (A member of PhillipCapital) Co. Reg. No. 197501035Z © PhillipCapital 2020. All Rights Reserved. For internal circulation only.
Disclaimer: The information contained in this document is intended only for use during the presentation and should not be disseminated or distributed to parties outside the presentation.
Phillip Securities accepts no liability whatsoever with respect to the use of this document or its contents.US OFFICE REITS
Sector Merits
3. Office-using jobs less affected by unemployment; Looking forward to a stabilised normal.
• The unemployment rates for the heavy-weight anchor industries in the office – Financial
Activities and Professional & Business services in June was 5.1% and 8.6% respectively,
which is the lowest and third lowest amongst the industries.
• Using the 2008 GFC as a recent crisis proxy, business formations in the U.S. grew at a
CAGR of 4% over 10 years as the US economy recovered.
Business formations post-2008 GFC
950,000
900,000
850,000
800,000
750,000
700,000
650,000
600,000
550,000
500,000
1Q08
4Q08
3Q09
2Q10
1Q11
4Q11
3Q12
2Q13
1Q14
4Q14
3Q15
2Q16
1Q17
4Q17
3Q18
2Q19
1Q20
Phillip Securities Pte Ltd (A member of PhillipCapital) Co. Reg. No. 197501035Z © PhillipCapital 2020. All Rights Reserved. For internal circulation only.
Disclaimer: The information contained in this document is intended only for use during the presentation and should not be disseminated or distributed to parties outside the presentation.
Phillip Securities accepts no liability whatsoever with respect to the use of this document or its contents.US OFFICE REITS
Sector Merits
4. Office space demand by Top 3 leasing drivers (Tech, Tech was the dominant leasing driver in 2019
financial and professional services) will moderate not
abate.
• The existence of virtual conferencing tools predates
COVID, but these sectors still choose to conduct
certain functions/elements of business in the flesh
implies that these sectors are best served by office
premise and explains the pre-disposition for the
office environment.
• Structural shifts in the office landscape will be
gradual rather than immediate, with the desire for
physical collaboration and networking resulting in
the maintenance of an office address.
Phillip Securities Pte Ltd (A member of PhillipCapital) Co. Reg. No. 197501035Z © PhillipCapital 2020. All Rights Reserved. For internal circulation only.
Disclaimer: The information contained in this document is intended only for use during the presentation and should not be disseminated or distributed to parties outside the presentation.
Phillip Securities accepts no liability whatsoever with respect to the use of this document or its contents.US OFFICE REITS
Key Risks
1. Weaker economic outlook and takeaways from COVID-19 to push companies towards a more mobile
operating model
The successful implementation of telecommuting has heightened the possibility of moving towards a
premise-light business model.
Additionally, consolidation/downsizing within industries may lead to greater ‘shadow market’ space
should current tenants be allowed to sublet their space.
2. Leasing and supply headwinds
Leasing activity fell by 18% QoQ and 14% YoY as businesses take on a more cautious approach with
regards to relocations and expansions.
Office vacancy rate increased by 20bps as new supply outpaced demand in 1Q20. Net absorption for
the quarter was the lowest since 1Q13.
Phillip Securities Pte Ltd (A member of PhillipCapital) Co. Reg. No. 197501035Z © PhillipCapital 2020. All Rights Reserved. For internal circulation only.
Disclaimer: The information contained in this document is intended only for use during the presentation and should not be disseminated or distributed to parties outside the presentation.
Phillip Securities accepts no liability whatsoever with respect to the use of this document or its contents.Prime US REIT
Prime for resilience
Tan Jie Hui
Research Analyst
Phillip Securities Research Pte Ltd
20 July 2020
Phillip Securities Pte Ltd (A member of PhillipCapital) Co. Reg. No. 197501035Z © PhillipCapital 2020. All Rights Reserved. For internal circulation only.
Disclaimer: The information contained in this document is intended only for use during the presentation and should not be disseminated or distributed to parties outside the presentation.
Phillip Securities accepts no liability whatsoever with respect to the use of this document or its contents.Prime US REIT (BUY, TP: S$0.88, Last: S$0.77)
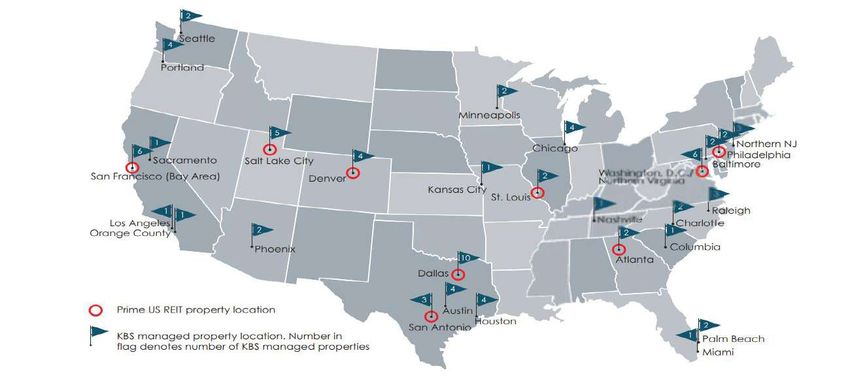
Prime US REIT (“Prime”) primarily invests in office and real estate-related assets in
the US. Prime’s portfolio consists of 12 Class A freehold office properties that are
valued at approximately US$1.4 billion, strategically located in 10 primary markets.
Investment Merits
1. Attractive FY20 dividend yields at 8.9%, 8% higher than that of US treasury yields.
2. Resilient attributes: Long WALE with minimal lease expiry in FY20, diversified income contribution and
built-in rental escalation to support the portfolio’s gross rental and distributable income.
3. Robust balance sheet through proactive capital management with a tax-efficient REIT structure
4. Reputable REIT management team associated with one of the largest U.S. commercial real estate
manager.
Key Risks
1. Debilitated economy to slow leasing activities for Prime in 2020.
2. Weakness in co-working spaces
Phillip Securities Pte Ltd (A member of PhillipCapital) Co. Reg. No. 197501035Z © PhillipCapital 2020. All Rights Reserved. For internal circulation only.
Disclaimer: The information contained in this document is intended only for use during the presentation and should not be disseminated or distributed to parties outside the presentation.
Phillip Securities accepts no liability whatsoever with respect to the use of this document or its contents.Prime US REIT (BUY, TP: S$0.88, Last: S$0.77)
Investment Merits
1. Attractive FY20 dividend yields at 8.9%, 8% higher than that of US treasury yields.
Prime is currently trading at
Comparison Manulife US REIT Prime US REIT Keppel Pacific Oak US REIT 0.86x by P/NAV.
Market Cap (US mn) 1109 806 634
Our forward dividend yield for
Indicated Yield (%) 8.34 8.24 8.92
Prime in FY20e and FY21e is
P/NAV 0.88 0.86 0.84 8.9% and 9.5% respectively.
Phillip Securities Pte Ltd (A member of PhillipCapital) Co. Reg. No. 197501035Z © PhillipCapital 2020. All Rights Reserved. For internal circulation only.
Disclaimer: The information contained in this document is intended only for use during the presentation and should not be disseminated or distributed to parties outside the presentation.
Phillip Securities accepts no liability whatsoever with respect to the use of this document or its contents.Prime US REIT (BUY, TP: S$0.88, Last: S$0.77)
Investment Merits
2. Long portfolio WALE of 4.9 years (SREITs: 2-3 years) with minimal lease expiry in FY20 (5.7% by GRI)
50.0%
45.7%
45.0% 43.5%
40.0%
35.0% Lease expiries are also well
30.0% staggered, with a maximum of
25.0% 17.3% of leases expiring in the
20.0% 17.3%
15.5%15.7%
next 4 years.
15.7%
15.0%
9.1% 8.9% 8.9% 8.0%
10.0%
5.7% 6.0%
5.0%
0.0%
FY20 FY21 FY22 FY23 FY24 FY25 and
beyond
GRI NLA
Phillip Securities Pte Ltd (A member of PhillipCapital) Co. Reg. No. 197501035Z © PhillipCapital 2020. All Rights Reserved. For internal circulation only.
Disclaimer: The information contained in this document is intended only for use during the presentation and should not be disseminated or distributed to parties outside the presentation.
Phillip Securities accepts no liability whatsoever with respect to the use of this document or its contents.Prime US REIT (BUY, TP: S$0.88, Last: S$0.77)
Investment Merits
2. Diversified income contribution and built-in rental escalation to support the portfolio’s gross rental and
distributable income.
GRI by sector mix
GRI by market Leases with in-built rental escalation
15.3% 15.1%
6.2% 13.4%
7.7% 4.2%
12.5%
6.4%
7.6%
12.8%
4.6%
8.6% 4.0% 9.0%
6.1%
7.9% 13.5% 5.9% 8.4%
8.5%
9.4% Finance
12.9% Communications
Accomodation & Food
Salt Lake City Atlanta Legal Leases with inbuilt rental escalation (1-3%) Others
Washington DC Denver Real Estate
Sacramento St Louis Professional, Scientific, Tech Services
Oakland Philadelphia Mining, O&G
Healthcare
Dallas San Antonio
Scientific R&D
Information Services
Government
Others
Phillip Securities Pte Ltd (A member of PhillipCapital) Co. Reg. No. 197501035Z © PhillipCapital 2020. All Rights Reserved. For internal circulation only.
Disclaimer: The information contained in this document is intended only for use during the presentation and should not be disseminated or distributed to parties outside the presentation.
Phillip Securities accepts no liability whatsoever with respect to the use of this document or its contents.Prime US REIT (BUY, TP: S$0.88, Last: S$0.77)
Investment Merits
3. Robust balance sheet through proactive capital management….
Prime continues to maintain its gearing ratio at
180
160 160 a healthy level of 33.7% and interest coverage
160
ratio of 5.8x.
140
120 105 There will be no refinancing required until 2024
100 as extension options are available for both the
80 loans maturing in FY22 and FY23.
63
60
40
89% of the debt is locked into fixed interest
rates.
20
0
Weighted average interest rate for the portfolio
FY20 FY21 FY22 FY23 FY24 … FY29
is now 2.8%.
Debt (US$mn)
Phillip Securities Pte Ltd (A member of PhillipCapital) Co. Reg. No. 197501035Z © PhillipCapital 2020. All Rights Reserved. For internal circulation only.
Disclaimer: The information contained in this document is intended only for use during the presentation and should not be disseminated or distributed to parties outside the presentation.
Phillip Securities accepts no liability whatsoever with respect to the use of this document or its contents.Prime US REIT (BUY, TP: S$0.88, Last: S$0.77)
Investment Merits
3. … With an efficient tax structure.
Prime’s headline tax expenses mostly reflect
deferred tax expenses, which will only be
realized upon sale of the properties in the
portfolio.
Additionally, Prime’s REIT structure has no
tax leakage through federal income or
withholding taxes, provided that the
unitholders comply and furnish the required
documents for Portfolio Interest Exemption.
Phillip Securities Pte Ltd (A member of PhillipCapital) Co. Reg. No. 197501035Z © PhillipCapital 2020. All Rights Reserved. For internal circulation only.
Disclaimer: The information contained in this document is intended only for use during the presentation and should not be disseminated or distributed to parties outside the presentation.
Phillip Securities accepts no liability whatsoever with respect to the use of this document or its contents.Prime US REIT (BUY, TP: S$0.88, Last: S$0.77)
Investment Merits
4. Reputable sponsor and management team associated with one of the largest U.S. commercial real
estate managers.
Associated with KBS, KBS Asia Partners
(KAP) is the sponsor of Prime. To date,
KBS has registered $41.7bn worth of
transactional volume with over $8bn of
AUM since inception.
KBS has presence in all the states that
Prime has presence in, and has
successfully managed properties through
4 disruptive events.
Separately, Prime will also be able to
benefit from KBS’ deal sourcing, deal
screening and deal execution capabilities
for inorganic growth opportunities.
Phillip Securities Pte Ltd (A member of PhillipCapital) Co. Reg. No. 197501035Z © PhillipCapital 2020. All Rights Reserved. For internal circulation only.
Disclaimer: The information contained in this document is intended only for use during the presentation and should not be disseminated or distributed to parties outside the presentation.
Phillip Securities accepts no liability whatsoever with respect to the use of this document or its contents.Prime US REIT (BUY, TP: S$0.88, Last: S$0.77)
COVID-19 update:
No rent forgiveness; rent collections for May and June are at 99%, with June’s collections on track.
As of date, only 11 rental deferments
Tenant Industry Sector
Credit Rating Property % of CRI are provided to small retail tenants
1 Charter Communications Communication
Moody's: Ba1 Village Center Station I & II 9%
which contribute less than 1% of the
Moody's: A3
GRI.
S&P: BBB+
2 Goldman Sachs Finance Fitch: A 222 Main 6%
3 Sodexo Operations Accommodation & Food S&P: A- One Washingtonian Center 6%
Apart from Sodexo, Apache and
4 Wells Fargo Bank Legal Private Firm 222 Main; Village Center Station I 4% WeWork, majority of Prime’s top 10
Moody's: a1 tenants are established tenants. All of
5 Holland & Hart Finance S&P: A+ 171 17th Street 4% Prime’s top 25 tenants which constitute
Moody's: Aa2 64% by CRI have paid 100% of April’s
6 State of California Government Fitch: AA Park Tower 3% and May’s rent.
7 Arnall Golden Gregory Legal Private Firm 171 17th Street 3%
8 Whitney, Bradley & Brown Professional Services Private Firm Reston Square 3% Amidst uncertainty in the outlook for co-
S&P: BB+ working spaces, it may comfort
9 Apache Corporation Mining, Oil & Gas Fitch: BBB Promenade 2% investors to know that the rents from all
10 WeWork Real Estate Fitch: CCC+ Tower I at Emeryville 2% co-working entities (WeWork + 3
smaller operators) have been collected.
Phillip Securities Pte Ltd (A member of PhillipCapital) Co. Reg. No. 197501035Z © PhillipCapital 2020. All Rights Reserved. For internal circulation only.
Disclaimer: The information contained in this document is intended only for use during the presentation and should not be disseminated or distributed to parties outside the presentation.
Phillip Securities accepts no liability whatsoever with respect to the use of this document or its contents.Prime US REIT (BUY, TP: S$0.88, Last: S$0.77)
Key risks:
1. Debilitated economy to slow leasing activities for Prime in 2020.
We expect leasing activities to weaken as businesses are impacted by the recent escalation of
events from COVID-19.
Greater investor caution and selectivity coupled with lockdown inconveniences will increase the
time required to close new leases.
2. Weakness in co-working spaces.
Demand for co-working spaces is expected to remain soft, which poses uncertainty to Prime’s
income stream.
Nevertheless, the total proportion of co-working spaces in the portfolio is only 3.7%.
Initiate coverage on Prime US REIT with a BUY rating and a TP of $0.88.
Our DDM-derived target price is based on a five-year projection, cost of equity of 9.96% and terminal
growth rate of 2%. It translates to a FY20e dividend yield of 8.9% and a total return of 24%.
Phillip Securities Pte Ltd (A member of PhillipCapital) Co. Reg. No. 197501035Z © PhillipCapital 2020. All Rights Reserved. For internal circulation only.
Disclaimer: The information contained in this document is intended only for use during the presentation and should not be disseminated or distributed to parties outside the presentation.
Phillip Securities accepts no liability whatsoever with respect to the use of this document or its contents.Manulife US REIT
Quality that speaks for itself
Natalie Ong
Research Analyst
Phillip Securities Research Pte Ltd
20 July 2020
Phillip Securities Pte Ltd (A member of PhillipCapital) Co. Reg. No. 197501035Z © PhillipCapital 2020. All Rights Reserved. For internal circulation only.
Disclaimer: The information contained in this document is intended only for use during the presentation and should not be disseminated or distributed to parties outside the presentation.
Phillip Securities accepts no liability whatsoever with respect to the use of this document or its contents.Manulife US REIT (BUY, TP: S$0.80, Last: S$0.71)
Investment Merits
1. Favourable portfolio attributes - Income visibility
and growth embedded in the portfolio.
2. Attractive valuations of 0.88x P/NAV near -2
standard deviation (SD) level, 3.28% yield spread
at +1 SD level.
3. Continued relevance and demand for office space;
demand for office to moderate not abate.
Phillip Securities Pte Ltd (A member of PhillipCapital) Co. Reg. No. 197501035Z © PhillipCapital 2020. All Rights Reserved. For internal circulation only.
Disclaimer: The information contained in this document is intended only for use during the presentation and should not be disseminated or distributed to parties outside the presentation.
Phillip Securities accepts no liability whatsoever with respect to the use of this document or its contents.Manulife US REIT (BUY, TP: S$0.80, Last: S$0.71)
1. Favourable portfolio attributes -
Income visibility and growth
embedded in the portfolio.
Occupancy of 96.5%
Long WALE of 5.7 years
Built-in rental escalation (c.2% p.a.)
Low expiries (4.4%/6.4% FY20/FY21)
High tenant retention of 76% in FY19
Phillip Securities Pte Ltd (A member of PhillipCapital) Co. Reg. No. 197501035Z © PhillipCapital 2020. All Rights Reserved. For internal circulation only.
Disclaimer: The information contained in this document is intended only for use during the presentation and should not be disseminated or distributed to parties outside the presentation.
Phillip Securities accepts no liability whatsoever with respect to the use of this document or its contents.Manulife US REIT (BUY, TP: S$0.80, Last: S$0.71)
2. Attractive valuations of 0.88x P/NAV near -2 standard deviation (SD) level, 3.28% yield
spread at +1 SD level.
The high collectability of rents (only 2% of rental
deferments provided in April)
S&P Global Ratings: 22% of loans on lodging
properties in CMBS deals were delinquent as of
June, followed by 17% for retail properties but
only 2.2% for office buildings
Longer leases in the US office market to provide
support for leasing demand
Phillip Securities Pte Ltd (A member of PhillipCapital) Co. Reg. No. 197501035Z © PhillipCapital 2020. All Rights Reserved. For internal circulation only.
Disclaimer: The information contained in this document is intended only for use during the presentation and should not be disseminated or distributed to parties outside the presentation.
Phillip Securities accepts no liability whatsoever with respect to the use of this document or its contents.Manulife US REIT (BUY, TP: S$0.80, Last: S$0.71)
3. Continued relevance and demand for
office space; demand for office to
moderate not abate.
Top 3 leasing drivers (tech, financial and
professional services) have a predisposition for
the office workplace setting
Physical interaction viewed as the most effective
mode for mentoring, collaboration, and innovation
Work trend study show that the physical face-to-
face mode of collaboration is as valued as virtual
collaboration.
Phillip Securities Pte Ltd (A member of PhillipCapital) Co. Reg. No. 197501035Z © PhillipCapital 2020. All Rights Reserved. For internal circulation only.
Disclaimer: The information contained in this document is intended only for use during the presentation and should not be disseminated or distributed to parties outside the presentation.
Phillip Securities accepts no liability whatsoever with respect to the use of this document or its contents.Manulife US REIT (BUY, TP: S$0.80, Last: S$0.71)
3. Continued relevance and demand for office space; demand for office to moderate not
abate.
Top 3 leasing drivers (tech, financial and
professional services) have a predisposition for
the office workplace setting
Physical interaction viewed as the most effective
mode for mentoring, collaboration, and innovation
Work trend study show that the physical face-to-
face mode of collaboration is as valued as virtual
collaboration.
Phillip Securities Pte Ltd (A member of PhillipCapital) Co. Reg. No. 197501035Z © PhillipCapital 2020. All Rights Reserved. For internal circulation only.
Disclaimer: The information contained in this document is intended only for use during the presentation and should not be disseminated or distributed to parties outside the presentation.
Phillip Securities accepts no liability whatsoever with respect to the use of this document or its contents.Singapore REIT Monthly
Ready for the next phase
Natalie Ong
Research Analyst
Phillip Securities Research Pte Ltd
20 July 2020
Phillip Securities Pte Ltd (A member of PhillipCapital) Co. Reg. No. 197501035Z © PhillipCapital 2020. All Rights Reserved. For internal circulation only.
Disclaimer: The information contained in this document is intended only for use during the presentation and should not be disseminated or distributed to parties outside the presentation.
Phillip Securities accepts no liability whatsoever with respect to the use of this document or its contents.STI RETURN (4.5) 5.2 (15.6) (16.7)
FTSE REIT Index outperforming STI
FSTREI VS. STI
OVERWEIGHT (Maintained)
950
INDEX RETURN (%)
850 1MTH 3MTH YTD 1YR
FSTREI RETURN (3.1) 17.8 (7.6) (4.9)
750 FSTREH RETURN (4.5) 3.4 (19.1) (19.0)
STI RETURN (4.5) 5.2 (15.6) (16.7)
650
550 FSTREI VS. STI
Jul-19 Oct-19 Jan-20 Apr-20 Jul-20
FSTREI Index 950
Source: Bloomberg, PSR STI (rebased)
850
FSTREH Index (rebased)
750
10-year SGS (%) & 3-month SOR (%)
650
4.5
Phillip Securities Pte Ltd (A member of PhillipCapital) Co. Reg. No. 197501035Z © PhillipCapital 2020. All Rights Reserved. For internal circulation only.
Disclaimer: The information contained in this document is intended only for use during the presentation and should not be disseminated or distributed to parties outside the presentation.
Phillip Securities accepts no liability whatsoever with respect to the use of this document or its contents.
3.5 550Price performance by sector
Healthcare Hospitality Retail Commercial Industrial Diversified
Change YTD -5.4% -35.8% -20.3% -20.1% 4.9% -21.8%
Phillip Securities Pte Ltd (A member of PhillipCapital) Co. Reg. No. 197501035Z © PhillipCapital 2020. All Rights Reserved. For internal circulation only.
Disclaimer: The information contained in this document is intended only for use during the presentation and should not be disseminated or distributed to parties outside the presentation.
Phillip Securities accepts no liability whatsoever with respect to the use of this document or its contents.SREIT Dividend Yield at +0.19 s.d. level
Dividend yield: 4.5% FED rate: 0% - 0.25%, after150bps cut
2019 Ave: 4.6%
3M SOR: 0.15% (Sep 2014 lows)
Div. yield spread: 3.6% (+0.19 SD level)
2019 Ave: 2.6% 10YSGS: 0.9%
Source: Bloomberg, PSR
Phillip Securities Pte Ltd (A member of PhillipCapital) Co. Reg. No. 197501035Z © PhillipCapital 2020. All Rights Reserved. For internal circulation only.
Disclaimer: The information contained in this document is intended only for use during the presentation and should not be disseminated or distributed to parties outside the presentation.
Phillip Securities accepts no liability whatsoever with respect to the use of this document or its contents.Retail – Recovery in Phase 2
The RSI (Ex MV) was weighed down trade sectors
- department store (-93.7%), Fashion (-89.2%)
and Jewellery (-96.9%) sales fell most
pronouncedly. The only positives were the FMCG
segments, supermarkets (+50.9%) and mini-marts
and convenience stores (+8.6%).
Within the F&B index, the Fast Food Outlet
segment, which were early adopters of food
delivery services. fell 25.7% compared to
Restaurants (-69.2%), caterers (-44.6%) and other
food outlets (-41.3%).
RSI
RSI RSI RSI F&B Index
(excl. motor
(Dept stores) (Supermarkets) (Fashion)
vehicles)
May-20 -46.4 -93.7 50.9 -89.2 -50.8
May-19 -2.0 -4.6 -0.7 -1.5 2.5
Source: CEIC, PSR
Phillip Securities Pte Ltd (A member of PhillipCapital) Co. Reg. No. 197501035Z © PhillipCapital 2020. All Rights Reserved. For internal circulation only.
Disclaimer: The information contained in this document is intended only for use during the presentation and should not be disseminated or distributed to parties outside the presentation.
Phillip Securities accepts no liability whatsoever with respect to the use of this document or its contents.Hospitality – Lingering fears will impede recovery
RevPAR for the Upscale segment improved the
most (2.2ppts MoM) rest of sectors 2 to 3.5ppts
improvement in RevPARs
The Upscale segment slashed average room
rates by 70% YoY, the deepest discount across
the segments. Occupancy doubled for the month
of May, which rose from 31.9% to 71.3%
(COVID-related business)
Hotels can apply to reopen for staycation booking
Visitor Arrivals Hotel RevPAR Hotel Occupancy Hotel Average from 3 July 2020
(S$) (%) Room Rate (S$)
Ma y-20 880 41 57.0 72
Ma y-19 1,487,758 169 82.0 207 However, we are expecting hoteliers to give
YoY% -99.94% -75.84% -65.26%
significant discounts to achieve the sweet spot
RevPAR per
Average Luxury Upscale Mid-tier Economy
room/night
May-20 41 44 53 43 32
May-19 169 358 192 137 83
YoY% -75.84% -87.82% -72.54% -69.02% -61.25%
Source: CEIC, PSR
Phillip Securities Pte Ltd (A member of PhillipCapital) Co. Reg. No. 197501035Z © PhillipCapital 2020. All Rights Reserved. For internal circulation only.
Disclaimer: The information contained in this document is intended only for use during the presentation and should not be disseminated or distributed to parties outside the presentation.
Phillip Securities accepts no liability whatsoever with respect to the use of this document or its contents.PSR Calls
3M Daily
Share P/NAV Target Price FY20e DPU FY21e DPU FY20e DPU FY21e DPU Total
Average PSR Rating
Price S$ (x) S$ cents cents Yield Yield return
Volume
Ascott Residence Trust 9.4 1.00 0.8 ACCUMULATE 1.25 6.87 8.14 6.9% 8.2% 32.5%
CapitaLand Mall Trust 23.2 2.04 1.0 BUY 2.33 10.78 12.81 5.3% 6.3% 19.5%
Frasers Centrepoint Trust 3.9 2.41 1.1 ACCUMULATE 2.61 9.88 13.56 4.1% 5.6% 12.4%
Dasin Retail Trust1 0.2 0.79 0.6 ACCUMULATE 0.91 5.00 5.62 6.3% 7.1% 21.5%
CapitaLand Commercial Trust 16.6 1.77 1.0 ACCUMULATE 1.91 7.67 9.12 4.3% 5.2% 12.2%
IREIT Global Trust2 0.7 0.75 0.9 BUY 0.77 5.47 5.54 7.3% 7.4% 10.7%
Ascendas REIT 13.2 3.30 1.5 ACCUMULATE 3.29 16.74 17.06 5.1% 5.2% 4.8%
Keppel DC REIT 7.0 2.67 2.3 NEUTRAL 2.31 8.99 9.55 3.4% 3.6% -10.1%
EC World REIT 1.2 0.66 0.7 BUY 0.77 5.92 6.33 9.0% 9.7% 26.6%
Note: 3M Daily Average Volume is
calculated based on PSR,
Source: Bloomberg, the total
updated 8 July 2020
1
Covered by PSR under a paid research agreement
2
Covered by PSR under the ‘Research Talent Development Grant Scheme’ administered by SGX
Phillip Securities Pte Ltd (A member of PhillipCapital) Co. Reg. No. 197501035Z © PhillipCapital 2020. All Rights Reserved. For internal circulation only.
Disclaimer: The information contained in this document is intended only for use during the presentation and should not be disseminated or distributed to parties outside the presentation.
Phillip Securities accepts no liability whatsoever with respect to the use of this document or its contents.SATS Ltd
4Q20 Results
A long road to recovery
Paul Chew
Head Of Research
Phillip Securities Research Pte Ltd
20th July 2020
Phillip Securities Pte Ltd (A member of PhillipCapital) Co. Reg. No. 197501035Z © PhillipCapital 2020. All Rights Reserved. For internal circulation only.
Disclaimer: The information contained in this document is intended only for use during the presentation and should not be disseminated or distributed to parties outside the presentation.
Phillip Securities accepts no liability whatsoever with respect to the use of this document or its contents.SATS Ltd (SELL (Downgraded), TP: S$1.95, Last: S$2.88)
Positives
• Responding with aggressive cost cuts. Excluding the
government grant of S$21.9mn (2 months) in 4Q20, SATS has
managed to lower staff cost by 16% YoY, more than the 8%,
including government grants.
• Other sources of revenue. Some of the new areas of revenue
includes wholesale supplier to cloud kitchens catering to
home deliveries. Another source of revenue was cruise
centre support to house foreign workers in cruise ships..
Negatives
• No final dividend. The was no final dividend compared with
13 cents a year ago. The company needs to be prudent and
retain cash due to the uncertainties.
Outlook: 4Q20 results was below guidance of $15-20,m profit due to the write-offs. SATS is temporarily closing Inflight Catering Centre 1 (ITC 1)
and consolidate operations at ITC 2. 1Q20 guidance is for a net loss of S$50mn.
Downgrade to SELL from NEUTRAL: Why our sell recommendation?
1.No clear visibility the steepness or duration of recovery. IATA forecast is 2023 recovery in air traffic to 2019 levels;
2. Absence of dividend yield and net loss to persist, we are using price to book to value. Average of 1.35x during the global financial crisis in 2009 as
a benchmark;
Phillip Securities Pte Ltd (A member of PhillipCapital) Co. Reg. No. 197501035Z © PhillipCapital 2020. All Rights Reserved. For internal circulation only.
Disclaimer: The information contained in this document is intended only for use during the presentation and should not be disseminated or distributed to parties outside the presentation.
Phillip Securities accepts no liability whatsoever with respect to the use of this document or its contents.Timing and steepness of the recovery is unclear
SIA: Passengers Carried (000s - 3MMA) SG: Changi Airport Activity
2000 (3MMA - YoY)
20%
1600 0%
-20%
1200
-40%
800
-60%
400 -80%
-100%
0 2006 2008 2010 2012 2014 2016 2018 2020
2006 2007 2009 2010 2012 2013 2015 2017 2018 2020 Freight Traffic Passengers Traffic
Source: CEIC, PSR
Phillip Securities Pte Ltd (A member of PhillipCapital) Co. Reg. No. 197501035Z © PhillipCapital 2020. All Rights Reserved. For internal circulation only.
Disclaimer: The information contained in this document is intended only for use during the presentation and should not be disseminated or distributed to parties outside the presentation.
Phillip Securities accepts no liability whatsoever with respect to the use of this document or its contents.Week 30 - Phillip Singapore Weekly
Paul Chew
Head Of Research
Phillip Securities Research Pte Ltd
20th July 2020
Phillip Securities Pte Ltd (A member of PhillipCapital) Co. Reg. No. 197501035Z © PhillipCapital 2020. All Rights Reserved. For internal circulation only.
Disclaimer: The information contained in this document is intended only for use during the presentation and should not be disseminated or distributed to parties outside the presentation.
Phillip Securities accepts no liability whatsoever with respect to the use of this document or its contents.Week 30 – Tactical Views Phillip Securities Pte Ltd (A member of PhillipCapital) Co. Reg. No. 197501035Z © PhillipCapital 2020. All Rights Reserved. For internal circulation only. Disclaimer: The information contained in this document is intended only for use during the presentation and should not be disseminated or distributed to parties outside the presentation. Phillip Securities accepts no liability whatsoever with respect to the use of this document or its contents.
COVID-19 Watch: Still rising globally…but not all

                                   COVID-19 New Daily Cases (7DMA)                                                                                                 COVID-19 New daily cases: CH, KR, Italy (7DMA)
  70,000                                                                                                                   250,000                1,800                                                                                             6,000
                                                                                                                                                                                         5,640
  60,000                                                                                                                                          1,600
                                                                                                                           200,000                                                                                                                  5,000
                                                                                                                                                  1,400
  50,000
                                                                                                                                                  1,200                                                                                             4,000
  40,000                                                                                                                   150,000
                                                                                                                                                  1,000
                                                                                                                                                                                                                                                    3,000
  30,000                                                                                                                   100,000                   800

  20,000                                                                                                                                             600                                                                                            2,000
                                                                                                                           50,000                    400
  10,000                                                                                                                                                                                                                                    196     1,000
                                                                                                                                                     200
          0                                                                                                                0
                                                                                                                                                        0                                                                                          0
                                                                                                                                                        21-Feb       13-Mar        3-Apr         24-Apr     15-May   5-Jun         26-Jun     17-Jul
                                                                                                                                                                                         China            S Korea    Italy - RHS
                                Large Economies                     United States                  World (RHS)

                                                                                                                                               Source: CEIC, WHO, PSR; *Large economies (Asia/Europe) - China, Germany, UK, Spain, Italy, France,
                                                                                                                                               Japan, S Korea
Phillip Securities Pte Ltd (A member of PhillipCapital) Co. Reg. No. 197501035Z © PhillipCapital 2020. All Rights Reserved. For internal circulation only.
Disclaimer: The information contained in this document is intended only for use during the presentation and should not be disseminated or distributed to parties outside the presentation.
Phillip Securities accepts no liability whatsoever with respect to the use of this document or its contents.
COVID-19 Watch: Singapore cases still contained
SG: Daily new Community
120
Circuit Breaker: 7 Apr
Phase 2: 19 June
Phase 1: 2 June
100
80
56
60
40
9
5
20
0
29-Jan-20 26-Feb-20 25-Mar-20 22-Apr-20 20-May-20 17-Jun-20 15-Jul-20
1 week before Daily Cases 7 Day Moving Average
Source: PSR, MOH
Phillip Securities Pte Ltd (A member of PhillipCapital) Co. Reg. No. 197501035Z © PhillipCapital 2020. All Rights Reserved. For internal circulation only.
Disclaimer: The information contained in this document is intended only for use during the presentation and should not be disseminated or distributed to parties outside the presentation.
Phillip Securities accepts no liability whatsoever with respect to the use of this document or its contents.Activity indicators – Singapore moving sideways
SG: Google Mobility Trend (7DMA) SG: Apple Mobility Trends (7DMA)
0 120
100
-20
80
-40 60
40
-60
20
-80 0
21-Feb 10-Mar 28-Mar 15-Apr 3-May 21-May 8-Jun 26-Jun 14-Jul 19-Jan 9-Feb 1-Mar 22-Mar 12-Apr 3-May 24-May 14-Jun 5-Jul
CB/Phase 1/Phase 2 Driving Transit
CB/Phase 1/Phase 2 Retail & recreation Workplaces
Source: https://www.google.com/covid19/mobility/
https://www.apple.com/covid19/mobility ;
Phillip Securities Pte Ltd (A member of PhillipCapital) Co. Reg. No. 197501035Z © PhillipCapital 2020. All Rights Reserved. For internal circulation only.
Disclaimer: The information contained in this document is intended only for use during the presentation and should not be disseminated or distributed to parties outside the presentation.
Phillip Securities accepts no liability whatsoever with respect to the use of this document or its contents.Activity indicators – United States starting to weaken
US: Google Mobility Trend (7DMA) US: Apple Mobility Trends (7DMA)
20
140
120
0
100
80
-20
60
-40 40
20
-60 0
2-Mar 20-Mar 7-Apr 25-Apr 13-May 31-May 18-Jun 6-Jul 19-Jan 9-Feb 1-Mar 22-Mar 12-Apr 3-May 24-May 14-Jun 5-Jul
Retail & recreation Workplaces Driving Transit
Source: https://www.google.com/covid19/mobility/
https://www.apple.com/covid19/mobility ;
Phillip Securities Pte Ltd (A member of PhillipCapital) Co. Reg. No. 197501035Z © PhillipCapital 2020. All Rights Reserved. For internal circulation only.
Disclaimer: The information contained in this document is intended only for use during the presentation and should not be disseminated or distributed to parties outside the presentation.
Phillip Securities accepts no liability whatsoever with respect to the use of this document or its contents.SG: Electronic exports rebound, construction doldrums
SG: Total and Electronic Exports SG: Construction demand (S$mn - T12M)
40%
40,000
20%
30,000
0%
20,000
-20%
-40% 10,000
2008 2010 2012 2014 2016 2018 2020 2007 2008 2010 2011 2013 2014 2016 2017 2019
NODX - 3MMA (YoY) Electronics - 3MMA (YoY) Contracts Awarded Contracts Billed
Source: CEIC, PSR
Phillip Securities Pte Ltd (A member of PhillipCapital) Co. Reg. No. 197501035Z © PhillipCapital 2020. All Rights Reserved. For internal circulation only.
Disclaimer: The information contained in this document is intended only for use during the presentation and should not be disseminated or distributed to parties outside the presentation.
Phillip Securities accepts no liability whatsoever with respect to the use of this document or its contents.Coronavirus Aid, Relief, and Economic Security Act (CARES Act) -$2.2t
Type US$bn Comment Outlook
Unemployme 260 Extended the duration (+13 weeks), expanded Likely extend but at Both parties want it:
nt benefit the eligibility and added $600 per week (to the lower amount (e.g.
Republicans because
(FPUC,PEUC,P typical half weekly wages) + end Jul20 $40k)
UA) completed
election year
Democrats because of
the social aid
One-Time 270 $1,200 for adults and $500 for every Reduce the income
payments child/dependent + maximum $6000/family + eligibility
earn less than $99k/year Coviod-19 still raging
and economy at risk
Paycheck 670 Small busines loans/grants + cover 2.5 months Lower the employee
Protection of payroll cost (up to $10mn) + turn to grant if cap to 100 staff Expectations is $1tr
Program proceeds cover payroll, rent, etc + less than stimulus
(PPP) 500 employees to be eligible
Extend current aid
State 150 States need to balance their budget. Current Large rift between programmes
Assistance huge revenue shortfall has led layoffs and both parties
furloughs.
Source: Media, FPUC (Federal Pandemic Unemployment Compensation)
Phillip Securities Pte Ltd (A member of PhillipCapital) Co. Reg. No. 197501035Z © PhillipCapital 2020. All Rights Reserved. For internal circulation only.
Disclaimer: The information contained in this document is intended only for use during the presentation and should not be disseminated or distributed to parties outside the presentation.
Phillip Securities accepts no liability whatsoever with respect to the use of this document or its contents.Disclaimer The information provided in this seminar is solely for educational purposes and should not be considered as financial advice. The views, statements and opinions expressed in this seminar are solely the views, statements and opinions of the presenter made in his/her personal capacity and do not represent the views, statements or opinions of nor are they made on behalf of Phillip Securities Pte Ltd (PSPL). The information contained in this presentation has been obtained from public sources which PSPL has no reason to believe are unreliable and any analysis, forecasts, projections, expectations and opinions (collectively the “Research”) contained in this presentation are based on such information and are expressions of belief only. PSPL has not verified this information and no representation or warranty, express or implied, is made that such information or Research is accurate, complete or verified or should be relied upon as such. Any such information or Research contained in this presentation is subject to change, and PSPL shall not have any responsibility to maintain the information or Research made available or to supply any corrections, updates or releases in connection therewith. In no event will PSPL be liable for any special, indirect, incidental or consequential damages which may be incurred from the use of the information or Research made available, even if it has been advised of the possibility of such damages. This presentation is intended for general circulation only and does not take into account the specific investment objectives, financial situation or particular needs of any particular person. You should seek advice from a financial adviser regarding the suitability of the investment products mentioned, taking into account your specific investment objectives, financial situation or particular needs, before making a commitment to invest in such products. Phillip Securities Pte Ltd (A member of PhillipCapital) Co. Reg. No. 197501035Z © PhillipCapital 2020. All Rights Reserved. For internal circulation only. Disclaimer: The information contained in this document is intended only for use during the presentation and should not be disseminated or distributed to parties outside the presentation. Phillip Securities accepts no liability whatsoever with respect to the use of this document or its contents.
You can also read