Pharmaceutical Payment Methods, 2013 Update - amcp guide to - version 3.0
←
→
Page content transcription
If your browser does not render page correctly, please read the page content below
amcp guide to

     Pharmaceutical Payment Methods,
              2013 Update

  version 3.0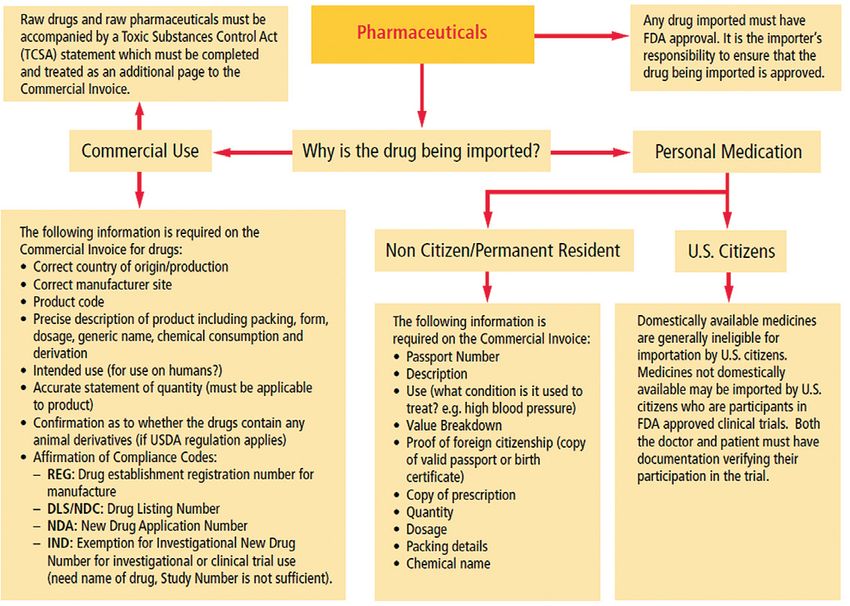
amcp guide to

Pharmaceutical Payment Methods,
         2013 Update

            version 3.0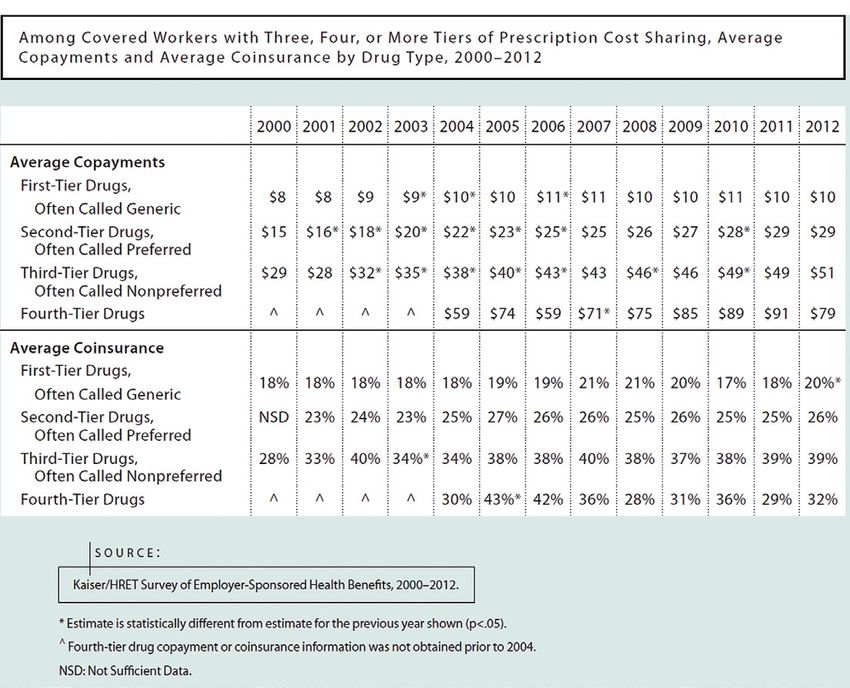
A M C P G u i d e t o P h a r mac e u t i ca l Pa y m e n t M e t h o d s , 2 0 1 3 U p d at e

                                                         about this publication

NOTE THIS MATERIAL EDITED FOR 2013. This is an update                   Author Disclosures: Howard Tag, JD, and Elan Rubinstein,
of the October 2009 AMCP Guide to Pharmaceutical Payment                PharmD, MPH, provide consulting services to clients that include
Methods which was created by the Academy of Managed Care                professional associations, health plans, purchasers, regulators,
Pharmacy Task Force on Pharmaceutical Payment Methods in                providers, pharmaceutical, biological and medical device
conjunction with the consulting firm of Tag & Associates, Inc. The      manufacturers, and other health care entities.
update incorporates revisions by Tag & Associates, Inc. (lead author:
Elan Rubinstein, PharmD, MPH. editor: Howard Tag, JD, production        About AMCP:           AMCP is a national professional association of
services: Debra Glover), Alexandria, VA. The Academy wishes to          pharmacists and other health care practitioners who serve society
thank the following reviewers for their valuable input:                 by the application of sound medication management principles
                                                                        and strategies to improve health care for all. The Academy’s nearly
                         Tom Bizzaro, RPh
                                                                        7,000 members develop and provide a diversified range of clinical,
        Vice President, Health Policy and industry Relations,           educational, and business management services and strategies on
                         First Databank, Inc.                           behalf of the more than 200 million Americans covered by a managed
                                                                        care pharmacy benefit. For more information about AMCP, visit
                      Loreen M. Brown, MSW                              www.amcp.org.
           Senior Vice President, Commercial Consulting
           XcendaAmerisourceBergen Consulting Services

                    Rob Coppola, PharmD, MBA
    Senior Director, Business Development, Magellan Pharmacy
                              Solutions

                      Dan Hardin, RPh, MBA
    Segment President, Public Sector and Pharmacy Technology
                      Solutions, Catamaran

                            Phil Lettrich
                 Director of Professional Relations,
                    Emdeon Business Services

                            Chuck Reed
    Group Vice President, Pharmacy Technology and Solutions,
                    AmerisourceBergen Corp.

                                              Academy of Managed Care Pharmacy | 2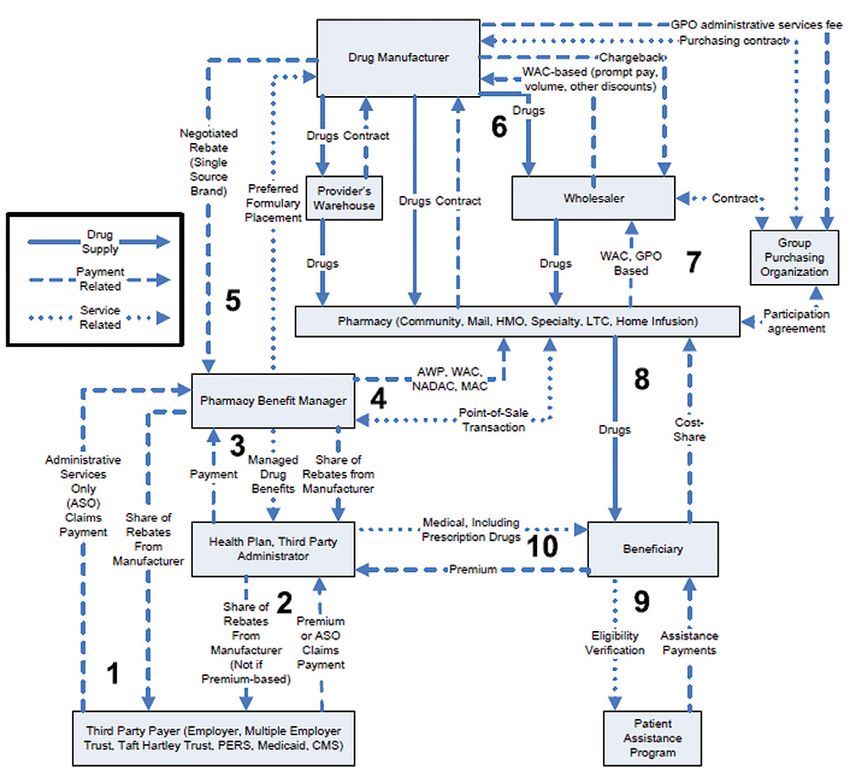
A M C P G u i d e t o P h a r mac e u t i ca l Pa y m e n t M e t h o d s , 2 0 1 3 U p d at e
table of contents
Executive Summary............................................................ 5 Comparison of Benchmark Prices .....................................27
Highlights....................................................................6 Exhibit II-2. Estimated Prices Paid to Manufacturers,
Payment Benchmarks.........................................................6 Relative to List Price (AWP), for Brand-Name Drugs
Under Selected Federal Programs, 2003.....................27
Average Wholesale Price and Wholesale
Acquisition Cost ........................................................6 Benchmarks and the Goal of Appropriate Payment .........27
Average Sales Price ......................................................7
III. PAYERS AND PAYMENT METHODS.............................. 29
Average Manufacturer Price ...........................................7
Medicare........................................................................29
Federal Upper Limit ......................................................8
Background................................................................29
Best Price.....................................................................8
Medicare’s Influence on Prescription Drug Payment.........29
Maximum Allowable Cost or Maximum
Reimbursement Amount.............................................8 Hospital Outpatient Departments .................................29
National Average Retail Price and National Physician Offices.........................................................29
Average Drug Acquisition Cost.....................................8 Pharmacy-Dispensed Medicare Part B Drugs..................29
Public Health Service 340 B Price...................................9 Pharmacy-Dispensed Medicare Part D Drugs..................30
Payers and Payment Methods .............................................9 Exhibit III-1. Sources of Medicare Beneficiary Drug
Medicare .....................................................................9 Coverage, 2010.......................................................30
Medicaid ...................................................................10 Exhibit III-2. Standard Medicare Drug Benefit, 2012 ......30
Private Purchasers.......................................................10 Exhibit III-3. Brand-Name Prescription Drug Savings
Recent Pharmaceutical Payment Milestones...................12 in the Coverage Gap ................................................31
Table I. Pharmaceutical Payment Milestones: Exhibit III-4. Generic Drug Savings in the
2005–2013 ...........................................................12 Coverage Gap..........................................................31
Medicare Payment to PDPs .........................................31
I. INTRODUCTION............................................................ 17 Exhibit III-5. Aggregate Part D Reimbursement
Exhibit I-1. Milliman Medical Index Annual Rate of Amounts, CY 2013..................................................32
Increase in Costs by Component of Medical Care.........17 Exhibit III-6. Part D Risk Corridors for 2013...................32
Exhibit I-2. Monthly and Median Costs of Cancer Drugs PDP Report to CMS of “Lock-In-Price” Versus
at the Time of Approval by the FDA, 1965–2008 .......17 “Pass-Through Price”............................................33
Pharmaceutical Manufacturer Price Negotiations........33
II. PAYMENT BENCHMARKS ............................................ 19
Part B vs. Part D.....................................................33
Benchmarks....................................................................19
Protected Therapeutic Classes..................................33
Average Wholesale Price .............................................19 Least Costly Alternative (LCA).......................................33
Wholesale Acquisition Cost...........................................20 Home Health and Home Infusion..................................34
Average Sales Price.....................................................20 Exhibit III-7. Medicare Fee-For-Service Coverage for
Average Manufacturer Price..........................................21 Home Infusion.........................................................34
Exhibit II-1. Components of AMP Calculation..................22 Exhibit III-8. Medicare Payment Rates For Drug
Exhibit II-2. Example of Average Manufacturer Prices Infusion by Treatment Setting....................................35
For Oral Solid Generic Drugs, For August 2012...........23 Medicaid Background.......................................................36
Federal Upper Limit.....................................................24 Dual Eligibles (Medi/Medi)...........................................37
Best Price ..................................................................24 Retail Community Pharmacy Reimbursement.................37
Maximum Allowable Cost or Maximum Reimbursement Rebates.....................................................................37
Amount .................................................................25 Private purchasers...........................................................38
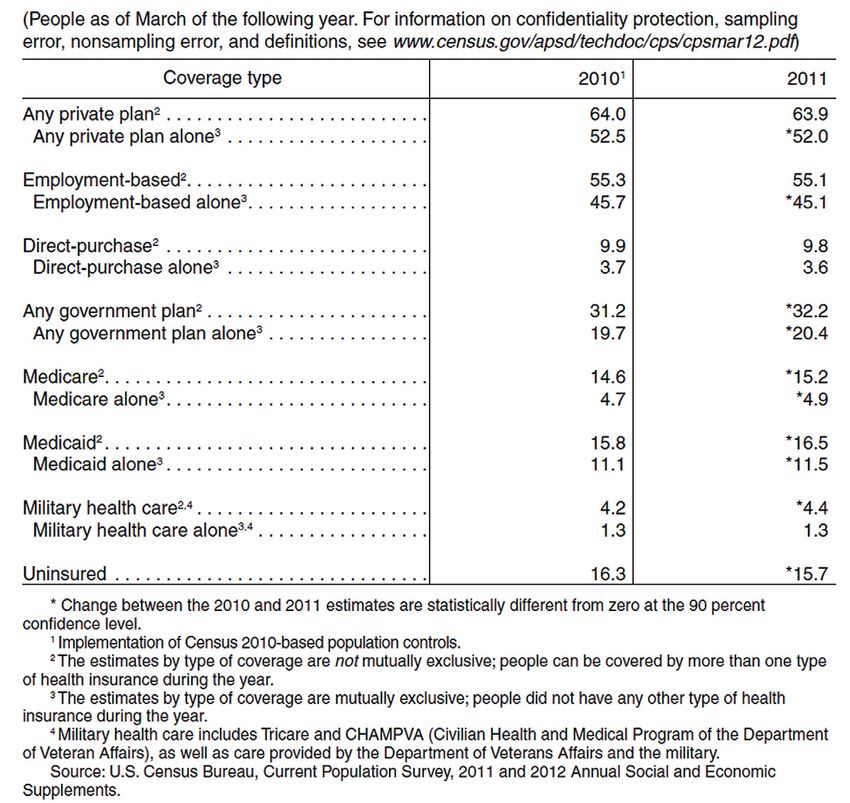
National Average Retail Price and National Average Structure of Privately Sponsored Health Coverage............38
Drug Acquisition Cost ..............................................25 Exhibit III-9. Coverage by Type of Health Insurance,
340B........................................................................26 2010 and 2011......................................................39
Academy of Managed Care Pharmacy | 3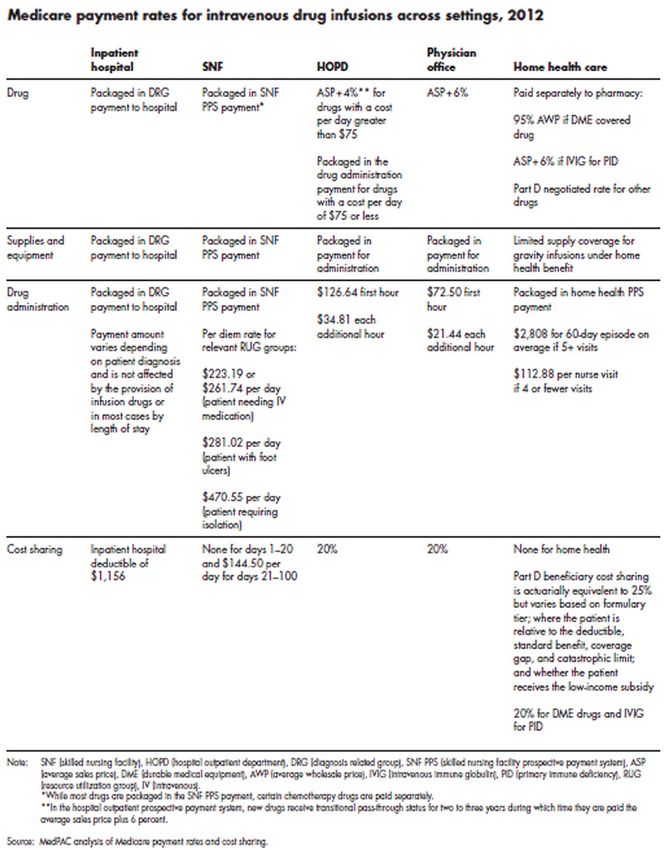
A M C P G u i d e t o P h a r mac e u t i ca l Pa y m e n t M e t h o d s , 2 0 1 3 U p d at e

                                                                     table of contents

Benefit Design ...........................................................40      IV. HOW PRODUCTS, SERVICES, AND PAYMENTS FLOW
Drugs Assigned to the Medical Benefit vs. Pharmacy                                  THROUGH CHANNELS OF DISTRIBUTION .................... 52
  Benefit....................................................................40         Exhibit IV-1. Pharmacy Benefit (Other Than Medicare
Exhibit III-10. Medical Benefit Cost Sharing for Specialty                                Prescription Drug Benefit) ........................................52
  Drugs.....................................................................40          Exhibit IV-2. Medicare Prescription Drug Benefit .............53
Exhibit III-11. Pharmacy Cost Trends.............................40
Exhibit III-12. Specialty Drugs in the Drug Development                           V. ISSUES AND IMPLICATIONS FOR STAKEHOLDERS ....... 56
  Pipeline, and Projected Impact of Specialty Drugs                                 No Clear Successor to the AWP Benchmark .......................56
  on Drug Spend........................................................41               Issue ........................................................................56
Exhibit III-13. Medical and Pharmacy Benefit                                            Implications ...............................................................56
  Coverage by Drug Administration Type........................42                    Bundling (Combining) Drugs with Services.........................57
Use of Formularies .....................................................41              Issue ........................................................................57
Exhibit III-14. Prescription Drug cost Sharing Among                                    Implications ...............................................................58
  Covered Workers .....................................................43           Pricing Transparency: Is It Meaningful?...............................58
Exhibit III-15. Cost Sharing For Medicare Part D Plans                                  Issue........................................................................ 58
  2006–20012, and Employer-Sponsored                                                    Implications ...............................................................58
  Plans, 2012 ...........................................................44         How Significant Will be Biosimilars’ Market Impact..............58
Traditional and Transparent Pricing................................43                   Issue.........................................................................58
Class of Trade ............................................................44           Implications ...............................................................59
Exhibit III-16. Example of Pharmaceutical Classes                                   PBM Dilemma: Challenges in the Face of Generic
  of Trade..................................................................45       Prescription Clubs and Copay Coupons ..........................59
Prescription Drug Rebates ...........................................44                 Issue ........................................................................59
Importation and Reimportation of Pharmaceuticals .........46                            Implications ...............................................................59
Exhibit III-17. Shipper’s Customer Guidance for                                     High Deductible Plan Cost Shift to the Beneficiary...............59
  Pharmaceuticals Importation.....................................46                    Issue ........................................................................59
Patient Expenditures for Pharmaceuticals.......................46                       Implications ...............................................................59
Drug Copay Coupons and Copy Cards............................47                     Role of Comparative-Effectiveness Research Findings to
                                                                                      Structure Drug Benefits and Manage Drug Access ............60
Relationship of Provider to Payment Method...................47
                                                                                        Issue ........................................................................60
Community Pharmacy.................................................47
                                                                                        Implications ...............................................................60
Exhibit III-18. Pharmacy Discounts and Dispensing
                                                                                    Will Pharmaceutical Manufacturers Accept Risk for Desired
  Fees by Pharmacy Channel ......................................48
                                                                                     Therapeutic Outcomes From use of Their Products............61
Exhibit III-19. Drug Utilization per 1 Million Health                                   Issue ........................................................................61
  Plan Lives by Site of Service .....................................49
                                                                                        Implications................................................................61
Exhibit III-20. Private Sector ASP-based Physician                                  Orphan and Ultra-Orphan Drugs........................................61
  Reimbursement for Office-Administered Infusible and
                                                                                        Issue ........................................................................61
  Injectable Drugs.......................................................49
                                                                                        Implications................................................................61
Exhibit III-21. Private Sector AWP-based Physician
                                                                                    How Will Greater Use of Pharmacogenomics Affect
  Reimbursement for Office-Administered
                                                                                     Drug Pricing ................................................................62
  Infusible and Injectable Drugs...................................50
                                                                                        Issue.........................................................................62
Exhibit III-22. Predominant Reimbursement
  Methodology in the Physician-Office Setting................51                         Implications................................................................62

Exhibit III-23. Specialty Pharmacy Distribution to
                                                                                  VI. ACRONYM LIST.......................................................... 78
  Physician Office.......................................................51
Hospital Inpatient and Outpatient .................................48
                                                                                  VII. GLOSSARY................................................................ 83
Physician Office Drugs.................................................49
Home Health..............................................................50       viii. REFERENCES........................................................... 96

                                                  Academy of Managed Care Pharmacy | 4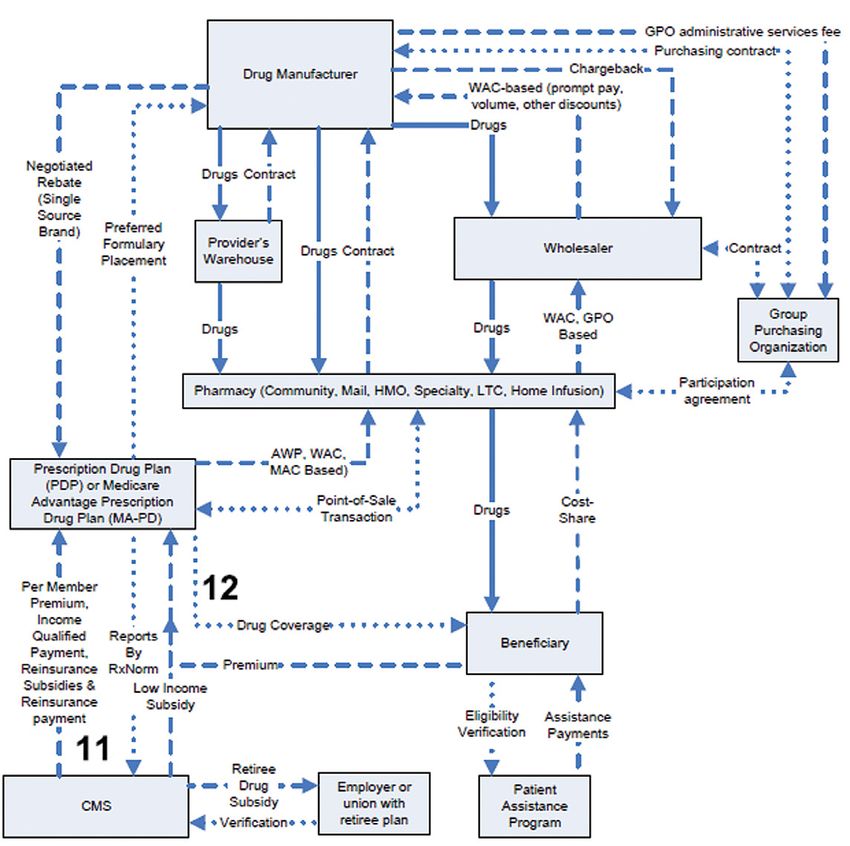
A M C P G u i d e t o P h a r mac e u t i ca l Pa y m e n t M e t h o d s , 2 0 1 3 U p d at e

                                                        Executive Summary

Executive Summary                                                       17.1% of AMP for blood clotting factors, all per unit or the
                                                                        difference between the AMP and the best price per unit and
The methods by which the U.S. health care system pays for               adjusted by the Consumer Price Index-Urban (CPI-U) based
prescription drugs are changing because of                              on launch date and current quarter AMP.
•   Growth of healthcare as a percentage of GDP.                    •   Cap on total rebate amount for innovator drugs to 100%
•   Healthcare reform (The Patient Protection and Affordable Care       of the AMP
    Act, known as PPACA).                                           •   Additional Medicaid Line Extension rebates for oral solid
•   Payer demands for price transparency.                               dosage forms of single source or innovator multiple source
                                                                        drugs (e.g., new formulations such as extended release).
•   Increasing cost sharing by patients.
                                                                    •   Extended Medicaid rebates to cover Medicaid patients in
•   The belief by many stakeholders that prescription drug prices       managed care organizations.
    and price increases should be moderated.
                                                                    •   A new formula for calculating the Federal Upper
•   Increasing Generic Dispensing Rates.                                Reimbursement Limit (FUL)
•   Increase in specialty pharmaceuticals on the market, their      •   New definitions of AMP and multiple source drug.
    increasingly high cost per course, and increasing specialty
    pharmacy penetration and utilization (in both the pharmacy      •   Expanded eligibility for Public Health Service 340B
    and medical benefit).                                               discounts.

•   Undisclosed prescription drug rebates and discounts which       •   An FDA approval pathway for biosimilar biological
    may differ by type of purchaser.                                    products and Medicare Part B payment that would
                                                                        incentivize their use.
    The current debate about prescription drug payment methods
centers on determining the most appropriate basis for calculating       Private payers have followed the government’s lead but
how payers, including patients, government agencies, employers,     have not aggressively ventured out on their own to change their
and health plans, should pay pharmacies and other providers         payment methods and benchmarks. As of the publication date
for dispensing prescription drugs and providing pharmaceutical      of this Guide, AWP and manufacturer-determined Wholesale
services. Historically, payment for prescription drugs has been     Acquisition Cost (WAC) remain widely used payment benchmarks
based on published prices that do not necessarily reflect the       for private insurance reimbursement to pharmacies, physicians,
actual acquisition costs paid by providers, primarily pharmacies,   and other providers. It is unclear how replacement of the AWP
physicians, and hospitals. This has led policymakers to believe     benchmark might affect provider payment for two reasons: (a) no
that Medicare and Medicaid programs have paid more than             widely available alternative benchmark has been selected, and
is necessary for prescription drugs. The reality is much more       (b) pharmacy benefit manager contracts with network pharmacies
complex, confounded by the two necessary components of a            often include language to adjust payment under any new
reimbursement formula: estimated ingredient cost and dispensing     benchmark to maintain comparable pricing to the AWP standard.
fee. Currently, reimbursement of the ingredient cost often          Despite the pushback on using AWP, this much-maligned
subsidizes the dispensing fee, which can be confusing and which     benchmark continues to be available from a variety of sources.
may generate calls for more transparency.                               Bundling of outpatient prescription drugs into payment for
                                                                    selected diagnoses and procedures is being tried on an expanded
    Thus, in an effort to reform the payment system and reduce
                                                                    basis by Medicare for renal dialysis, hospice and on a limited,
drug expenditures, policymakers have made significant and
                                                                    voluntary basis with Integrated Delivery Networks and some
proposed changes to the benchmarks used by public programs to
                                                                    private payers. However, the tradition for outpatient treatment
pay for drugs, and, in some cases, have created new benchmarks
                                                                    continues to be that drugs are a pass-through cost to be charged
altogether.
                                                                    at the providers’ actual or estimated acquisition price plus a
   Federal government activity to reduce drug expenditures via      pre-determined markup.
payment system changes was a component of healthcare reform.
                                                                       The U.S. drug purchasing and distribution system is
PPACA included these changes that impact drug payment and           complex and involves multiple transactions among myriad of
payment methodologies:                                              stakeholders, including drug manufacturers, distributors, Group
•   Increased minimum Medicaid drug rebates to 23.1% of the         Purchasing Organizations, government entities, third-party
    Average Manufacturer Price (AMP) for single source drugs,       payers, pharmacies (retail, mail order, specialty), pharmacy
    13% of AMP for non-innovator multiple source drugs, and         benefit managers, physicians, and patients. Changes in

                                            Academy of Managed Care Pharmacy | 5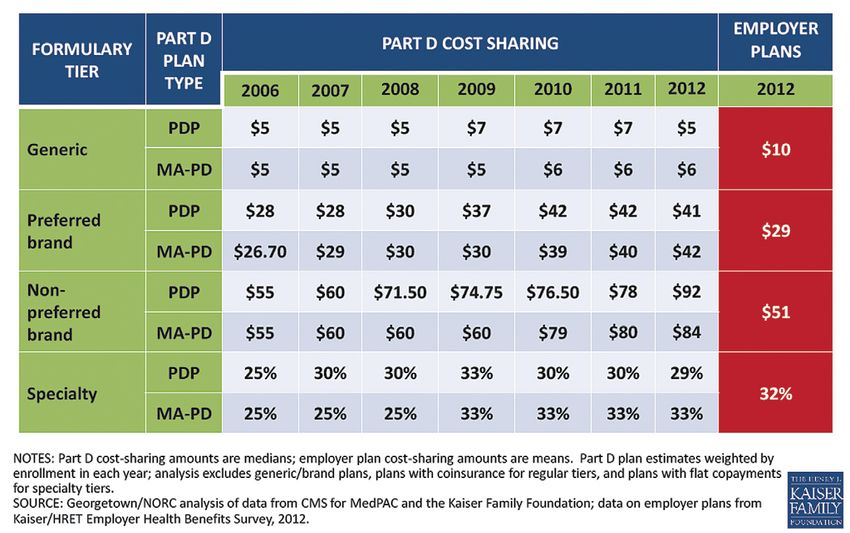
A M C P G u i d e t o P h a r mac e u t i ca l Pa y m e n t M e t h o d s , 2 0 1 3 U p d at e

                                                           Executive Summary

payment methods or benchmarks, and laws impacting pricing             by private payers, and the relationship of these factors to the
to government entities and government-specified entities,             availability of rebates from drug manufacturers.
have significant implications for all stakeholders, affecting
the payments and prices to and from each of these groups.             How Products, Services, and Payments Flow Through Channels
Knowledge of the intricate distribution and payment systems for       of Distribution. Section IV provides a detailed analysis of
prescription drugs is essential to ensure that payment reform         how drugs are purchased, distributed, and paid for by various
results in desired outcomes including fair and equitable payment      entities within the pharmaceutical supply chain in the U.S. The
to providers while avoiding unintended consequences such as           purpose of this section is to examine the complexity of the drug
reduced access to medically necessary drugs.                          distribution system as well as the multiple direct and indirect
                                                                      transactions that occur.
   AMCP recognizes the need to help stakeholders and
policymakers better understand, evaluate and navigate the             Select Issues and Implications for Stakeholders. Section V
profound changes occurring in payment for prescription drugs in       explores the issues and implications of the most significant
the United States. This 2013 update to the 2009 AMCP Guide            changes to drug payment methods or benchmark prices that
to Pharmaceutical Payment Methods1 offers a comprehensive             have been proposed or implemented in recent years. The topics
examination of the methods and price benchmarks that have been        evaluated in this section include actual acquisition cost (AAC)
used in the public and private sector to pay for pharmaceuticals in   and the surveys used to determine NADAC and NARP; the use
the United States, the changes that have occurred or are likely to    of weighted average AMP for calculation of federal upper limit
occur in the future, and the forces that are behind these changes.    (FUL); the implications of ASP+6% payment under Medicare
AMCP has made every effort to make the Guide an unbiased              Part B; pricing transparency; the role of comparative-effectiveness
presentation of information, issues, and implications.                research; orphan drugs; and bundling of provider payment for
    Following the introduction (Section I), the Guide is presented    prescription drugs with payment for other related services.
in four main sections covering the following subject areas:
                                                                      Highlights
Payment Benchmarks. Section II explains the drug payment
                                                                      The following are discussed in this Guide. Please refer to the
benchmarks that have come into use over the past four decades,
                                                                      corresponding section in the Guide for a more detailed discussion
how and when they are used, and how they compare to one
                                                                      of trends in drug pricing and payment.
another. The benchmarks discussed in detail are those that
have the greatest overall impact on pharmaceutical payment
or are currently receiving the most scrutiny and discussion,          nn    Payment Benchmarks
including average wholesale price (AWP), average sales price          Health plans cover pharmaceuticals under the “medical benefit”
(ASP), average manufacturer price (AMP), wholesale acquisition        (typically drugs administered in a medical office or clinic setting,
cost (WAC), maximum allowable cost (MAC) also referred to as          or administered through home health), and the “pharmacy
maximum reimbursement amount (MRA), federal upper limit               benefit” (typically drugs dispensed by a retail, mail order or
(FUL), national average retail price (NARP), and national average     specialty pharmacy). Pharmaceuticals covered under the medical
drug acquisition cost (NADAC).                                        benefit and/or the pharmacy benefit component of a health plan
                                                                      typically have differing payment methods and use different pricing
Payers and Payment Methods. Section III describes payment             benchmarks.
methods used by payers as well as manufacturers’ price
concessions related to product preference and acquisition             Average Wholesale Price and Wholesale
across various settings of care such as community pharmacy,
                                                                      Acquisition Cost
mail service pharmacy, physician offices, clinics and
hospitals. Discussed in this Guide are: Public payers such as         Historically, AWP has been the generally accepted drug payment
Medicare, Medicaid, the Department of Defense, the Veterans           benchmark for most payers, primarily because it is current
Administration, and the Public Health Service’s 340B program;         and readily available. However, in recent years AWP became
private payers such as commercial insurers, self-funded               recognized as a “sticker price” that does not reflect the average
employers and individual patients; intermediaries including           wholesale price ultimately paid after subtraction of undisclosed
managed care organizations and pharmacy benefit managers;             price concessions.
and providers such as hospitals, physicians, pharmacies and              AWP is related to WAC, although not by a standard multiplier.
home health providers. Also covered are topics relevant to private    Historically, the relationship of AWP to WAC has been most
health insurance, including benefit design, the use of formularies    commonly, though not always, characterized by one of the

                                             Academy of Managed Care Pharmacy | 6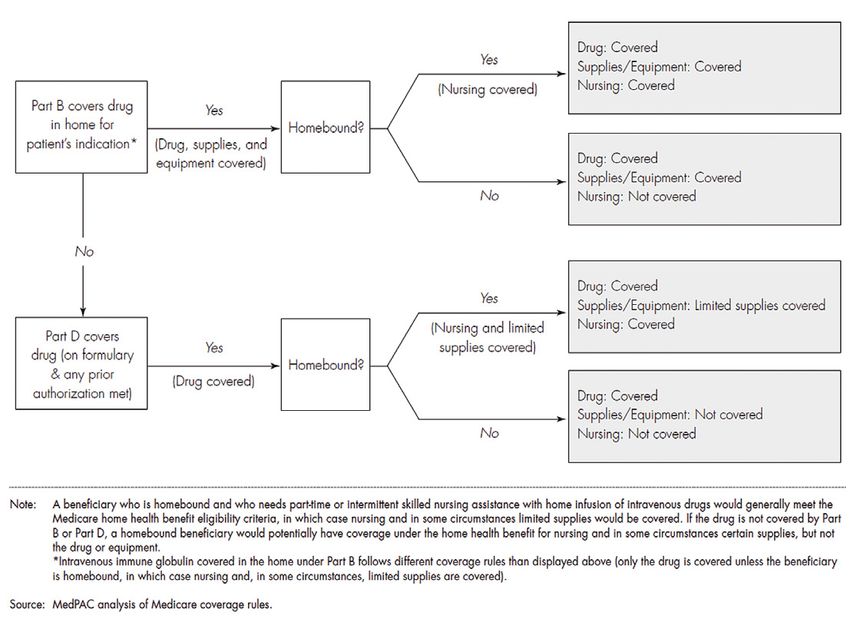
A M C P G u i d e t o P h a r mac e u t i ca l Pa y m e n t M e t h o d s , 2 0 1 3 U p d at e

                                                           Executive Summary

following equations, as determined by the publisher: AWP = 1.20        Average Sales Price
x WAC, or AWP = 1.25 x WAC for branded pharmaceuticals.
                                                                       As a result of the 2003 Medicare Prescription Drug, Improvement,
While multiple source generic drugs may have WACs from which
                                                                       and Modernization Act (MMA) (Public Law 108-173), ASP
AWPs can be calculated, their reimbursement is typically based
                                                                       replaced AWP as the basis for payment for most drugs covered
instead on maximum allowable cost.
                                                                       under Medicare’s medical benefit—Medicare Part B—as of
    However, WAC is not reflective of an actual acquisition cost for   January 1, 2005. Unlike AWP, ASP is based on manufacturer-
a wholesaler, because the WAC does not include discounts and           reported actual selling price data and includes the majority of
price concessions that are offered by manufacturers. For sole-         rebates, volume discounts, and other price concessions offered
source branded pharmaceuticals, WAC more closely approximates          to all classes of trade (excluded from the calculation of ASP are
the price that pharmacies pay to manufacturers or wholesalers          all sales that are exempt from “best price” and sales at “nominal
than does AWP and, for this reason, often serves as the basis for      price” [see Glossary]).
discounts and rebates negotiated between manufacturers and
                                                                          Because ASP is a volume-weighted average, some providers
private payers (i.e., discounts and rebates are typically based on
                                                                       are able to obtain pharmaceuticals below this average selling
WAC) for both medical and pharmacy benefit drugs. Manipulation
                                                                       price, while others are able only to purchase the drugs at a price
of the so-called “spread” or differential between WAC and
                                                                       that is above the average. ASP prices are based on manufacturer-
AWP has been the subject of lawsuits against pharmaceutical
                                                                       submitted data that is two quarters in arrears, and do not include
manufacturers and publishers alleging “gross inflation” of AWP
                                                                       subsequent pricing changes. In general, small physician offices
for certain drugs and has led to the discontinuation of publishing
                                                                       and regional specialty pharmacies buy small quantities at the
or to a dramatic overhaul of its ‘definition’ by the remaining
                                                                       least favorable prices and are unable to purchase some drugs at
publishers of this widely used benchmark.
                                                                       prices at or below the ASP prices or ASP-based payment amounts.
    Recognition of the unreliability of AWP (or of its continued       Generally, large physician groups and hospitals are able to
availability) as a benchmark of real-world prices actually paid        negotiate the best discounts and price concessions and are better
by pharmacies and other purchasers, including physicians, has          positioned under the ASP payment system.
precipitated the search for other reference prices for payment
                                                                          From a payer perspective, ASP can also create misaligned
purposes. The uncertainty of AWP as a basis for payment for
                                                                       incentives to dispense higher cost drugs due to a flat 6% mark-
pharmaceuticals in the United States became an issue for
                                                                       up in Medicare Part B (larger mark-ups are applied by some
all stakeholders on March 17, 2009, with the decision by
                                                                       commercial health plans), when less expensive alternatives exist.
U.S. District Court Judge Saris on the proposed settlement in
                                                                       Some commercial health plans have implemented a tiered mark-
the two national class action lawsuits against First Databank
                                                                       up on ASP, varying with compliance to health plan prescribing
and McKesson. This decision resulted in the roll-back of the
                                                                       policies (for example, Blue Shield of California Professional fee
multiplier used to calculate AWP. The WAC multiplier of 1.25 (or
                                                                       Schedule. See: https://www.blueshieldca.com/provider/claims/fee-
greater than 1.20) was reduced to 1.20 for the 1,442 National
                                                                       schedules/home.sp).
Drug Code (NDC) numbers referenced in the lawsuit, effective
September 26, 2009, under order of the court in acceptance             Average Manufacturer Price
of the proposed settlement. First Databank, an independent
                                                                       Congress created Average Manufacturer Price (AMP) as part of the
commercial publisher of drug pricing information, announced
                                                                       Omnibus Budget Reconciliation Act (OBRA 1990) for the purpose
that it would discontinue publication of AWP no later than 2
                                                                       of calculating rebates to be paid by manufacturers to states for
years following implementation of the recalculated AWPs—and
                                                                       drugs dispensed to their Medicaid beneficiaries. AMP was defined
has done so. Medi-Span made a similar announcement at the
                                                                       as the price available to the retail class of trade and reflected
time, but ultimately reversed that decision, announcing that it
                                                                       discounts and other price concessions afforded those entities. The
will continue to publish AWP until there is a generally accepted
                                                                       Deficit Reduction Act of 2005 (DRA) mandated that AMP instead
alternative.2 Truven Healthcare, publisher of Redbook, and
                                                                       of AWP be used for the calculation of the FUL.
Elsevier, publisher of Gold Standard (ProspectoRx) continue to
publish AWP as of the publication date of this Guide.                     Like ASP, AMP represents an effort by the federal government
                                                                       to step away from AWP to an alternate benchmark price. In
    While several independent publishers have proposed
                                                                       2003, the AMP approximated 79% of AWP for brand name drugs
alternative pricing benchmarks, at the time of this publication, no
                                                                       with no generic equivalents. The Congressional Budget Office
comprehensive, transparent, and widely acceptable alternative to
                                                                       (CBO) estimated that the acquisition cost to retail pharmacies
AWP has been identified.
                                                                       averages approximately 4% above the AMP for brand name drugs
                                                                       without generic equivalents.3

                                             Academy of Managed Care Pharmacy | 7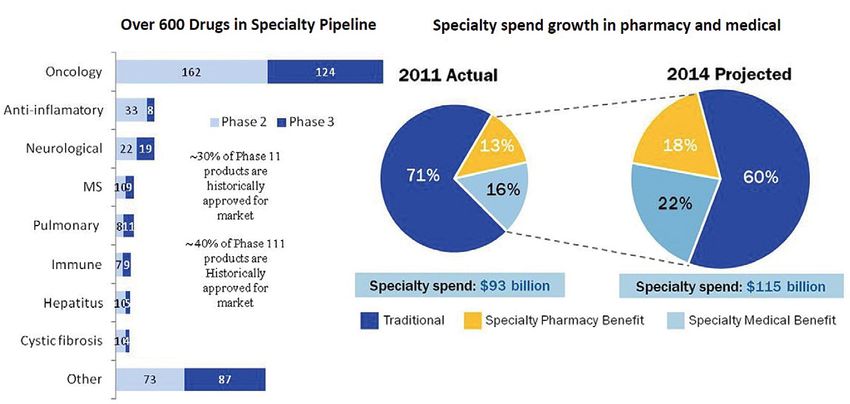
A M C P G u i d e t o P h a r mac e u t i ca l Pa y m e n t M e t h o d s , 2 0 1 3 U p d at e

                                                          Executive Summary

   In March 2010, the Patient Protection and Affordable Care Act     the draft methodology used to calculate the FULs.7, 8 Because
(PPACA, PL 111-148) changed the definition of AMP, to represent      posted monthly AMP-based FULs fluctuated significantly month-
the average price paid to the manufacturer by wholesalers for        to-month, CMS created an alternative methodology based on
drugs distributed to retail community pharmacies and by retail       a rolling 3-month average of the monthly AMP-based FULs.9
community pharmacies that purchase drugs directly from the           However, the monthly and three month rolling average FUL files
manufacturer. PPACA excluded certain payments and rebates            do not exactly match, because CMS does not have three months
or discounts provided to certain providers and payers from           of data for all drugs, and because the older data may be less
calculation of AMP, including wholesaler customary prompt            reflective of pharmacies’ current purchase price. As of publication
pay discounts, certain bona fide services fees, manufacturer         of this Guide, these results are posted on the CMS website for
reimbursement for unsalable returned goods, and payments,            review and comment.10 Until the draft is finalized, CMS is using
rebates or discounts related to entities that do not conduct         the prior formula of 150% of the lowest published price as an
business as a wholesaler or retail community pharmacy.               “interim methodology” to calculate FULs.4

Federal Upper Limit                                                  Best Price
The Deficit Reduction Act of 2005 (DRA) mandated that AMP            Medicaid best price was created by OBRA 90 and took effect
instead of AWP be used for the calculation of the federal upper      January 1, 1991 in the calculation of rebates that manufacturers
limit (FUL), the maximum amount of pharmacy reimbursement            are required to pay to the states and the federal government for
for product costs for certain generic and multiple-source drugs      sales of single-source and multiple-source branded products to
that the federal government will recognize in calculating federal    Medicaid beneficiaries. According to a Congressional Budget
matching funds for payment to state Medicaid programs. That          Office (CBO) report published in June 2005, best price for brand-
is, Federal Medicaid matching funds to states are limited to         name drugs approximates 63% of AWP.
payments that do not exceed the FUL in the aggregate for
multiple-source drugs, plus a dispensing fee set by each state.      Maximum Allowable Cost or Maximum
The FUL list is created and maintained by CMS for use by states      Reimbursement Amount
in their Medicaid Pharmacy programs, but it is also in the public
                                                                     Maximum allowable cost (MAC), also referred to as maximum
domain for use by any entity.
                                                                     reimbursement amount (MRA) is typically a reimbursement limit
   Effective October 1, 2010, PPACA revised the Social               per individual multiple-source pharmaceutical, strength and
Security Act to require HHS to calculate the FUL as no less          dosage form. MAC price lists are established by health plans and
than 175 percent of the weighted average (determined on              PBMs for private sector clients and by many states for multiple-
the basis of utilization) of the most recently reported monthly      source pharmaceuticals paid for by their Medicaid and other state-
average manufacturer price (AMP) for pharmaceutically and            funded programs. Private sector MACs usually are considered
therapeutically equivalent multiple source drug products that        confidential. While clearly defined in FUL for Medicaid, there is no
are available for purchase by retail community pharmacies on         standardized private sector definition, methodology, update timing
a nationwide basis. In a study published October 2012, the           or market application for MAC.
Office of Inspector General reported that FUL amounts based             Medicaid generic drug cost containment in some states is built
on published prices were more than four times total pharmacy         around MAC programs. Those state Medicaid programs create
acquisition costs; and that AMP-based FULs were 61% lower            their own lists of maximum reimbursement prices for generic
than published price-based FULs at the median.4                      drugs. As a general rule, state MAC lists include more drugs and
   CMS has proposed that FUL be a unit price calculated for          establish lower reimbursements than the FUL list because they
each multiple source drug for which the FDA has rated three or       are not bound by the FUL three-drug/three-supplier rule, nor by
more products therapeutically and pharmaceutically equivalent,       the FUL payment methodology. For a drug on the FUL list, the
meaning A-rated in the FDA Orange Book.5 “Initially a FUL will       state MAC can be lower but not higher than the FUL.
not be published for any FUL group that does not contain at least
three innovator and/or non-innovator drug products at the NDC-9      National Average Retail Price and National
level, that are “A rated” with three monthly AMP prices with AMP     Average Drug Acquisition Cost
units greater than zero reported and certified by manufacturers to   State Medicaid programs currently reimburse pharmacies for
calculate the weighted average of monthly AMPs.”6                    covered outpatient drugs based, in part, on the estimated
    CMS has issued draft AMP-based FUL reimbursement files           acquisition cost (EAC), the agency’s best estimate of the price
for review and comment, for multiple source drugs, including         generally and currently paid by providers for a drug marketed or

                                            Academy of Managed Care Pharmacy | 8
A M C P G u i d e t o P h a r mac e u t i ca l Pa y m e n t M e t h o d s , 2 0 1 3 U p d at e

                                                           Executive Summary

sold by a particular manufacturer or labeler in the package size of    nn    Payers and Payment Methods
drug most frequently purchased by providers. On February
                                                                       Payment to providers for the drugs they administer or dispense
2, 2012, in CMS-2345-P, CMS proposed replacement of EAC
                                                                       varies depending on the payer and the site of care.
with estimated actual acquisition cost (AAC), and engaged
(through competitive procurement) Myers & Stauffer (a private
                                                                       Medicare
accounting firm) to provide state Medicaid agencies with
acquisition costs and consumer purchase prices of covered              Medicare’s payment for drugs depends on the treatment setting.
outpatient drugs dispensed by pharmacies (not including                Drugs provided in the hospital inpatient setting typically do not
specialty pharmacies), through a recurring pharmacy survey             receive separate payment, but instead their costs are accounted
described in “Survey of Retail Prices: Payment and Utilization         for in the diagnosis related group (DRG)-based prospective
Rates and Performance Rankings”.                                       payment made to the hospital. Similarly, drugs used in the
                                                                       hospital outpatient department for which the cost per day is
   The survey objectives are to collect data for calculation of
                                                                       $80 or less (for CY 2013) are bundled into ambulatory payment
National Average Retail Price (NARP), a monthly pricing database
                                                                       classification (APC) reimbursement for the procedures with which
of actual drug prices provided voluntarily by independent and
                                                                       they are used; there is no separate payment made for those drugs.
chain pharmacies in the United States, including for cash
                                                                       For CY 2013, CMS will pay acquisition and pharmacy overhead
paying customers, customers with commercial third party
                                                                       cost for hospital outpatient separately payable drugs and biological
insurance, and Medicaid customers. Another survey objective,
                                                                       without pass-through status at ASP plus 6%. Part B prescription
established by CMS but not mandated in PPACA, is to collect
                                                                       drugs administered in the physician office or clinic are also paid at
data on the purchase prices of all Medicaid covered outpatient
                                                                       ASP plus 6%.
drugs dispensed by independent community pharmacies and
chain pharmacies, for calculation of the National Average Drug              The Federal Government’s financial and budget issues have
Acquisition Cost (NADAC). As with AMP-based FUL, CMS has               the potential to cause changes in reimbursement. For example,
posted draft NARP and NADAC reimbursement files for review             the Sequester of 2013 will result in reduction of Medicare Part
and comment by the public.11                                           B payment from ASP+6% to ASP+4% for claims on or after
                                                                       April 1st. However, as of the time of publication of this Guide,
   Separately, some state Medicaid programs have implemented
                                                                       it is not possible to know if this change in reimbursement
or are in the process of implementing an AAC-based
                                                                       will be sustained or if there may be other changes in federal
reimbursement methodology. These states include Alabama,
                                                                       health services reimbursement. It is also impossible to know if
Oregon, Idaho, Iowa, Louisiana, California and New York.12
                                                                       these changes in federal reimbursement will influence or affect
                                                                       reimbursement by commercial entities that sometimes emulate
Public Health Service 340B Price                                       government reimbursement methods.
Public Health Service (PHS or 340B) price (referred to as a
                                                                           For end stage renal dialysis, injectable and oral drugs with
‘340B ceiling price’) is the highest price that a ‘340B-covered
                                                                       injectable equivalents administered in relationship to dialysis
entity’ could be charged, and is equal to the price that the state
                                                                       treatment are included in the Medicare per-dialysis prospective
Medicaid agency would pay absent any supplemental discount
                                                                       payment.14 The American Taxpayer Relief Act (H.R. 8), signed
or rebate. However, 340B pricing can be better than Medicaid
                                                                       into law on January 1, 2013, included delay in addition to
pricing because sales do not include retail pharmacy markups and
                                                                       the prospective payment of orals-only drugs related to dialysis
because 340B providers usually negotiate sub-ceiling prices.
                                                                       treatment until January 1, 2016 (previously these drugs had been
    340B ceiling prices for brand-name drugs were reported             scheduled for addition to the prospective payment on January 1,
to average 51% of AWP. PPACA expanded the 340B program                 2014).15
to include certain children’s hospitals, freestanding cancer
                                                                           On January 1, 2006, as a result of passage of the MMA,
hospitals, critical access hospitals, rural referral centers, and
                                                                       Medicare began to pay for outpatient pharmaceuticals dispensed
sole community hospitals. PPACA exempted pharmaceutical
                                                                       at the pharmacy under Part D. Part D benefits are provided
manufacturers from having to provide discounts on orphan drugs
                                                                       through stand-alone prescription drug plans (PDPs) or Medicare
to these newly eligible entities, as proposed, if the drugs are used
                                                                       Advantage prescription drug plans that are integrated with a
to treat diseases for which they received orphan-drug designation.
                                                                       medical plan (MA-PDs). These drug plans typically are offered
                                                                       by PBMs and commercial health plans. Subject to legislated
                                                                       mandates and to CMS guidelines and approval, each PDP
                                                                       and MA-PD sets its own premiums, benefit structures, drug

                                             Academy of Managed Care Pharmacy | 9
A M C P G u i d e t o P h a r mac e u t i ca l Pa y m e n t M e t h o d s , 2 0 1 3 U p d at e
Executive Summary
formularies, pharmacy networks, and terms of payment. Thus, OIG found that 10 of 22 states using the carve-in approach did
unlike the other components of Medicare where a standard not collect rebates.19
payment formula typically exists, drug payment to pharmacies Every state Medicaid program, either directly or through
and member cost-share vary by individual plan under Part D. managed Medicaid organizations, also pays for drugs that are
Part D plans and MA-PDs may negotiate discounts and/ utilized under the medical benefit (e.g., in the physician’s office
or rebates with drug manufacturers. In late 2012, it was and clinic). Drugs covered under the medical benefit are typically
proposed that Part D drug sales for dual eligible and low income paid for differently than are drugs covered under the pharmacy
beneficiaries, together representing approximately 56% of Part benefit, using formulas that vary by state, that are based on AWP,
D enrolled patients, be made subject to Medicaid statutory drug WAC, or ASP. States are required to collect rebates for drugs
rebates. However no such change has been implemented as of administered in these settings also, but as of 2009, not all states
the publication date of this Guide.16 were in compliance.20
Medicaid Private Purchasers
Currently, every state Medicaid program includes an outpatient Compared with public payers, there is less transparency in the
prescription drug benefit (also called a “pharmacy benefit”). payment methods used by private payers to pay for prescription
As of July 1, 2011, 74.2% of Medicaid enrollees nationwide drugs. For example, private payers use MAC price lists for
were enrolled in managed care plans, including health insuring multiple-source drugs; however, prices contained in these MAC
organizations, commercial managed care organizations, lists, the methodology by which these lists are constructed, the
Medicaid-only managed care organizations, Primary Care Case frequency with which they are updated, and network pharmacies
Management, prepaid inpatient health plans, prepaid ambulatory at which they apply are not publicly disclosed. Similar to public
health plans, programs for all-inclusive care for the elderly and payers, private payers use drug formularies to manage beneficiary
others. However health insuring organizations, commercial prescription drug use and the cost of drugs paid for by the plan.
managed care organizations and Medicaid-only managed care Most formularies have copayment “tiers” that correspond to
organizations represented only 47% of this enrollee pool.17 different levels of beneficiary cost sharing. The placement of drugs
Under fee-for-service Medicaid, most states pay pharmacies within copayment tiers is related to their relative safety, efficacy,
directly for the drugs dispensed to Medicaid beneficiaries, using and effectiveness as determined by health plan or PBM pharmacy
a rate based on AWP or WAC for brand drugs and maximum and therapeutics (P & T) committees as well as their direct cost,
allowable cost (MAC, based on federal and state upper limits) including the price concessions that private payers can obtain
for multiple-source brand and generic drugs. Several states from drug manufacturers.21 It has been suggested that P & T
have implemented average Actual Acquisition Cost (AAC)-based committees refocus to address value-based reimbursement and
reimbursement as well.18 If the beneficiary is enrolled in a accountable care.22 Generic drugs are most commonly placed in
Medicaid managed care plan, the state may pay the Medicaid the lowest formulary copayment tier, although some formularies
managed care plan to cover pharmacy benefits for beneficiaries, list preferred generics on the lowest tier, and non-preferred
or the state may choose to “carve out” the pharmacy benefit generics on the second tier together with preferred brands. Private
and pay for it directly under fee-for-service administered by the payers negotiate drug payment rates with pharmacy providers;
state. Under managed Medicaid without carve-out, each MCO historically, these rates have been based on AWP or WAC, and
negotiates with drug manufacturers for rebates and discounts and include MAC pricing for most generic drugs.
manages its own drug formulary and network. Under carve-out, As in Medicare DRGs, private payers prefer to bundle payment
the state pays pharmacies for prescription drugs directly and for prescription drugs in DRG-based payments or in per-diem
manages a statewide formulary that may include a preferred drug rates for inpatient hospital, while hospital outpatient drugs are
list (PDL) and supplemental rebates as well as rebates mandated more commonly paid for separately if they exceed a specified cost
by federal statute. Beneficiaries who are eligible for both threshold. Drugs administered in physician offices and clinics are
Medicaid and Medicare (“Medi/Medi” or “dual eligibles”) receive usually paid separately based on AWP, WAC, or ASP.
prescription drug benefits through the Medicare Part D outpatient Pilot programs are underway in several commercial settings to
drug benefit. evaluate bundled payment mechanisms. A RAND Evidence-based
When pharmacy benefits are carved into Medicaid managed Practice Center study published in August 2012 by the Agency
care contracts, CMS requires states to collect drug utilization for Healthcare Research and Quality concluded in part: “There
data, for collection of statutory rebates from pharmaceutical is weak but consistent evidence that bundled payment programs
manufacturers. However, in a study conducted in Q2 2011, the have been effective in cost containment without major effects on
Academy of Managed Care Pharmacy | 10A M C P G u i d e t o P h a r mac e u t i ca l Pa y m e n t M e t h o d s , 2 0 1 3 U p d at e
Executive Summary
quality.”23 Private sector initiatives include, for example, United 3. Pharmacies receive payment from the health plan or PBM
Healthcare’s bundled payment pilot study in oncology.24 for the drugs dispensed to the plan members based on a
reimbursement formula agreed to by the payer (or agent)
nn How Products, Services, and and pharmacy. Physicians and other providers also negotiate
Payments Flow Through Channels of with health plans for payments for the drugs they administer
directly to beneficiaries. Drug payment may be bundled
Distribution (See Exhibit 1) in some channels (e.g., DRGs for hospital inpatient and,
Any discussion of drug payment should consider the impact of depending on circumstances, APCs for hospital outpatient),
channel of pharmaceutical distribution (e.g., hospital, physician, or in other channels (e.g., pharmacy and physician office)
pharmacy) on both payment method and level. drugs may be paid on the basis of individual prescriptions
1. The majority of drug manufacturers ship drugs directly dispensed or administered.
to drug wholesalers or distributors, who then distribute 4. At the pharmacy counter or other point of sale, beneficiaries
the drugs to their end customers. Manufacturers enter with health insurance that includes prescription benefit
into various forms of contracting arrangements, including coverage will typically pay a cost-share to the pharmacy for
discounts and rebates, with all of the entities within the the prescription drug. The cost-sharing type (e.g., copayment
pharmaceutical supply chain. Manufacturers typically offer or coinsurance) and amount are set by the terms of that
different contracting arrangements, depending on customers’ health plan member’s benefit design. If the pharmacy plan
channel of distribution or class of trade, which may be is administered by a PBM, the PBM then bills the member’s
administered by wholesalers or distributors or directly with health plan or other payer an amount based on the payment
the manufacturers. formula stipulated in its provider service agreement, minus
2. Health plans and PBMs also negotiate with manufacturers the beneficiary cost-share amount collected by the pharmacy.
for discounts and rebates, primarily for single-source branded Individuals without health insurance or other coverage for the
pharmaceuticals in competitive therapeutic categories purchase of their prescription drugs or without the assistance
purchased for the individuals enrolled in their plans or under of negotiated pricing through a “discount card” program must
their management, based on volume, market share, and pay the pharmacy’s or other provider’s “usual and customary”
formulary placement. (U&C) price to obtain their drugs.
EXHIBIT 1. Drug Distribution Model
Academy of Managed Care Pharmacy | 11A M C P G u i d e t o P h a r mac e u t i ca l Pa y m e n t M e t h o d s , 2 0 1 3 U p d at e
Executive Summary
Recent Pharmaceutical Payment Milestones Disclosures
The timeline (Table 1) summarizes recent events affecting There was no external funding for this research. The contributors,
payment for prescription drugs and provides hyperlinks to obtain Howard Tag, JD, and Elan Rubinstein, PharmD, MPH,
further information. provide consulting services to clients that include professional
associations, health plans, purchasers, providers, pharmaceutical,
biological, and medical device manufacturers, and other health
care entities.
TABLE 1. Pharmaceutical Payment Milestones: 2005–2013
Date Description of Milestone Key References
January 1, 2005 Initiation of Average Sales Price CMS’s effort to establish a new http://www.gpo.gov/fdsys/pkg/
for Medicare Part B medications, payment benchmark for prescriptions PLAW-108publ173/pdf/PLAW-
as a result of the 2003 Medicare administered in physician office, 108publ173.pdf
Prescription Drug, Improvement, clinic and hospital outpatient
and Modernization Act (Public settings.
Law 108- 173).
January 1, 2006 Initiation of Medicare Part D, Competitive delivery model without Medicare Part D Benefit Designs and
administered by stand-alone centralized drug pricing, mandatory Formularies 2006-2009. J Hoadley,
PDPs and by MA-PDs with manufacturer rebates or community for MedPAC. 12/5/08 http://www.
prescription drugs and services pharmacy reimbursement guidelines. medpac.gov/transcripts/MedPAC%20
delivered primarily by community Formulary%20Presentation%20
pharmacies. -%20Hoadley%2012-05-08%20
revised.pdf
February 8, 2006 Deficit Reduction Act of 2005 CMS’s effort to establish a new Deficit Reduction Act of 2005:
establishes AMP as basis of payment benchmark for prescriptions Implications for Medicaid. 2/06.
Medicaid FUL calculation, and dispensed through pharmacy Kaiser Commission on Medicaid and
requires AMP to be publicly channels. the Uninsured. http://www.kff.org/
disclosed. medicaid/upload/7465.pdf
October 6, 2006 Wall Street Journal article First Databank increased the markup Martinez B. How quiet moves by
reporting on litigation revealed for of WAC to determine AWP for a large a publisher sway billions in drug
the first time that First Databank number of drugs in 2002 from 1.20 spending. Wall Street J. October 6,
took action in 2002 to increase to 1.25. 2006:A1. Available at: http://www.
the markup of AWP from WAC for AWP was not based on actual dc37.net/news/newsreleases/2006/
certain brand-name drugs. surveys of drug wholesaler prices. drugpricing_WallStJ.pdf
November 14, 2006 U.S. District Court for the District Public disclosure of disconnect Proposed Settlement by Judge Saris
of Massachusetts, Judge P. Saris, between AWP and actual market in CIVIL ACTION NO. 05-11148-
granted preliminary approval to a prices. PBS; New England Carpenters
settlement in class action re AWP Benefit Fund et al. vs. First
with First Databank Databank-McKesson. Available at:
http://www.prescriptionaccess.org/
docs/FDB-prelim-approval-order2.pdf
Continues.
Academy of Managed Care Pharmacy | 12A M C P G u i d e t o P h a r mac e u t i ca l Pa y m e n t M e t h o d s , 2 0 1 3 U p d at e
Executive Summary
TABLE 1. Pharmaceutical Payment Milestones: 2005–2013 (Continued)
Date Description of Milestone Key References
July 6, 2007 Deficit Reduction Act of 2005 Retail pharmacy class of Medicaid Drug Pricing Regulation.
definition of “retail pharmacy trade means any independent CMS Fact Sheet. 7/6/07. http://www.
class of trade” for AMP pharmacy, chain pharmacy, mail amcp.org/WorkArea/DownloadAsset.
calculation purposes, and of class order pharmacy, or other outlet aspx?id=11424 and Section
of trade to be included in the that purchases drugs from a 447.504, Determination of AMP.
AMP calculation. manufacturer, wholesaler, distributor, http://www.gpo.gov/fdsys/pkg/
or other licensed entity and CFR-2008-title42-vol4/pdf/CFR-
subsequently sells or provides the 2008-title42-vol4-sec447-504.
drugs to the general public. pdf and Retail Pharmacy class of
Sales, rebates, discounts, or other trade, Federal Register v72 #136,
price concessions included in AMP. 7/17/07.
Includes several non-retail pharmacy http://www.gpo.gov/fdsys/pkg/FR-
channels (see references). 2007-07-17/html/07-3356.htm
November 1, 2007 Judgments against two major Public disclosure of disconnect Memorandum and order by Judge
brand-name drug manufacturers between AWP and actual market Saris in: Re MDL 1456 and
for “grossly inflating” the AWPs prices with respect to particular Civil Action No. 01-12257-PBS.
of certain expensive physician- products; preceded by about 7 Available at: http://wexlerwallace.us/
administered drugs (PADs). years of allegations and settlements files/00079404.pdf
between several pharmaceutical
manufacturers and state and federal
prosecutors over inflating the
“spread” between AWP and actual
acquisition cost for physicians.
July 2008 Medicare Improvements for With a federal court injunction, http://www.gpo.gov/fdsys/pkg/
Patients and Providers Act of results in delay of (a) expansion PLAW-110publ275/pdf/PLAW-
2008 (MIPPA). of the number of drugs subject 110publ275.pdf
to the FUL amounts, (b) change
in the basis for the calculation
of FUL amounts to AMP, and (c)
requirement that CMS share AMP
data with states.
December 31, 2008 CMS’s Medicare Part B drug Postponed because of contractual http://www.cms.gov/Medicare/
Competitive Acquisition Program issues with successful bidder. Medicare-Fee-for-Service-Part-B-
(CAP) postponed as of December No official notice regarding if or Drugs/CompetitiveAcquisforBios/
31, 2008. when program may be restarted. index.html
Continues.
Academy of Managed Care Pharmacy | 13A M C P G u i d e t o P h a r mac e u t i ca l Pa y m e n t M e t h o d s , 2 0 1 3 U p d at e
Executive Summary
TABLE 1. Pharmaceutical Payment Milestones: 2005–2013 (Continued)
Date Description of Milestone Key References
January 2009 Hospital outpatient settings: For CY 2009, separate drug payment http://www.cms.gov/Regulations-and-
Payment for non-pass-through in hospital outpatient settings Guidance/Guidance/Transmittals/
drugs and biologicals in CY reduced to ASP + 4% for non-pass- downloads/R1702CP.pdf
2009 is made at a single rate through drugs and biologicals.
of ASP + 4%, which includes For CY 2009, pass-through drug
payment for both the acquisition payment continues at ASP + 6%.
cost and pharmacy overhead
costs associated with the drug or
biological. For pass-through drugs
and biologicals in CY 2009, a
single payment of ASP + 6%
is made to provide payment for
both the acquisition cost and
pharmacy overhead costs of these
pass-through items.
January 2009 The American Recovery and Objective is to increase research that Comparative Effectiveness. J Holzer,
Reinvestment Act of 2009 compares treatment modalities. G Anderson. Health Policy Monitor.
provides $1.1 billion funding The hope is that availability of CE 2009. Available at: http://hpm.
for comparative effectiveness research results will help care givers org/en/Surveys/Johns_Hopkins_
(CE) research through the make best possible therapeutic Bloomberg_School_of__Publ._H_-_
Agency for Healthcare Research choices. USA/13/Comparative_Effectiveness_
and Quality (AHRQ) and the Research.html
Council is precluded from making
National Institutes of Health
coverage or reimbursement
(NIH), and establishes the
decisions.
Federal Coordinating Council for
Comparative Effectiveness.
February 2009 OIG release of comparison Analysis of “average unit DHHS Office of Inspector
of community pharmacy reimbursement amount” including General. Comparing pharmacy
reimbursement amounts for dispensing fee with ingredient cost. reimbursement: Medicare Part D to
Medicare Part D plans versus Median 0.6% lower Part D Medicaid. Report no. OEI-03-07-
Medicaid in the second half of reimbursement for single-source 00350. February 2009. Available at:
2009 for 40 single-source drugs brand drugs. https://oig.hhs.gov/oei/reports/oei-03-
and 39 multiple-source drugs 07-00350.pdf
Medicaid reimbursement exceeded
with high expenditures.
Medicare Part D reimbursement by
10% or more for 28 of 39 multiple-
source drugs and was 17% higher
at the median for the 39 multiple-
source drugs.
Continues.
Academy of Managed Care Pharmacy | 14You can also read