Place your billion-dollar bets wisely - Powertrain strategies for the post-ICE automotive industry
←
→
Page content transcription
If your browser does not render page correctly, please read the page content below

Place your
bil ion-dollar
bets wisely
Powertrain strategies for the
post-ICE automotive industry

kpmg.com

Letter from
Gary Silberg
For more than a century, the                          economies where incomes and
automotive industry has been                          electric grids prevent consumers
defined by one constant and                           from switching to BEVs. Even in
arguably dominant force: the                          wealthy countries like the U.S., the
reign of the internal combustion                      charging infrastructure is not fully
engine (ICE). Now, a tsunami of                       in place for BEVs. Nor is the grid
investment—some $200 billion—has                      sufficiently robust for a nation of
hit the industry from automotive                      BEV chargers—or safe from the
start-ups, established automakers                     scary threat of cyber intrusion, (or
and suppliers, even tech companies                    even severe weather).
that are betting on a new powertrain
                                                      Then there is physics, which heavily
king: the battery electric vehicle
                                                      favors ICE. A full gas tank has the
(BEV). Add in the momentum
                                                      same energy as 1,000 sticks of
created by the enormous success
                                                      dynamite. Gasoline has about 100
of Tesla, global concerns around
                                                      times the energy density of a lithium
climate change, and new regulatory
                                                      ion battery. Notwithstanding the
regimes that could literally outlaw
                                                      tremendous advances in battery
ICE powertrains, and you have a new
                                                      technology, the physical advantages
auto industry, dominated by BEV
                                                      of oil and its abundant supply mean
powertrains.
                                                      the ICE engine will be around for a
Well, that’s the current conventional                 long while, even if its importance is
wisdom. But is it right? Or, as is                    diminished.
often the case, is conventional
                                                      So yes, conventional wisdom is
wisdom, well, simply too
                                                      too conventional. In this paper we
conventional—or just overly
                                                      describe an emerging automotive
simplistic?
                                                      landscape that is far more complex
This is not a theoretical question,                   and uncertain—but also exciting.
given the billions at stake. We                       Rather than a single, monolithic
believe that the coming years                         model for success, built around a
will be far more complicated and                      single fuel/powertrain combination,
unpredictable than the conventional                   the future industry will be
wisdom suggests. For starters,                        fragmented—a mosaic. Think of a
billions of people live in developing                 world with bespoke, sexy, and cool

© 2021 KPMG LLP, a Delaware limited liability partnership and a member firm of the KPMG global organization of independent member firms   2
affiliated with KPMG International Limited, a private English company limited by guarantee. All rights reserved.
new vehicles powered by batteries                     if you’re a supplier? How much will
or hydrogen. Hybrids and vehicles                     you bet on the new players and new
running on natural gas. Maybe                         types of vehicles?
even solar. And, yes, new cars with
                                                      There are no simple answers. And
advanced ICE technology. Throw
                                                      the stakes could not be higher. No
in progress in computing and AI to
                                                      single company has the financial
make autonomy real, and you have a
                                                      wherewithal to cover all the bets.
new transportation ecosystem made
                                                      Companies will need to think hard
up of many kinds of vehicles using
                                                      about where they can carve out
the technologies that work best for
                                                      a winning position—where they
the job.
                                                      can make their billion-dollar bets—
In this new world, where should you                   and where to use alliances and
place your bets? A lot depends, of                    partnerships.
course, on your current situation. If
                                                      Our goal here is to offer ideas and
you’re a startup you can go all-in on
                                                      approaches for weighing these mind-
new technology. But what if your
                                                      boggling options. We have created
biggest single source of profits is
                                                      the mosaic framework to help you
trucks and SUVs—like most U.S.
                                                      answer the big strategic questions:
automakers? What do you have to
                                                      where to play, how to play, and—
believe about your customers, the
                                                      critically—when to play in this new
evolution of technology, growth of
                                                      automotive ecosystem. In short,
charging infrastructure, and future
                                                      the mosaic can help you make the
regulation to convince you to bet
                                                      billion-dollar bets—wisely.
billions on EV technology and plant
capacity now? What will be the cost
in lost profits if you move too quickly
and can’t build product for your most
profitable business? What is the
cost if you move too slowly and you                                      Gary Silberg
aren’t in position to cash in when                                       Partner, Global Automotive
EVs reach the tipping point? What                                        Sector Leader, KPMG US

© 2021 KPMG LLP, a Delaware limited liability partnership and a member firm of the KPMG global organization of independent member firms   3
affiliated with KPMG International Limited, a private English company limited by guarantee. All rights reserved.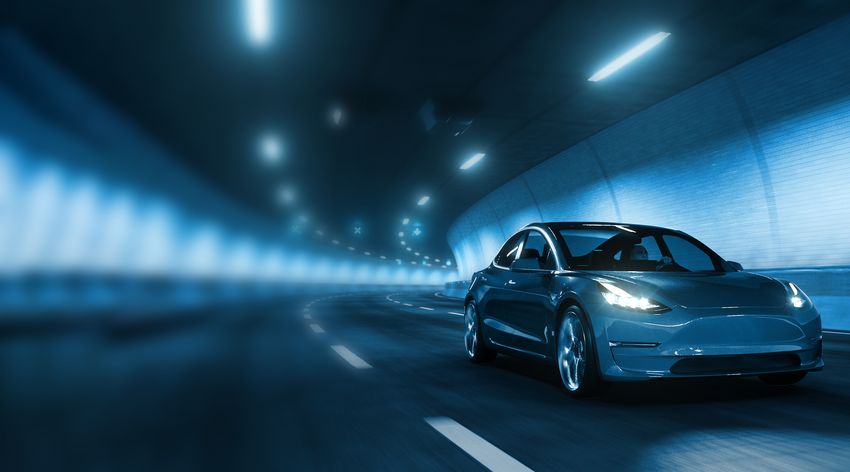
Key take aways
                              The century-long reign of the ICE powertrain is ending—but no one knows how
                              quickly; analyst estimates of 2030 BEV penetration range from as little as 24 percent to
                              nearly 40 percent.

                              The industry will look more like a mosaic. Contrary to the conventional wisdom
                              and $200 billion- plus of investments, the future won’t just be BEVs. There will be
                              multiple fuel/powertrain combinations—including ICE hybrids, and hydrogen—to meet
                              the needs of the market.

                              Too many players, too few consumers? Today, many BEV players are aiming at a
                              narrow ($50,000 and up) slice of the U.S. market, representing only 2.4 million units or
                              17 percent. By 2030, even if BEV penetration reaches 30 percent (including more lower-
                              price models) the available market may only be 5.1 million out of a 17 million-unit market.

                              Massive ICE manufacturing overcapacity. If the 30 percent BEV penetration
                              forecast is even close, by 2030 there could be nearly 40 million units per year of excess
                              ICE manufacturing capacity globally—the equivalent of 200 assembly plants. That does
                              not include the multiplier effect on suppliers and their plants.

                              Unanswered infrastructure questions. Not only is there uncertainty about building
                              out charging infrastructure (for EVs and hydrogen vehicles), but also about the needed
                              electrical supply. Nearly 4 billion people live in countries with inadequate electrical
                              infrastructure for EVs. Even in wealthy economies, the electric grid is vulnerable and not
                              ready for widespread EV use.

                              Sweeping structural change. In almost any scenario, the industry can expect
                              massive structural change. New competitors will take share. Value chains will be
                              shattered, and supply chains will be reconfigured; companies will need to adjust their
                              portfolios of businesses.

                              The stakes could not be higher. The bets—and the uncertainty and complexity—are
                              enormous. New dominant positions will be built, and old empires may fall. A decade
              $               from now, there could be a new pecking order in automotive—and one or more of
                              today’s top players may have been acquired or disappeared.

                              The mosaic can show how to place your bets wisely. To win, companies will
                              need to choose new strategic postures and adopt a dynamic decision-making framework
                              to plan and place their bets. They need the mosaic.

© 2021 KPMG LLP, a Delaware limited liability partnership and a member firm of the KPMG global organization of independent member firms   4
affiliated with KPMG International Limited, a private English company limited by guarantee. All rights reserved.
© 2021 KPMG LLP, a Delaware limited liability partnership and a member firm of the KPMG global organization of independent member firms   5
affiliated with KPMG International Limited, a private English company limited by guarantee. All rights reserved.
From a monolith to a mosaic                                                                                                                 1

For a century, a single fuel-powertrain combination—                                 battery-powered drivetrains ran up against the limitations
the petroleum-powered internal-combustion engine                                     that engineers continue to wrestle with today. Finally,
(ICE)—has dominated the global automotive industry.                                  as the network of well-paved roads expanded, motorists
How automotive companies are structured, how they                                    wanted to go faster and farther than they could in a
are financed, how they go to market—everything was                                   battery-electric.
optimized for producing and selling ICE-based vehicles.
                                                                                     Now, the conventional wisdom says that the battery-
Yet, ICE was not always destined to dominate. In the                                 electric powertrain will triumph—becoming the
early days of the industry, ICE was only one powertrain                              dominant force in the automotive business that ICE has
option. And long before the internal-combustion engine                               been. Yet, we still don’t know when BEVs might reach
appeared, inventors were tinkering with battery-powered                              a tipping point and become popular with a wide swath
vehicles. Indeed, in the early 1900s, electric vehicles                              of consumers, generating the sales—and profits—to
outsold the noisy, dirty and smelly gas-powered tin                                  justify billion-dollar bets. By 2025? By 2035? Never?
lizzies.1 Henry Ford and Thomas Edison were exploring                                Predictions are all over the map.
electrics, and Ferdinand Porsche invented the first
                                                                                     For the next 10 to 20 years, multiple fuel/powertrain
hybrid. Brands were built on steam powertrains, and
                                                                                     combinations (including gasoline/ICE) will coexist,
Stanley “steamers” were sold until the mid-1920s.
                                                                                     and innovation will continue on multiple fronts. So,
It took 20 years, but by the 1920s gas-powered ICE                                   instead of a monolith built around one dominant fuel/
vehicles drove the competitors off the road—because of                               powertrain combination, the industry will look more like
advantages that remain today. Petroleum (gasoline and                                a mosaic.
diesel fuel) has extraordinary energy density, so a small
                                                                                     The mosaic is both a metaphor for shattering the
tank could keep a car going for hours. And, thanks to the
                                                                                     old ICE model and a framework for understanding the
adoption of kerosene for lighting in the 1800s, there was
                                                                                      highly complex and uncertain future. It can help
already a nationwide network for distributing petroleum
                                                                                     you evaluate possible scenario drivers—economics,
products. Mass production and engineering refinements
                                                                                     technology evolution, regulation, etc.—to place billion-
quickly drove down the cost of ICE engines and
                                                                                     dollar bets wisely and to revise strategies as factors
improved reliability and performance, while makers of
                                                                                     change over time.

Exhibit 1: The mosaic is a framework to
view scenarios on multiple dimensions
Scenario drivers:
                                                    Ecosystem
                   Economics                       requirements

Consumer                           Technology                        Regulatory
acceptance                          evolution                        mandates

1
    Jake Richardson, “38% Of American Cars Were Electric In 1900,” CleanTechnica, February 25, 2018.

© 2021 KPMG LLP, a Delaware limited liability partnership and a member firm of the KPMG global organization of independent member firms         6
affiliated with KPMG International Limited, a private English company limited by guarantee. All rights reserved.
A crack in the ICE:
  fracturing the industry model
  Efforts to create alternatives to ICE powertrains never                                    the way for commercial success. The breakthrough
  entirely disappeared and, after the oil crisis of the                                      that really put BEVs on the map came from a startup
  1970s, they got a boost as nations sought energy                                           called Tesla. Instead of building a $30,000 bare-bones
  independence. In the U.S., Congress passed the                                             econobox with an electric motor—a proposition
  Electric and Hybrid Vehicle Research, Development, and                                     attractive only to the most ardent green consumers—
  Demonstration Act, which led to a flurry of investment                                     Tesla made high cost a virtue. Its $70,000-plus cars
  in fuel cells, electric motors and batteries, and other                                    were high-performance computers on wheels that
  electric-powertrain technologies. In 1990, General Motor                                   quickly became an object of desire for well-heeled
  Corp. introduced its EV1, the first commercial U.S.                                        techie trendsetters. Tesla also upended traditional sales
  electric model in decades.                                                                 and marketing models to offer a unique customer
                                                                                             experience—and by 2020 had become the most valuable
  The EV-1 was a short-lived experiment—too costly to
                                                                                             automotive company on the planet.3
  build and too few customers.2 But advances in lithium-
  ion battery packs and modern electronics have paved

  Exhibit 2. Tesla is worth more than established automakers
  Top 15 Auto OEM enterprise value ($ billions)

Current enterprise                        Current enterprise
 value of Tesla:                        value of top 14 OEMs:
 $621 billion                                $2.2 trillion

                                                     Daimler                 Ford
                             Toyota                   $248B                 $202B
                             $394B

                                                                 Hyundai        Honda
         Tesla                                                    $119B         $100B
                                                   GM
         $621B
                                                  $182B

                                                                 BYD       Renault   NIO
                         Volkswagen                              $85B      $66B $61B
                            $389B
                                                   BMW
                                                   $179B        Nissan      Stell-   Great
                                                                 $83B       antis    Wall
                                                                           $47B $40B

  Note: Enterprise value defined as market value of equity plus book value of debt less cash as of March 19, 2001.
  Source: CapIQ

  2
      Source: “A Brief History and Evolution of Electric Cars,” Interesting Engineering website, July 1, 2020.
  3
      Source: “Tesla closes day as fifth most valuable U.S. company, passing Facebook,” CNBC.com, January 8, 2021.

  © 2021 KPMG LLP, a Delaware limited liability partnership and a member firm of the KPMG global organization of independent member firms           7
  affiliated with KPMG International Limited, a private English company limited by guarantee. All rights reserved.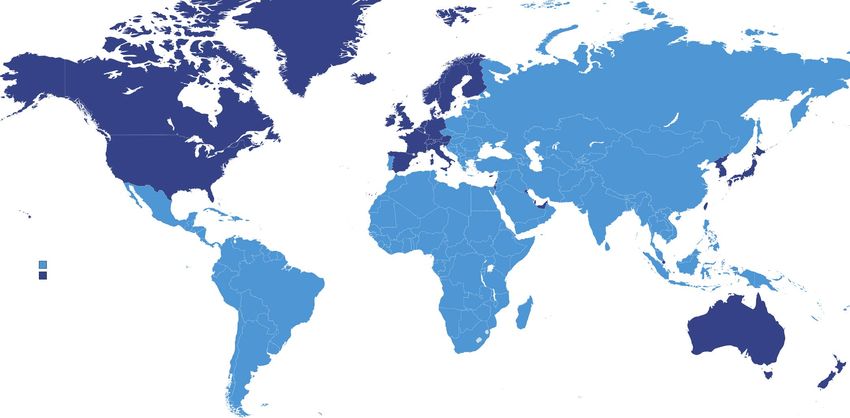
With Tesla pointing the way, auto companies across the                                    electric crossovers such as the new Mustang and
world have doubled down on electric vehicles. Almost                                      Volkswagen’s ID.4.4 A raft of new competitors, such
every major car manufacturer is now offering at least                                     as Rivian, Lucid, Fisker, and Nio are designing electric
one BEV model, if not several. In addition to high-end                                    sedans, SUVs, for the U.S. market as well. GM has gone
high-performance cars, they are selling or developing                                     all-in, declaring that it will only produce EVs after 2035.
plug-in pickups (a new Hummer powered by a 1,000                                          And Jaguar has upped the ante, saying it will be all-
horsepower electric engine delivering 11,500 lb.-ft of                                    electric by 2025.5
torque is slated for 2022) and a range of mid-priced

A tsunami of investment
We count more than $200 billion in EV investments by                                      sales. And $200 billion doesn’t even count the estimated
the top 10 global automakers (Exhibit 3). To put that in                                  $60 billion that has gone into startups or the tens of
perspective, it’s more than the U.S. spent over the 13                                    billions being invested by smaller automakers and parts
years on the Apollo space program to land a man on                                        suppliers. Nor does it include the investment that will
the moon (adjusted for inflation). It’s enough to develop                                 be needed in complementary industries, such as money
more than 200 new car platforms—aimed at a market                                         to enhance the electric grid or for gas stations to add
that today accounts for less than 5 percent of global auto                                hydrogen pumps or charging stations.

Exhibit 3. Top 10 auto makers (plus Tesla) have announced $200 billion in EV
investments and hundreds of models
Announced investments in EVs and FCVs,                                                    Global EV new model launches/refreshes
2020–present ($B)                                                                         by year
                                                                                                                                      121
                                $55

                                                               $200 billion                                                                     92
                                                 $             in EV investments
                                                                                                                                                         91

               $32                                                                                                                                            68
                                                                                                                      58         62
                       $27                                       $26
                                         $22
                                                                                                                42
                                                     $14
      $12                                                                  $11
                                                                                                      17
                                                                                 $5
                                                                                              0
                                                                                           2015 2016 2017 2018 2019 2020 2021 2022 2023
      Tesla

               BMW

                        GM

                                 VW

                                          Ford

                                                     Hyundai

                                                                 Daimler

                                                                           FCA

                                                                                 Toyota

Source: OEM announced investments are not directly comparable across OEMs.                Note: (a) 2016–2020 historical data; 2021–2023 expected based on
For example, some announcements reflect only R&D while others include capital             announcements; (b) Includes BEV models only
expense for new EV production plants.                                                     Source: LMC

For many automakers, these bets are too big to fail. But clearly, not all these bets will pay off. Some bets may wind
up losing because the hoped-for technology breakthrough didn’t happen. Others will have aimed at a vehicle type or
customer segment that won’t transition easily to EVs. Some bets will fail because of poor timing.

4
    Source: “Every Electric Vehicle That’s Expected in the Next Five Years,” Car and Driver, January 12, 2021
5
    Source: “Jaguar cars to go all-electric by 2025 as JLR plans full range of e-models by 2030,” CNBC.com, February 15, 2021.

© 2021 KPMG LLP, a Delaware limited liability partnership and a member firm of the KPMG global organization of independent member firms                            8
affiliated with KPMG International Limited, a private English company limited by guarantee. All rights reserved.
Risky business
Even now, there remains wide disagreement on when                                  At year-end 2020, LMC Automotive counted 284
a mass EV market will materialize. Depending on the                                EV models for sale and predicted the number could
analyst, EVs could capture up to 37 percent of the global                          approach 500 by 2023.6 These models will be produced
market by 2030—or as little as 24 percent (Exhibit 4).                             by an estimated dozens of companies, ranging from the
Even if the high estimate proves accurate, there still may                         newest startups to the world’s oldest auto brands.
be far too many players vying for too few customers.

Exhibit 4: There is no consensus on EV adoption
                                           Global BEV sales forecast—analysts’ viewpoints

                                                                                                                                   2030 Units
40%                                                                                                                         37%
                                                                                                                                      41.1          1.6X
35%                                                                                                           33%
                                                                                                                            31%      34.3        difference
30%                                                                                                29%                               31.1        between
                                                                                                             27%            28%                  high and
                                                                                        25%                                          28.9
25%                                                                                                23%                                               low
                                                                              20%        19%                                         26.2        estimate
20%                                                                                                                         24%
                                                                      16%      16%                             21%
15%                                                            12%     13%                          18%
                                                                                          16%
                                                9%              9%                14%                                                     UBS
10%                                                                                                                                       Bloomberg
                                         6%
                                 4%                                    9%                                                                 Morgan Stanley
    5%                  3%                                     7%
                2%                               5%                                                                                       Frost
                           2%       3%                                                                                                    LMC
    0%                                                                                                                                    RBC Capital Markets
      2019            2020       2021    2022   2023           2024   2025     2026      2027       2028      2029          2030          JP Morgan

Sources: JPMorgan; UBS; RBC Capital Markets; Morgan Stanley, LMC; Bloomberg
Note: 2030 units are based on analyst BEV share estimates and LMC 2030 volumes for consistency

Exhibit 5. As EV sales rise, the available ICE market will shrink
Low estimate                                           Average estimate                                      High estimate
        120M                                                   120M                                                  120M
        100M                             18% 24%               100M                                                  100M
                                 10% 14%                                           9%    17% 23%29%
                                                                                                                                            12% 20% 29%
                          7%                                                 6%                                                      6%                 37%
         80M       3%                                           80M   3%                                             80M      2%
Units

                                                       Units

                                                                                                             Units

         60M                                                    60M                                                  60M
                                 86% 82% 76%
                         93% 90%                                             94% 91% 83% 77%71%                                      94% 88% 80%
         40M      97%                                           40M   97%                                            40M      98%                71%63%
         20M                                                    20M                                                  20M
           0M                                                    0M                                                   0M
                 2020 2022 2024 2026 2028 2030                        2020 2022 2024 2026 2028 2030                         2020 2022 2024 2026 2028 2030

        ICE, hybrid, and other     BEV
Note: Overall industry volume taken from LMC 2021 Q1 LVSF for consistency in comparison, mix has been taken from analyst forecasts

6
    Source: LMC

© 2021 KPMG LLP, a Delaware limited liability partnership and a member firm of the KPMG global organization of independent member firms                         9
affiliated with KPMG International Limited, a private English company limited by guarantee. All rights reserved.
The risks are particularly complex for established The struggle could be especially difficult for established
automakers, which will have to manage the decline of players adopting all-in EV strategies. As Exhibit 6 shows,
ICE sales as they pursue EVs. No matter how quickly or these companies would need to do extraordinarily well
slowly the EV share of vehicle sales grows, the share of in EVs to maintain their current market shares. In the
ICE vehicles will drop by 2030 (Exhibit 5). In the U.S., for high case scenario, with 37 percent EV penetration, an
example, there could be anywhere from 3.4 million to incumbent would need to grab three times its current
5.6 million fewer ICE vehicles sold in 2030 than in 2020 market share in the new EV business to stay even. In
(assuming a 17.3-million-unit market). The implication is other words, a player with 5 percent of the market today
that automakers will be fighting harder to hold share in would need to capture 15 percent of the EV market
the conventional vehicle market, while they vie for a slice in 2030. If the low estimate holds and EVs only grab
of the EV market. 20 percent of the 2030 market, the 5 percent player
would need to capture more than 25 percent of the EV
segment to maintain unit-volume share (Exhibit 6).
Exhibit 6: Under an all-in EV strategy, incumbents will need to capture a huge
amount of EV sales to maintain overall market share
U.S. market view
Hypothetical US BEV 2030 TAM (total Required market share increase to maintain
addressable market) competitive position
17.3M 17.3M 17.3M Low
100%
3.4M analyst
4.1M
e
(20%) 90%
ar
Analyst
Required market share of BEV
5.6M
Sh
(24%)
re average
t
(32%) 80%
en
ha
rr
S
nt
Cu
70% re
1x
ur High
5.
C
60% 2x analyst
4.
13.9M 50% re
Sha
(80%) 13.1M nt
11.7M 40% rre
(76%) u
xC
(68%) 30% 3.1
20%
10%
0%
Low end of Analysts High end of 0% 5% 10% 15% 20%
analyst range average analyst range Current market share
BEV ICE, hybrid, and other
A 10% market share player would need to capture
Notes: (a) Overall industry volume taken from LMC 2021 Q1 LVSF
31% to 52% of the BEV market to maintain volumes
(b) Analyst average includes LMC, UBS, and RBC
Another consideration for incumbents: the implications capacity to build nearly 40 million more ICE vehicles than
of a declining ICE business for their asset bases and the market will demand (globally) in 2030. That would be
capital structures. We estimate that at 30 percent the equivalent of 200 un-needed assembly plants.
EV penetration, there could be global manufacturing
© 2021 KPMG LLP, a Delaware limited liability partnership and a member firm of the KPMG global organization of independent member firms 10
affiliated with KPMG International Limited, a private English company limited by guarantee. All rights reserved.Exhibit 7: There could be nearly 40 million units per year of excess ICE
capacity in 2030
Illustrative analysis of required ICE production capacity
2020 capacity 138M
ICE / Other Production Capacity (million units)
140
120
Excess ICE / Other Production Capacity
100
80
60
2030 Required ICE / Other Capacity 100.1M
40 (80M units at 80% capacity)
20
0
Renault-Nissan
Stellantis
Toyota
Hyundai
GM
Ford
Honda
Suzuki
SAIC
Changan
BAIC
Mazda
Tata
Great Wall
Dongfeng
Jianghuai
Isuzu
Mahindra
Subaru
Brilliance
BYD
GAC
Industrial CNH
DRB-Hicom
Perodua
GAZ
Other Chinese OEMs
Iranian OEMs
Other Indian OEMs
Daimler
Geely
Chery
Other
VW
BMW
FAW
Agrale SA
Source: LMC
Notes: Capacity was based on LMC capacity per manufacturer. Manufacturer capacity allocated to OEM sales groups based on 2020 sales.
Numbers were adjusted to remove estimated BEV, EREV, and FCEV capacity
Betting on non-BEV powertrains, too
Even as dozens of players target the BEV segment, everything from motorcycles to tractors and semis.
billions of dollars are being bet on alternative scenarios. They work in all terrains, at all altitudes and in all kinds
For example, General Motors, Toyota, Honda, and of weather; when the temperature drops so does
Hyundai continue to invest billions in hydrogen fuel-cell battery life.
EVs (FCEVs). FCEVs don’t have the range limitations of
Meanwhile, ICE technology continues to advance. With
BEVs but face similar obstacles—the high cost of fuel
new engine designs and electronics, gas-powered cars
cells and the need for new fueling infrastructure.
can be cleaner and less fuel hungry. For the 2020 model
Auto companies are also expanding their hybrid options. year, average estimated real-world CO2 emissions were
The hybrid price premium vs. ICE models is narrowing, projected to fall 12 grams per mile (g/mi) to 344 g/mi,
and hybrids are available in almost every passenger- and fuel economy is projected to increase 0.8 miles per
vehicle configuration, from subcompacts to SUVs and gallon (mpg) to 25.7 mpg.7 And there are “clean” ICE
pickups, providing an attractive option for consumers variations, such as natural-gas-powered city buses.8
who are not prepared to make the leap to BEVs.
The bottom line: Both established players and start-ups
What’s more, ICE isn’t going away anytime soon. need to look at all the possibilities for every dimension—
Vehicles with ICE powertrains are far cheaper to buy customer needs, economics, infrastructure evolution,
and are likely to remain so—making them the practical regulation, time—when should place their billion-dollar
choice in developing economies. Moreover, ICE vehicles bets? And how do they sustain current business as they
are more versatile—ICE powertrains are used in invest in the new?
7
Source: 2020 Automotive Trends Report, U.S. Environmental Protection Agency, epa.gov, January 2021
8
Source: Natural gas powers more than 175,000 vehicles in the United States and roughly 23 million vehicles worldwide; Alternative Fuel Data Center. U.S. Department
of Energy, afdc.energy.gov.
© 2021 KPMG LLP, a Delaware limited liability partnership and a member firm of the KPMG global organization of independent member firms 11
affiliated with KPMG International Limited, a private English company limited by guarantee. All rights reserved.Play it smart: Use the mosaic 2
to assess the possibilities
The mosaic framework gives us a way to look at the various constraints (and opportunities) as automotive companies
place their bets. It helps decision makers ask the critical questions about what they would need to believe about
variables such as battery cost curves, charging infrastructure buildout, grid maturity, and customer preferences to
make strategic decisions.
Exhibit 8. A mosaic view of auto industry scenarios
Example multi-factor evaluation—trucking sector (illustrative example)
ICE EV
User segment Gasoline Diesel NG Hybrid BEV FC
City
Passenger
Suburban
Vehicles
Rural
Light vehicles
MaaS Fleets
Vans & buses
Long-haul
LTL / Regional
Commercial
Vehicles Last mile trucking/
service fleets
Local delivery services
Drivers and considerations
Consumer Technology Ecosystem Regulatory
Economics
acceptance evolution requirements mandates
— Driver — Total cost of — Solid state — Private sector — Restrictions
experience ownership batteries investments — Subsidies / Tax
— Mile range / (acquisition cost, — Advances in fuel in upstream / incentives
range anxiety depreciation / cell design and downstream
— Value perception residual, fuel, materials capabilties
— Social maintenance, — Increases in — Government-driven
preferences insurance, etc.) computing power investments &
coordination
© 2021 KPMG LLP, a Delaware limited liability partnership and a member firm of the KPMG global organization of independent member firms 12
affiliated with KPMG International Limited, a private English company limited by guarantee. All rights reserved.1. Consumer preferences and vehicle missions
Understanding the automotive buyer is more important
than ever. Where do they drive? How often? How far
and for what purpose? Would they rather use mobility BEVs could dominate
services than buy car? At this point, BEVs do not fit all in urban MaaS
customer needs. Today BEVs beat out ICE mainly on
performance and environmental concerns—they trail in BEVs will likely become the dominant light vehicle
cost, convenience, range and perceived value. for urban mobility-as-a-service (MaaS) fleets. MaaS
What will it take to convince drivers of pickups and fleet operators would not have range anxiety (all
SUVs—the most popular consumer vehicles in trips would be local) and high utilization rates
America—to switch to an electric model? Why isn’t it would lead to low cost of ownership, despite
equally plausible that their next move will be to hybrids? higher purchase costs. This level of utilization
For about $10,000 less than one of the all-electric lowers the total cost of ownership compared with
pickups on the drawing boards, a consumer today can ICE vehicles. MaaS providers could rely on their
get a hybrid that will go more than 800 miles on a tank own charging facilities, so finding a charging point
of gas and do zero to 60 in about 5 seconds.9 would not be an issue. Autonomous BEVs for
MaaS could also get a boost from regulators who
Even though upcoming BEV models are spec’d to deliver want mandate the use of BEVs for livery services.
more than 400 miles on a charge, consumers still cite We have estimated that 90 percent of autonomous
range anxiety as a reason not to buy EVs. The average MaaS vehicles could be EVs in 2030.12
gasoline-ICE vehicle (a small SUV), can go for about 410
miles before needing a fill-up, while current EVs can only
BEV has signficant cost advantages in
go about 250 miles—and a lot less if it’s cold out.10 While
high mileage MaaS operations
80 percent of U.S. motorists travel 50 miles or less per
day on average, they still want to know that they can ICE vs. BEV cost per mile for MaaS operations
drive long distances and not worry about if there will be License, 0.38
a place to refuel/recharge. registration, taxes 0.01 0.31
Maintenance 0.09 0.01
Meanwhile, battery-electric powertrains look like
0.07
winners in emerging automotive applications, such as Insurance 0.09
autonomous vehicles for urban mobility services and 0.08
local-delivery vans (with drivers or autonomous). The Fuel 0.09 0.04
high purchase cost is amortized over more hours of 0.11
Depreciation 0.09
daily operation and range is not a worry. What’s more,
these vehicles don’t need the performance and styling ICE (Honda Civic BEV
EX Hatchback) (Nissan Leaf)
that are the basis for consumer vehicles. The drawback:
this market doesn’t yet exist, although Amazon has Notes: Key assumptions: Useful life–6 years; miles per year–
announced has tested delivery vans that it developed 50,000; maintenance costs–per AAA; gasoline price–$2.87
(AAA assumption); ICE fuel economy–32 MPG combined; EV
with Rivian Automotive on routes in Los Angeles.11 efficiency–0.3 kWh per mile; electricity price–0.132 per kWh;
License, registration, taxes, insurance–per AAA
Source: KPMG Analysis
Source: Comparison based on 2021 Ford F150 XLT with Powerboost Hybrid V6
9
configured (MSRP of $57,760) vs. Rivian R1T ($67,500).
10
Source: Institute of Transportation Studies, University of California, Davis
website; EVAdoption.com.
11
Source: “Amazon is testing Rivian electric delivery vans in Los Angeles,” CNBC.
com, February 3, 2021.
12
Source: For more detail, see EV Plan B, KPMG 2020.
© 2021 KPMG LLP, a Delaware limited liability partnership and a member firm of the KPMG global organization of independent member firms 13
affiliated with KPMG International Limited, a private English company limited by guarantee. All rights reserved.2. Economics and technology evolution
BEVs are still too pricey for most consumers to consider. While Tesla and luxury/performance brands such as
Even though daily driving costs can be lower than for an Jaguar, Mercedes and Porsche are finding a market for
ICE vehicle, the sticker price limits the potential market. pricey EVs, with MSRPs exceeding $100,000, it is a
The problem remains the cost of battery packs—despite limited market. Only about 2.4 million of the 14.5 million
an 85 percent drop in the cost of lithium-ion batteries light vehicles sold in the U.S. in 2020 fetched $50,000 or
over the past 10 years. Even so, battery packs for a more at retail (Exhibit 9).13 That is only about 17 percent
midsize BEV still cost upwards of $10,000. of the U.S. market.
Exhibit 9. Only 17% of U.S. passenger vehicles sell for $50,000 or more
US 2020 light vehicle sales by price level (thousands of units)
$70K+ 538 Porsche Taycan Tesla Model X Tesla Model S Rivian R1T
$65K–70K 120
$60K–65K 172 2.4m
Cadillac Lyriq
units
$55K–60K 881 Ford Mustang Mach-E
$50K–55K 688 Tesla Model Y
Tesla Model 3
$45K–50K 1,367
VW ID4
$40K–45K 1,598
$35K–40K Chevy Bolt
1,852 Nissan Leaf
$30K–35K 1,947 12m
$25K–30K 2,675 units
$20K–25K 1,926
$15K–20K 650
$10K–15K 33
Notes: (a) Trim prices pulled: Tesla Model X, S, Y, 3–Long Range; Porsche Ocean–4S; Rivian R1T–Average; Cadillac Lyriq–N/A; Ford Mustang Mach-E–Premium;
VW ID4–1st Edition; Nissan Leaf–S Plus; Chevy Bolt–LT / Premier Average
(b) Includes all vehicles with more than 1000 units sold in 2020, representing 99.8% of US Light Vehicles sold.
(c) Prices based on “Edmunds Suggests You Pay” price for the middle priced trim of each vehicle.
In other words, cost is still a barrier. And, assuming that prices—about $60 per barrel—a battery pack would need
approximate cost parity with ICE vehicles is required for to cost $100 per kilowatt hour (kWh) to be competitive.
mass market appeal, BEVs still have a way to go—and In 2020, the average EV battery cost $126 per kWh.14
the goal posts keep moving. As Exhibit 10 demonstrates, The median estimate among analysts pegs the average
as long as gas is cheap (and/or battery prices remain battery price at around $100 in 2024.
high), BEVs are at a price disadvantage. At today’s oil
13
Edmunds.com.
14
Source: Battery Pack Prices Cited Below $100/kWh for the First Time in 2020, While Market Average Sits at $137/kWhBloombergNEF, December 16, 2020.
© 2021 KPMG LLP, a Delaware limited liability partnership and a member firm of the KPMG global organization of independent member firms 14
affiliated with KPMG International Limited, a private English company limited by guarantee. All rights reserved.Exhibit 10. When will battery prices fall enough to make EVs competitive with
ICE vehicles?
Breakeven NPV of owning an ICE versus an EV Battery pack cost curve: Analysts projections
with 250 miles of range
250
1000 Median estimate:
EVs are cheaper than ICEs $141 per kWh
900
200
800
Median estimate:
Price of oil ($/bbl)
700
Oil price: 150 $97 per kWh
600 $65
Median estimate:
500 2020 battery price: $126
$71 per kWh
400
100
BNEF’s 2024 projected
300 price of batteries: $94
200 Projected break-even price 50
of oil: $85
100
ICEs are cheaper than EVs
0 0
0 100 200 300 400 500
2019
2020
2021
2022
2023
2024
2025
2026
2027
2028
2029
2030
Cost of batteries ($/KWh)
US DOE BNEF Nomura Research Frost Deutsche Bank
JP Morgan Credit Suisse UBS HSBC Tesla
Note: Oil price as of March 17, 2021
Volkswagen Jefferies Samsung Panasaonic CATL
Sources: BNEF estimate, Greenstone, M. (2020). The Global Energy Challenge:
IHS Markit Median Poly. (Median)
State of the Global Economy. EPIC.
Note: Includes Li-ion battery pack cost or price estimates
Sources: BloombergNEF; US Department of Energy; Deutsche Bank; Nomura
research; JP Morgan; Credit Suisse; UBS; HSBC; Global Lithium-ion Battery
Production and Capacity Expansion, Frost; Tesla, Cleantechnica; VW press
conference; “The Global Energy Challenge”, Michael Greenstone
But solving the technical problems to reduce battery cost to decarbonize by switching to EVs; she estimated that
is only part of the equation. The price—and availability— 98 percent of raw materials needed for a clean economy
of raw materials for EV batteries is another critical are controlled by China.16
variable. There are growing shortages of critical materials
Cost is also a barrier for hydrogen fuel cell vehicles.
such as nickel and lithium.15 And, European Commission
Honda’s Clarity fuel cell vehicle, for example currently
President Ursula von der Leyen recently warned the
leases at almost twice the cost of the company’s
scarcity of raw materials could stymie the EC’s efforts
battery-powered model.17
15
Source: Guy Burdick, “Battery makers face looming shortages of high-quality lithium,”, UtilityDive.com, June 25, 2020.
16
Source: Finbarr Bermingham, “China’s rare earth dominance casts shadow over Europe’s ambitious climate targets,” South China Morning Post, Feb. 26, 2021
17
Source: Avery Thompson, “Where Are All the Hydrogen Cars We Were Promised?,” Popular Mechanics, August 27, 2020.
© 2021 KPMG LLP, a Delaware limited liability partnership and a member firm of the KPMG global organization of independent member firms 15
affiliated with KPMG International Limited, a private English company limited by guarantee. All rights reserved.3. Ecosystem requirements (infrastructure)
The timing of widespread adoption of EVs—whether and distribution network, in addition to a network of
they plug into the electric grid to charge batteries or refueling stations (currently less than 100 hydrogen
use fuel cells that convert hydrogen to electricity—also stations exist in the U.S.).
depends on when the supporting infrastructure for
Based on current EV demand, the market is unlikely to
recharging or refueling is in place. There are 31,753
create charging infrastructure by itself. It will take
public EV charging facilities in the U.S. but, only 4,325
public-sector action, which is now sporadic and localized,
of these have DC fast chargers (with 17,409 outlets).
as well as strategic investments from automakers to
This compares with 168,000 gas stations, which
build out their own charging systems (a move already
typically have eight or more fuel pumps. It is estimated
taken by Tesla).
that it would cost hmore than $2 billion just to equip
homes and workplaces with enough chargers to meet There are other infrastructure issues to overcome
anticipated 2025 needs in 100 top metro areas--and before BEVs can become attractive to most motorists.
many times that to replicate the current U.S. gasoline Home charging is not so simple in large apartment
distribution network.18 blocks in major cities—the markets where EVs are most
likely to catch on (at least initially). Even if apartment
Like battery-powered EVs, hydrogen fuel-cell
owners have an on-site parking space, these are usually
powered vehicles also would have to have their own
not wired.
infrastructure—that is, a hydrogen production, storage,
Exhibit 11. The grid challenge
U.S. summer electricity demand during August
700 Capacity
650
Electricity Demand (GW)
Nighttime capacity
600 can support up
to 80M cars
550
500
Very little capacity
450
to charge from 2–8PM
without additional grid
400 investment
3:00 5:00 7:00 9:00 11:00 13:00 15:00 17:00 19:00 21:00 23:00 1:00
Central Time
Example summer demand Capacity used Capacity available for EV charging
Notes: Summer demand from August 2016
Source: KPMG analysis
18
Source: Jacqueline Toth, “Report: $2.2 Billion Needed to Meet U.S. Electric Car Charging Demand Through 2025,” Morning Consult, August 13, 2019.
© 2021 KPMG LLP, a Delaware limited liability partnership and a member firm of the KPMG global organization of independent member firms 16
affiliated with KPMG International Limited, a private English company limited by guarantee. All rights reserved.Then there is the problem of electric grid. The U.S. grid utility-managed charging is used (Exhibit 11). However,
was not designed for a nation of motorists who arrive there are still bottlenecks in transmission and distribution
home after work every night and plug in their BEVs—or that would require additional investments. Electricity
to provide the surge of power used by commercial quick- infrastructure is a greater barrier to EV adoption in
charge stations. The problem can be partially addressed developing economies, which have some of the world’s
with demand-management systems that would let fastest-growing automotive markets. Rising incomes
utilities coordinate charging times—dynamically (and lower EV costs) will help close the affordability gap.
scheduling individual customers for EV charging hours to
But today, 3.9 billion consumers live in developing
avoid excessive loads. According to KPMG analysis, the
nations with inadequate electric grids (Exhibit 12).19
U.S. has generating capacity to charge 80 million EVs if
When that will change, no one can tell.
Exhibit 12. Emerging economies representing nearly 6.6 billion people who lack
infrastructure and financial means to switch to BEVs
Countries classifed by GDP per capita and grid reliability
Category 2019 Population 2019 Auto sales 2032 Auto sales
Income > $25,000 and high grid reliability 1.0B 44.1M 45.2M
Lower income and/or lower grid reliability 6.6B 45.6M 66.8M
Note: Nearly every country with GDP per capita over $25,000 was classified as having a reliable electrical grid. Of the 6.6B people in low income countries,
2.2B were classified as having reliable electric grids. 3.9b were classified as having unreliable grids and 0.5b were not classified
19
Source: World Bank, World Economic Forum
© 2021 KPMG LLP, a Delaware limited liability partnership and a member firm of the KPMG global organization of independent member firms 17
affiliated with KPMG International Limited, a private English company limited by guarantee. All rights reserved.4. The X factor: What will regulators do?
The choice of non-ICE technology and business sales of ICE vehicles, starting as early as 2025.21 Other
strategy is also driven by regulation—another variable pro-BEV policy measures include industry mandates
that adds a high degree of uncertainty. The internal to automakers to make BEV models available, financial
combustion engine is in the crosshairs of regulators incentives to buyers, subsidized charging infrastructure,
because motor vehicles are a leading source of carbon and campaigns to increase consumer awareness.
emissions. In 2018, greenhouse gas emissions from President Biden has signed an executive order to
transportation accounted for about 28.2 percent of total convert the 600,000-plus federal motor vehicle fleet to
U.S. greenhouse gas emissions, making it the largest zero-emissions technology.22
contributor of U.S. greenhouse gases.20
However, policies can change direction without
With increasing evidence of climate-change impact— notice. In the past 12 years, the U.S. has gone back
and rising political pressure—regulators have gone and forth on support for EVs and other environmental
from limiting carbon emissions across vehicle fleets measures between the Obama, Trump, and Biden
and encouraging BEV adoption to outright ICE bans. administrations—and could flip back again with the next
Seventeen countries have announced mandates to stop election.
Norway builds for EVs
Norway USA India
Norway has the highest EV Population (2020) 5.4 million 331 million 1.3 billion
penetration in the world, with more
Annual auto sales 0.1 million 15.5 million 2.3 million
than 50 percent of 2020 light vehicle
sales being battery electric vehicles. Motorization rate 0.514 0.838 0.041
(vehicles per capita)
The country has invested heavily
on building the infrastructure to GDP per capita (USD) $75,400 $65,300 $2,100
support this transition to EV, with 2
Estimated cost for $5.4 billion $339 billion $1.4 trillion
billion to 3 billion EUR spent through BEV infrastructure ($B)
2018, with another 2 billion EUR
earmarked for the 2018–2029 period. Historical and targeted electric shares of new passenger vehicles
sales – by markets
This represents a total government
Norway Netherlands UK France Canada Germany
investment of roughly $1,800 per 100%
Share of electric vehicles
household or $3,200 per BEV sold
80%
through 2029 based on expected
of new sales
volumes. 60%
California
While these costs are feasible 40%
Japan
for high income countries, they China South Korea
20% India
may be prohibitively expensive for
developing economies. 0%
2010 2015 2020 2025 2030 2035 2040 2045 2050
Source: Update on the global transition to electric vehicles through 2019, The International Council on
Clean Transportation.
20
Sources of Greenhouse Gas Emissions.
U.S. Environmental Protection Agency.
21
Source: Actions by countries to phase out internal combustion engines, theclimatecenter.org.
22
Sarah Kaplan, “Biden wants an all-electric federal fleet. The question is: How will he achieve it?,” The Washington Post, January 28, 2021.
© 2021 KPMG LLP, a Delaware limited liability partnership and a member firm of the KPMG global organization of independent member firms 18
affiliated with KPMG International Limited, a private English company limited by guarantee. All rights reserved.Strategy for an 3
uncertain future
The automotive business is morphing. For all its build them—or whether to farm out manufacturing
complexity—with global supply chains feeding thousands entirely. These decisions are being made under great
of parts to networks of assembly plants—the automotive uncertainty and require a dynamic and flexible process:
business was a mature industry. Everybody was making What do you have to believe to make a billion-dollar bet
cars using ICE technology and they all used similar on a particular EV technology or market segment? What
operating models. Now, the industry is becoming a needs to happen to make this scenario come true? How
mosaic of multiple possibilities—and risks. The strategic does this vary by country and market segment? What
choices have multiplied: companies have to reconsider happens if conditions change?
what models to build, how to design them, where to
Exhibit 13. What do you have to believe?
Mosaic
scenario
drivers
(what you
would have Consumer Economics Technology Ecosystem Regulatory
to believe): acceptance evolution requirements mandates
U.S.
Europe
China
Time Current Five Years Ten Years Fifteen Years
© 2021 KPMG LLP, a Delaware limited liability partnership and a member firm of the KPMG global organization of independent member firms 19
affiliated with KPMG International Limited, a private English company limited by guarantee. All rights reserved.Companies must not only place big bets on fuel/ up around ICE may be less relevant. There may be more
powertrain combinations, they must also think about opportunities to partner and outsource.
how they will function in the new automotive business.
To craft strategy in this environment, companies need
There will be new operating and business model
new approaches. They need ways to move ahead even in
choices. There will be new profit pools and the industry
the face of irreducible uncertainties. And, they need the
structure—and the structure of individual players—will
flexibility to adapt to surprises along the way.
change to fit the new business. Assets that were built
Key questions for OEMs, suppliers,
and other players to ask
What is a realistic range of scenarios for industry end-states, as a function of consumer acceptance,
1
economics, technology, infrastructure, and regulation, under which we would make different investment
decisions?
2 What are the resulting mosaic(s) for each scenario?
3 For each scenario:
— What is my competitive positioning now and in the future?
— What is my strategic posture do I want to adopt?
— What capital investments do I need to make?
4 Looking across the scenarios, what decisions, investments, and actions are common? (no-regrets)
5 What are the high commitment decisions that require additional diligence?
6 How can I better understand these decisions?
— War gaming
— Agent based modelling / game theory
7 Where should I go-it-alone or partner, or should I acquire?
Preparing for structural change
The end of a single focus on ICE and the emergence The most obvious change is the influx of new
of the mosaic is setting off structural change across competitors. For the first time in decades, barriers
the automotive industry. Old value chains are being to entry have fallen. Agile, well-funded startups such
shattered and new operating models are appearing. as Rivian, Lucid, Fisker, Nio, and Xpeng Lordstown
Supply chains are being reconfigured and companies are and many more are staking their claims. The new
re-examining their portfolios of businesses and assets. competition also includes tech giants such as Alphabet,
They have new choices about production, from vertical Amazon and Apple.
integration to contract manufacturing. They have new
The transition to EVs is also creating new production
choices of distribution models—from selling direct to
models. Fisker has outsourced production of
maintaining dealer networks.
current designs to Magna International and recently
© 2021 KPMG LLP, a Delaware limited liability partnership and a member firm of the KPMG global organization of independent member firms 20
affiliated with KPMG International Limited, a private English company limited by guarantee. All rights reserved.announced a deal to partner with Foxconn, the contract but founder Elon Musk maintains this it will allow the
manufacturing giant that makes iPhones.23 The company company to keep ahead of competitors in an increasingly
says Foxconn will produce 250,000 units per year competitive business.25
starting in 2023. Foxconn, which has previously signed
EVs are also bringing structural change to auto retailing.
a deal with China’s Byton and Zhejiang Geely Holding
The vast majority of new entrants are selling direct.
Group, and the Fiat Chrysler unit of Stellantis, says it is
Moreover, EVs could further endanger the economics
considering Wisconsin and Mexico for EV plant sites.24
of legacy dealer networks. EVs have few moving parts
On the other hand, Tesla has declared its intention to compared with ICE vehicles (20 parts in a powertrain
be as vertically integrated as possible. It fabricates vs. thousands in an ICE engine), requiring requires
everything from batteries to seats and builds its own much less maintenance. That threatens one of their
production equipment. The company is even investing last reliable sources sources of dealer profits—service
in a network of quick charging stations. It’s a costly bet, and parts.26
Exhibit 14: Three value-chain approaches
Traditional OEM
Sales/
Design Fabrication Assembly Marketing Aftersales
distribution
Tesla
Mining/ Refining/ Sales/
Design Fabrication Assembly Marketing Aftersales Charging
extraction processing distribution
Asset light startup
Sales/
Design Fabrication Assembly Marketing Aftersales Charging
distribution
Performed by OEM Limited OEM involvement
23
Source: Akanksha Rana, Ben Klayman, Apple supplier Foxconn teams up with Fisker to make electric vehicles, Reuters, February 24, 2021.
24
Source: Yimou Lee, “Foxconn eyes EVs for troubled Wisconsin plant, may go to Mexico,” Reuters, March 16, 2021.
25
Source: “Elon Musk Explains Tesla’s Vertical Integration Vs ‘Catalog Engineering,’” InsideEVs, October 22, 2020.
26
Source: The future of automotive retailing, KPMG 2020
© 2021 KPMG LLP, a Delaware limited liability partnership and a member firm of the KPMG global organization of independent member firms 21
affiliated with KPMG International Limited, a private English company limited by guarantee. All rights reserved.Exhibit 15. Lower EV maintenance requirements could cut aftermarket revenue
EVs have lower maintenance cost vs ICEs... And up to 60% less aftermarket revenue as EV
Comparison of total annual maintenance of Chevy penetrates market
Bolt and VW Gold ($ maintenance cost per year) Reduction in aftermarket revenue for various levels
of BEV penetration
EV Market Share
10% 20% 30% 40% 50% 60% 70% 80% 90% 100%
1,000 0%
VW Golf
900
Aftermarket Revenue Decline
Total annual -10%
800 maintenance:
700 $610
-20%
600 Chevy Bolt
500 Total annual -30%
400 maintenance:
$255 -40%
300
200 -50%
100
0 -60%
Parts replacement (incl. service) Inspection (preventative)
Liquids (incl. service)
Source: UBS estimates Source: UBS Auto
When to bet: timing is everything
As always, timing will be critical for successful strategy.
The shift to electric power trains and the unwinding of
existing ICE capacity will be non-linear—adoption will
accelerate quickly once the proverbial tipping point of for
EVs is reached. But it is still difficult to determine when
that tipping point might occur.
Start-ups can race into the future now—indeed, that’s
what they’re all about. But incumbents need to sustain
their core businesses. This will require a delicate
balancing act. Companies need to determine when to
commit to new technologies and how to safely unwind
ICE capacity. Based on their customers and geographic
footprints, some incumbents might see significant first-
mover advantages. Others could conclude that it makes
more sense to be the fast follower.
© 2021 KPMG LLP, a Delaware limited liability partnership and a member firm of the KPMG global organization of independent member firms 22
affiliated with KPMG International Limited, a private English company limited by guarantee. All rights reserved.Emerging strategic postures
In this environment, companies can choose from a Volkswagen MEB EV platforms a year in 2028. And,
range of strategic postures: arguably the Stellantis merger of Peugeot and Fiat
Chrysler is intended in part to share the costs of the
Reserving multiple options. Toyota may be the best
transition to EVs. And more consolidation is likely.
example of this posture. The company is investing in
multiple strategies across the mosaic, reflecting Toyota’s
position as the most global player, serving markets
such as India and Indonesia as well as Japan, the U.S.
and Europe. It has been a market leader in hybrids and The infrastructure needed to support a fleet
is developing plug-in EVs as well as fuel-cell models. consisting entirely of EVs would cost Japan
In the home market, Toyota President Akio Toyoda has between ¥14 trillion and ¥37 trillion, the equivalent
been sharply critical of a possible government mandate of $135 billion to $358 billion.
to end ICE production, which he said would cause the
Toyota President Akio Toyoda, the Wall Street Journal,
Japanese auto industry to collapse. He also estimates
Dec. 17, 2020.
that “the infrastructure needed to support a fleet
consisting entirely of EVs would cost Japan between
¥14 trillion and ¥37 trillion, the equivalent of $135 billion Scaled-down to focus. In February, Daimler-Benz
to $358 billion.”27 announced what Chairman Ola Källenius called “a
profound reshaping” of the company to position itself as
Market shaper. GM signaled its strategy on January
the leader in electric luxury cars. The company plans to
2021, when CEO Mary Barra declared that GM will
separate its truck business, which will focus on fuel-cell
end production of ICE vehicles in 2035. In effect, this
electric and self-driving trucks. Mercedes will focus on
announcement says that GM plans to lead the shift
hybrids and EV passenger cars.
to electric versions of the cars, trucks and SUVs that
Americans buy today.28 Supplier strategies. Tier 1 parts suppliers also have
to consider new strategic postures. Can they compete
in the new world of batteries, electronics, and electric
motors? Or will they go for more scale in the traditional
parts business—adopt a “last man standing” strategy
We’ll offer EVs across all of our brands and and buy up competitors? BorgWarner, for example,
at price points and span the global EV market recently completed the acquisition of Dephi Technologies
from the Wuling Hong Guang Mini to the to strengthen its position in electric powertrains and
Cadillac CELESTIQ. electronics, and has announced plans to acquire German
GM CEO Mary Barra, Feb. 10, 2021 earnings call battery maker AKASOL. Other parts suppliers—Johnson
Controls, for example—have concluded it’s a good time
to exit the business.
Partnering to share the cost and risk. Then there The choice of strategic posture will depend both on
are unprecedented strategic partnerships. In 2019, judgments about how and where to play in the new
Ford and Volkswagen joined forces in a global alliance business and the company’s “path dependence”—the
to collaborate on an EV platform that will be used by history, distinctive capabilities market position and
both companies. They are pooling the risks of platform assets that each organization has. Companies need to
development and expect to be produce 15 million be realistic about which choices are within their grasp.
27
Source: Toyota’s Chief Says Electric Vehicles Are Overhyped,” Peter Landers, The Wall Street Journal, Dec. 17, 2020.
28
Source: ?
© 2021 KPMG LLP, a Delaware limited liability partnership and a member firm of the KPMG global organization of independent member firms 23
affiliated with KPMG International Limited, a private English company limited by guarantee. All rights reserved.How to make strategic decisions
amid uncertainty
Traditionally, automotive strategy has dealt with known or are ineffective. In this end state, mass EV adoption
knowns (business as usual) and knowable unknowns— would occur much later. So, clearly, an automaker would
like how sales of various vehicles will behave under make different decisions under one scenario versus the
different economic conditions. But to place bets on the other another.
future industry (the mosaic), auto company strategists
To make large, difficult-to-reverse decisions, companies
must work increasingly in the realm of the unknowable.
will need to use a structured approach like the mosaic to
Right now, the biggest bets appear to be on a scenario identify a handful of plausible scenarios. If you believe
in which battery technology continues to evolve on a costs will not come down rapidly what is the scenario
predictable curve: manufacturing costs come down, for BEV market evolution? What do you have to believe
range goes up, BEV sales acclerate. This scenario also about charging infrastructure? Based on your beliefs
seems to assume supportive government policy for EV about EV adoption, what are your assumptions about
adoption. the ICE business? Once you have sketched out several
alternative scenarios, then you can use simulations
But there can be other plausible scenarios in which the
and other analytical tools to assign probabilities and
opposite is true—where technology stalls, costs keep
determine the most likely scenarios.
consumers away, and government incentives disappear
Conclusion
A new automotive game is commencing and companies inform critical decisions about where to invest, how
need to place their bets. For many companies, betting much to invest, when to go it alone, when to partner,
wrong now could have life-and-death consequences. and when to make your move.
In this paper we have highlighted the idea of the
Our goal has been to encourage automotive executives
mosaic as a way to analyze how various factors could
and their strategy teams to create their own vision
determine the outcome as the reign of ICE technology
of the future industry, based on sober, data-driven
begins to wane. We believe it’s a useful tool for breaking
analysis—of both the automotive market and of the value
down complex problems into manageable parts. It
of the assets and capabilities that their organizations
helps you find answers to the critical questions about
bring to the new automotive game. These are the most
consumer behavior, economics, technology, regulation,
consequential decisions this generation of automotive
infrastructure needs, etc. These answers can help
leaders will make. Place your bets wisely.
© 2021 KPMG LLP, a Delaware limited liability partnership and a member firm of the KPMG global organization of independent member firms 24
affiliated with KPMG International Limited, a private English company limited by guarantee. All rights reserved.You can also read