Predicting hospitalisations related to ambulatory care sensitive conditions with machine learning for population health planning: derivation and ...
←
→
Page content transcription
If your browser does not render page correctly, please read the page content below
Open access Original research
Predicting hospitalisations related to
BMJ Open: first published as 10.1136/bmjopen-2021-051403 on 1 April 2022. Downloaded from http://bmjopen.bmj.com/ on June 21, 2022 by guest. Protected by copyright.
ambulatory care sensitive conditions
with machine learning for population
health planning: derivation and
validation cohort study
Seung Eun Yi,1,2 Vinyas Harish,3,4,5,6 Jahir Gutierrez,1 Mathieu Ravaut,7
Kathy Kornas,3 Tristan Watson,3,8 Tomi Poutanen,1 Marzyeh Ghassemi,2,6
Maksims Volkovs,1 Laura C Rosella 3,4,5,6,8,9
To cite: Yi SE, Harish V, ABSTRACT
Gutierrez J, et al. Predicting Strengths and limitations of this study
Objective To predict older adults’ risk of avoidable
hospitalisations related hospitalisation related to ambulatory care sensitive
to ambulatory care ► The study is based on a large and highly diverse
conditions (ACSC) using machine learning applied to
sensitive conditions with cohort, with a wide range of features to predict the
administrative health data of Ontario, Canada.
machine learning for risk of hospitalisation for ambulatory care sensitive
population health planning: Design, setting and participants A retrospective
conditions (ACSCs).
derivation and validation cohort study was conducted on a large cohort of all
► The model is designed in a way it can be deployed
cohort study. BMJ Open residents covered under a single-payer system in
in a real-world setting at relatively low cost, using
2022;12:e051403. doi:10.1136/ Ontario, Canada over the period of 10 years (2008–
available administrative health data.
bmjopen-2021-051403 2017). The study included 1.85 million Ontario residents
► A rigorous calibration evaluation was conducted
between 65 and 74 years old at any time throughout the
► Prepublication history and globally and across subgroups to validate the ro-
additional supplemental material study period.
bustness of our model.
for this paper are available Data sources Administrative health data from Ontario,
► The definition of ACSCs varies across different juris-
online. To view these files, Canada obtained from the (ICES formely known as the dictions, even though the set of conditions used in
please visit the journal online Institute for Clinical Evaluative Sciences Data Repository. this study is common in most definitions.
(http://dx.doi.org/10.1136/ Main outcome measures Risk of hospitalisations due to ► The model does not have access to some key indi-
bmjopen-2021-051403). ACSCs 1 year after the observation period. cators of patients’ health and behavioural status (eg,
Results The study used a total of 1 854 116 patients, smoking, body mass index), known to be important
Received 18 May 2021
split into train, validation and test sets. The ACSC determinants of ACSC risks.
Accepted 28 February 2022
incidence rates among the data points were 1.1% for
all sets. The final XGBoost model achieved an area
under the receiver operating curve of 80.5% and an
area under precision–recall curve of 0.093 on the test INTRODUCTION
set, and the predictions were well calibrated, including Health systems globally strive to provide
in key subgroups. When ranking the model predictions, quality care in alignment with the Quadruple
those at the top 5% of risk as predicted by the model Aim.1 2 Ambulatory care sensitive condi-
captured 37.4% of those presented with an ACSC- tions (ACSCs) are a useful indicator of
related hospitalisation. A variety of features such as the
health system performance often used to
previous number of ambulatory care visits, presence of
ACSC-related hospitalisations during the observation
support Quadruple Aim efforts. Reducing
window, age, rural residence and prescription of the burden of ACSCs is an opportunity to
certain medications were contributors to the prediction. promote higher value care by avoiding the
© Author(s) (or their Our model was also able to capture the geospatial usage of unnecessary hospital and health
employer(s)) 2022. Re-use
heterogeneity of ACSC risk in Ontario, and especially the system resources.3 ACSCs refer to condi-
permitted under CC BY-NC. No
commercial re-use. See rights elevated risk in rural and marginalised regions. tions that can be managed in primary care
and permissions. Published by Conclusions This study aimed to predict the 1-year settings, and thus hospitalisation for these
BMJ. risk of hospitalisation from ambulatory-care sensitive conditions is considered potentially avoid-
For numbered affiliations see conditions in seniors aged 65–74 years old with a able with adequate primary care.4 The list of
end of article. single, large-scale machine learning model. The model the conditions considered to be ACSCs varies
shows the potential to inform population health planning
Correspondence to by country but commonly includes major
and interventions to reduce the burden of ACSC-related
Dr Laura C Rosella; chronic diseases.5–7 For example, in Canada,
hospitalisations.
laura.rosella@utoronto.ca ACSCs comprise angina, asthma, chronic
Yi SE, et al. BMJ Open 2022;12:e051403. doi:10.1136/bmjopen-2021-051403 1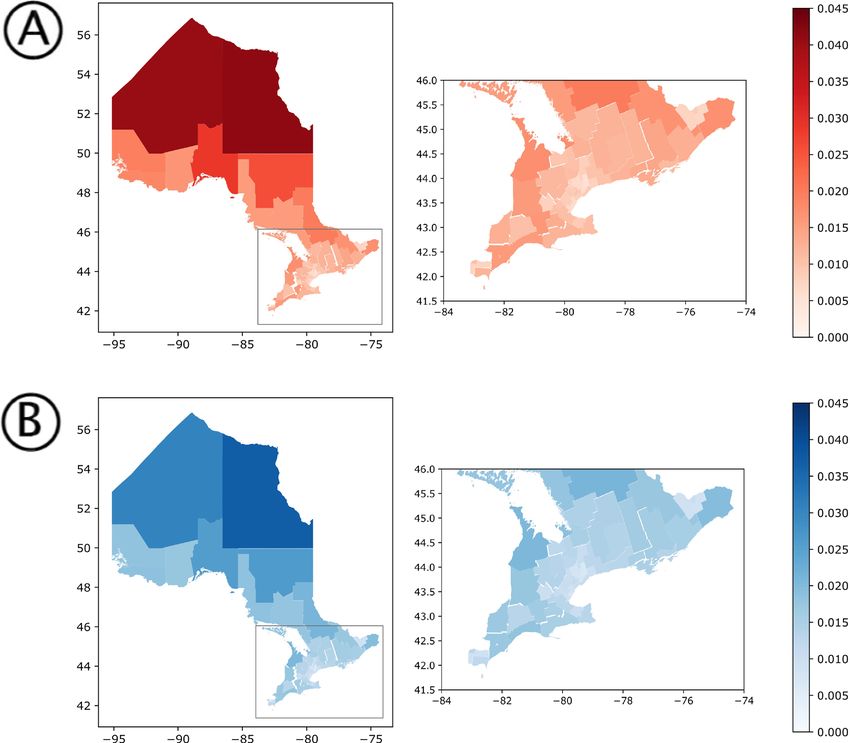
Open access
obstructive pulmonary disease (COPD), diabetes, epilepsy are also available for large portions of the population
BMJ Open: first published as 10.1136/bmjopen-2021-051403 on 1 April 2022. Downloaded from http://bmjopen.bmj.com/ on June 21, 2022 by guest. Protected by copyright.
and heart failure (HF).8 Outcomes with respect to these in countries with private healthcare systems such as the
ACSCs are often used to measure how a health system USA. Consequently, we believe that with sufficient adap-
specifically supports individuals with chronic diseases.9 tation, our proposed approach has wide applicability
Although only 0.4% of Canadians under the age of 75 for assessing the risk of ACSCs in the population using
have an ACSC-related hospitalisation, these events use routinely collected data.
nearly 11% of hospital bed days.10 In the UK, emergency The specific aim of this study is to develop and internally
admissions account for 67% of all hospital days, costing validate a single, large-scale, machine learning model
£12.5B annually, most of which are considered prevent- to predict hospitalisations due to ACSCs in a cohort of
able.11 ACSCs have increased by 47% over the last 15 1.85 million older adults in Ontario, Canada. Ontario’s
years (as of 2017) and account for one in five unplanned population is large, diverse and covered under a single-
admissions.12 Furthermore, older adults disproportion- payer system.30 31 We extracted a wide variety of features
ately experience ACSCs. For example, adults over 65 from Ontario’s comprehensive AHD databases including
represented 69.1% of all ACSCs in Ireland in 2016.13 and sociodemographics, prescribed medications, insurance
more than half of ACSCs in Canada were from individuals claims from physician’s visits and hospitalisations, as
over 60 years old.10 Therefore, reducing ACSCs represent well as laboratory values. We evaluated model perfor-
a challenge in health systems around the world and pose mance including discrimination, calibration and report
an increasing burden for health systems as rates of multi- on the top contributing features. We finally conducted
morbidity continue to rise.14 15 a geographical analysis to demonstrate how the model
Hospitalisations due to ACSCs are also strongly related captures risk distribution in the population and thus
to socioeconomic status, even in settings of universal can be used for guiding population health planning and
health coverage. Studies in Canada, the UK, the USA and community-based interventions.
Ireland16–19 have demonstrated the association between
low socioeconomic status (often measured through area-
level deprivation measures) and higher rates of ACSCs. METHODS
As these ACSC disparities can be due to systems- level Data sources
barriers, a number of community- based interventions We used AHD from Ontario, Canada which we obtained
such as pay for performance schemes or multidisciplinary from ICES, an independent, non-profit research institute
programmes to prevent readmissions have been proposed whose legal status under Ontario’s health information
to potentially reduce the rates of these hospitalisations.20 privacy law allows it to collect and analyse healthcare and
There is a need to develop tools for predicting the admis- demographic data, without consent, for health system
sions that are most likely to be preventable to guide the evaluation and improvement.32 Ontario, with a popula-
deployment of such interventions or to target resources tion of 14.7 million people as of April 2020,31 is Cana-
to optimise impact.20 21 Risk prediction algorithms devel- da’s most populous province with close to 250 reported
oped on big data sources such as electronic medical ethnicities (2016 Census30), making it one of the most
records and routinely collected administrative health diverse in the world. The vast majority of Ontario resi-
data (AHD) offer the ability to segment populations dents are eligible for universal health coverage, leading to
over space and time based on their likelihood of having highly comprehensive and representative records. Besides
an outcome of interest,22 which can be used as an input demographic information, the records from ICES include
to optimise outcomes. AHD are comprehensive, widely linked claims data that are routinely collected every time
available and automatically generated based on interac- a patient interacts with the healthcare system. To link all
tions with the healthcare system. Furthermore, in certain attributes for each patient, we used a unique identifica-
settings, these data can be linked with other data sources tion number assigned to each individual at the Registered
(eg, environmental exposures, area-level measures of the Persons Database (RPDB). All analyses were carried out
social determinants of health, etc).23 24 These character- on the Health AI Data Analytics Platform, which enables
istics make them particularly appealing for developing high performance computing in a secure environment to
risk prediction algorithms that can be deployed at the protect patient privacy. All datasets used from the ICES
level of populations for health system planning. While data repository are listed in online supplemental tables 1
there is an increasing number of risk prediction models and 2. These datasets were linked using unique encoded
intended for clinical use in individuals in an ambulatory identifiers and analysed at ICES.
setting,25–28 there are few examples of a single, unified
model that can be deployed on routinely collected data Cohort
to regularly support population health and health system Our study period spanned a 10- year window from 1
management.29 Databases with analogous AHD are avail- January 2008 through 31 December 2017. As older adults
able in most single- payer healthcare systems such as are disproportionately affected by ACSCs,10 we only
the UK, Australia and New Zealand. However, access to included patients who were between 65 and 74 years of
extensive medical records is not limited to single-payer age at any point during the 10-year study period (see
countries. Databases of commercial insurance claim data figure 1A) and who were covered under Ontario Health
2 Yi SE, et al. BMJ Open 2022;12:e051403. doi:10.1136/bmjopen-2021-051403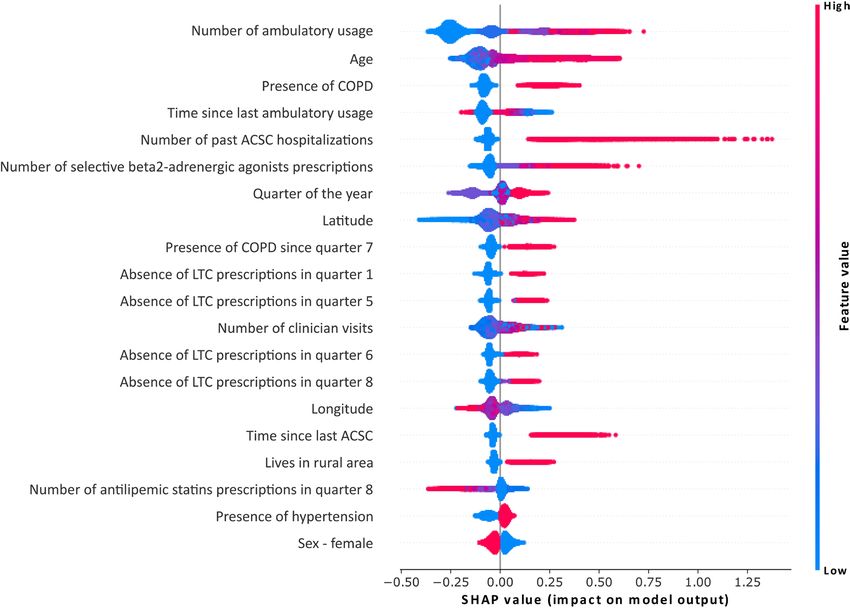
Open access
BMJ Open: first published as 10.1136/bmjopen-2021-051403 on 1 April 2022. Downloaded from http://bmjopen.bmj.com/ on June 21, 2022 by guest. Protected by copyright.
Figure 1 Overview of the data preparation. Panel A shows the patient selection process. For a given patient, only the
information when they are between 65 and 74 years old was kept and the rest was discarded. This was done for the whole
study period (between 2008 and 2017, included). Panel B then shows the construction of instances for the eligible patients—
each instance consisted of 2 years of observation window, 1 year of buffer where we did not have any information about the
patient, and 3 months of target window. This instance was therefore a summary of the patient health information. Note that one
patient could generate multiple instances. The first instance had an observation window from January 2008 to December 2009,
a buffer from January 2010 to December 2010 and a target window from January 2011 to March 2011, all included. The last
instance had an observation window from October 2014 to September 2016, a buffer from October 2016 to September 2017
and a target window from October 2017 to December 2017, all included. Instances for the same patient did not share any time
period of the target window with each other, meaning each patient could have a maximum of 28 instances with non-overlapping
target widows. This was often not the case due to the exclusion criteria and the individuals not fitting the age group of 65–74
years old anymore. For model development, as shown in panel C, we split our data based on patients and study period. We
trained and validated our prediction model with data between 2008 and 2014, on two different sets of patients. Then, we tested
the model on two types of data: data of the patients who were already used for training and validation between 2014 and 2018,
and data of the patients who entered the cohort in 2014 and onwards. The latter consisted of ‘young’ patients between 65 and
66 years old at the beginning of the observation period. Finally, panel D shows the types of information that was extracted from
each patient. ACSC, ambulatory care sensitive condition; LHIN, Local Health-Integrated Network.
Insurance Plan. Baseline characteristics of the patients 3-month period where we assess the risk of hospitalisa-
included in our cohort are shown in table 1. The meth- tion due to an ACSC (target window). We used 2 years of
odology used to extract and prepare patient data is illus- patient history to collect enough information about the
trated in figure 1. patient and calculate predictor variables. Having a 1-year
buffer period ensured that we are forecasting the risk of
Study design
As shown in figure 1B, each patient’s timeline of interac- future preventable hospitalisations, as opposed to clas-
tions with the healthcare system was broken down into sifying whether or not a preventable hospitalisation has
instances. Each instance comprised three components: 2 occurred within a current instance. The 3-month target
years of patient history (observation window), 1 year during window was selected due to the update frequency of
which we did not extract any information (buffer) and a administrative data at ICES, which also takes place every
Yi SE, et al. BMJ Open 2022;12:e051403. doi:10.1136/bmjopen-2021-051403 3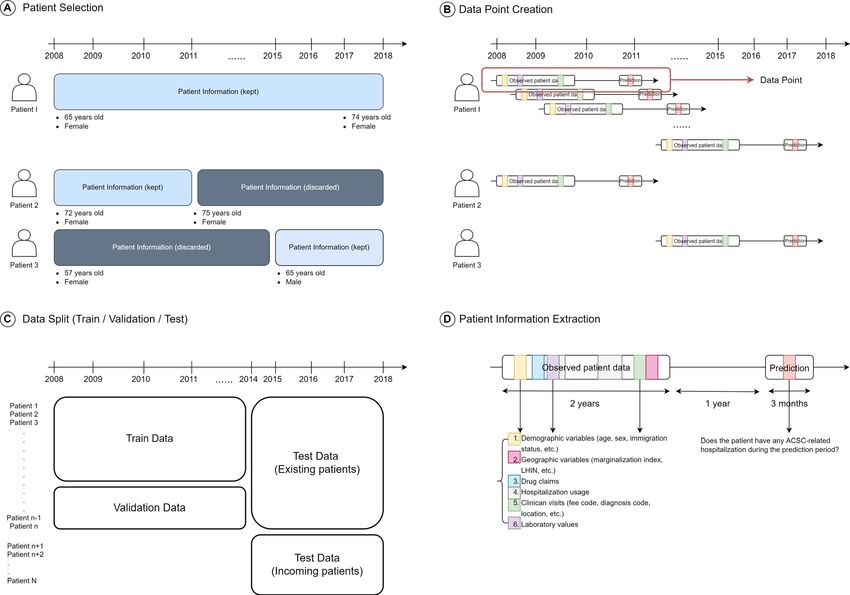
4
Table 1 Characteristics of the patients in the study
Train Validation Test
Total Positives Total Positives Total Positives
Cohort
Open access
Unique patients 1 237 507 119 728 309 380 30 224 1 375 277 80 788
Data points 16 923 230 180 152 4 225 605 45 571 9 862 034 104 676
Demographics
Sex (F) 8 845 443 (52.3%) 93 333 (51.8%) 2 213 395 (52.4%) 23 542 (51.7%) 5 153 174 (52.3%) 54 368 (51.9%)
Sex (M) 8 077 787 (47.7%) 86 819 (48.2%) 2 012 210 (47.6%) 22 029 (48.3%) 4 708 860 (47.7%) 50 308 (48.1%)
Age (mean) 69.0±2.86 69.1±2.88 69.0±2.86 69.1±2.87 69.0±2.81 69.1±2.84
Immigrant 1 619 193 (9.57%) 16 686 (9.26%) 405 211 (9.59%) 4007 (8.79%) 1 071 959 (10.9%) 10 878 (10.4%)
Non-immigrant 15 304 037 (90.4%) 163 466 (90.7%) 3 820 394 (90.4%) 41 564 (91.2%) 8 790 075 (89.1%) 93 798 (89.6%)
Geography
Rural 2 479 688 (14.7%) 29 056 (16.1%) 616 941 (14.6%) 7069 (15.5%) 1 340 756 (13.6%) 15 499 (14.8%))
Income quintile
1st quintile 2 982 780 (17.6%) 33 814 (18.8%) 736 716 (17.4%) 8612 (18.9%) 1 842 945 (18.7%) 20 940 (20.0%)
2nd quintile 3 335 222 (19.7%) 36 536 (20.3%) 835 276 (19.8%) 8847 (19.4%) 2 007 802 (20.4%) 21 849 (20.9%)
3rd quintile 3 351 614 (19.8%) 35 237 (19.6%) 838 012 (19.8%) 9043 (19.8%) 1 997 302 (20.3%) 21 266 (20.3%)
4th quintile 3 507 494 (20.7%) 36 756 (20.4%) 882 844 (20.9%) 9421 (20.7%) 1 913 979 (19.4%) 19 838 (19.0%)
5th quintile 3 702 063 (21.9%) 37 314 (20.7%) 921 278 (21.8%) 9521 (20.9%) 2 084 008 (21.1%) 20 613 (19.7%)
Education quintile
1st quintile 3 075 278 (18.2%) 34 957 (19.4%) 762 687 (18.0%) 8779 (19.3%) 1 706 122 (17.3%) 19 391 (18.5%)
2nd quintile 3 385 511 (20.0%) 37 128 (20.6%) 841 692 (19.9%) 9481 (20.8%) 1 937 907 (19.7%) 21 469 (20.5%)
3rd quintile 3 493 804 (20.6%) 36 945 (20.5%) 870 402 (20.6%) 9190 (20.2%) 2 030 870 (20.6%) 21 454 (20.5%)
4th quintile 3 500 217 (20.7%) 36 902 (20.5%) 877 965 (20.8%) 9299 (20.4%) 2 084 940 (21.1%) 21 550 (20.6%)
5th quintile 3 357 516 (19.8%) 33 022 (18.3%) 844 839 (20.0%) 8485 (18.6%) 2 034 100 (20.6%) 20 045 (19.1%)
Comorbidities
Acute Myocardial Infarction 709 309 (4.19%) 9667 (5.37%) 177 912 (4.21%) 2507 (5.50%) 416 924 (4.23%) 5696 (5.44%)
Arrythmia 1 530 096 (9.04%) 18 798 (10.4%) 382 872 (9.06%) 4891 (10.7%) 914 621 (9.27%) 10 990 (10.5%)
Arthritis 354 214 (2.09%) 4455 (2.47%) 89 539 (2.12%) 1113 (2.44%) 225 636 (2.29%) 2719 (2.60%)
Asthma 2 034 989 (12.0%) 26 649 (14.8%) 508 111 (12.0%) 7.093 (15.6%) 1 246 159 (12.6%) 16 445 (15.7%)
Cancer 2 198 985 (13.0%) 25 044 (13.9%) 546 554 (12.9%) 6210 (13.6%) 1 317 439 (13.4%) 14 662 (14.0%)
Chronic heart failure 838 537 (4.95%) 14 327 (7.95%) 210 965 (4.99%) 3672 (8.06%) 483 842 (4.91%) 7974 (7.62%)
Colitis 133 502 (0.79%) 1575 (0.87%) 32 232 (0.76%) 389 (0.85%) 88 715 (0.90%) 1018 (0.97%)
Continued
Yi SE, et al. BMJ Open 2022;12:e051403. doi:10.1136/bmjopen-2021-051403
BMJ Open: first published as 10.1136/bmjopen-2021-051403 on 1 April 2022. Downloaded from http://bmjopen.bmj.com/ on June 21, 2022 by guest. Protected by copyright.Table 1 Continued
Train Validation Test
Total Positives Total Positives Total Positives
Chronic Obstructive 2 910 066 (17.2%) 40 751 (22.6%) 726 976 (17.2%) 10 396 (22.8%) 1 726 397 (17.5%) 23 837 (22.8%)
Pulmonary Disease
Coronary heart disease 3 510 361 (20.7%) 43 579 (24.2%) 879 995 (20.8%) 11 068 (24.3%) 1 899 361 (19.3%) 23 359 (22.3%)
Dementia 344 161 (2.03%) 4454 (2.47%) 86 853 (2.06%) 1158 (2.54%) 206 300 (2.09%) 2722 (2.60%)
Yi SE, et al. BMJ Open 2022;12:e051403. doi:10.1136/bmjopen-2021-051403
Diabetes 4 394 754 (26.0%) 52 155 (29.0%) 1 095 489 (25.9%) 13 022 (28.6%) 2 660 592 (27.0%) 30 929 (29.5%)
Hypertension 10 494 913 (62.0%) 116 393 (64.6%) 2 622 675 (62.1%) 29 352 (64.4%) 6 033 618 (61.2%) 67 044 (64.0%)
Mental disorder* 3 410 850 (20.2%) 40 032 (22.2%) 851 249 (20.1%) 10 117 (22.2%) 2 244 412 (22.8%) 26 407 (25.2%)
Mood disorder 7 786 874 (46.0%) 85 908 (47.7%) 1 943 700 (46.0%) 21 771 (47.8%) 4 801 635 (48.7%) 52 944 (50.6%)
Osteoarthritis 10 244 732 (60.5%) 111 020 (61.6%) 2 553 893 (60.4%) 28 336 (62.2%) 6 131 185 (62.2%) 66 621 (63.6%)
Osteoporosis 1 791 824 (10.6%) 18 620 (10.3%) 450 339 (10.7%) 4656 (10.2%) 1 032 043 (10.5%) 10 525 (10.1%)
Renal failure 727 558 (4.30%) 10 545 (5.85%) 180 987 (4.28%) 2698 (5.92%) 489 046 (4.96%) 7004 (6.69%)
Stroke 965 743 (5.71%) 12 601 (6.99%) 239 406 (5.67%) 3122 (6.85%) 547 368 (5.55%) 7026 (6.71%)
Total (median) 3 (2, 7) 3 (2, 5) 3 (2, 4) 3 (2, 5) 3 (2, 5) 3 (2, 5)
*History of mental health-related visit, excluding dementia, deliberate self-harm codes and mood disorder codes.
COPD, chronic obstructive pulmonary disease.
Open access
5
BMJ Open: first published as 10.1136/bmjopen-2021-051403 on 1 April 2022. Downloaded from http://bmjopen.bmj.com/ on June 21, 2022 by guest. Protected by copyright.Open access
3 months. This mimicked a system where we ‘screen’ a clinician visits, hospital usage, laboratory results, as well
BMJ Open: first published as 10.1136/bmjopen-2021-051403 on 1 April 2022. Downloaded from http://bmjopen.bmj.com/ on June 21, 2022 by guest. Protected by copyright.
population quarterly for the risk of potentially avoidable as past history of ACSCs (see figure 1D). In order to select
hospitalisations 1 year in the future. the most important features for the model and reduce
We split our cohort into three different sets (see the likelihood of overfitting, we took a forward feature
figure 1C). The training and validation sets had distinct selection-based approach33 to only select a small subset
patients, which ensures that we tested the ability of the from thousands of available features that would ensure
model to generalise well on unseen patients. Both sets the performance of the model closely matches that of the
included target windows from January 2011 to December model using all features. We ended with 140 features in
2015. As for the test set, it included all instances of patients total. Details of the feature preparation as well as the full
that have a valid target window between January 2016 and list of the features are outlined in online supplemental
December 2017. Therefore, two types of patient groups table 4.
are included in this test set: those from the training and
validation sets who still qualify at a future period of time, Model development and evaluation
and patients who were under 65 years old prior to 2016 Our prediction model is a gradient boosting decision
but who qualify for the test time period. The model perfor- tree-based model, optimised using the XGBoost library in
mance on the test set thus indicated how well the model Python.34 35 These models have been empirically shown
generalises to patients out of time and to new patients (ie, as computationally efficient and high-performance algo-
in-domain, in-distribution generalisation). rithms for tabular data through a number of machine
learning competitions as well as in machine learning
Inclusion and exclusion criteria for health papers.36 These models are able to select and
Our cohort included all residents of Ontario between 65 combine heterogeneous features from multiple data
and 74 years old during the study period. Anyone who sources that are often uncorrelated, and are thus effi-
became 65 during any given time of the study period was cient when both categorical and continuous variables
included in the study cohort, for example, those who with different value ranges are present in the data. More-
turned 65 in January 2017 were included in our test set, as over, they can implicitly handle missing values without
shown in figure 1. We excluded instances of patients who imputation. Therefore, we did not impute missing data.
died or ended all interaction with the healthcare system We undersampled the negative instances of the training
before the end of the observation window. This was to data by a factor of 8, to reduce class imbalance.37 This
ensure that we excluded patients who were by definition undersampling factor was chosen empirically over a grid
known to not have an outcome. We still include patients search. Validation and the test sets were left untouched to
who die during the buffer period or the prediction period ensure an accurate evaluation of the model performance.
when training the model, being consistent with the fact The details of the model’s hyperparameters as well as
that the model cannot know any future events outside of its performance comparison against a baseline logistic
the observation period. regression model are presented in online supplemental
methods 1 and 2, as well as in online supplemental table
Outcome of interest 5 and figure 1.
The Canadian Institute for Health Information (CIHI) We evaluated the performance of the model on the
defines age-standardised acute care hospitalisation rate held-out test set. We first checked the distribution of
for conditions where appropriate ambulatory care is the predictions of our model after calibrating the prob-
thought to prevent or reduce the need for admission to abilities to account for undersampling.38 Model perfor-
hospital.8 There are seven different types of avoidable mance was then measured in terms of area under the
hospitalisation-related ACSCs as per the CIHI definition: receiver operating curve (AUC), a widely used metric for
epilepsy, COPD, asthma, diabetes, HF, hypertension and risk prediction tasks.38 39 Since the model was trained on
angina. For each hospitalisation or ambulatory usage, we highly imbalanced data, we also calculated the area under
determined if the primary diagnosis code was in the list precision–recall curve (AUPRC) to focus on the proba-
of CIHI ACSC diagnosis codes. We then aggregated all bility of correctly detecting patients with the highest
codes to determine whether or not an instance contained risk of ACSC.40 To assess the variation of model perfor-
any hospitalisation related to an ACSC from the above list mance on different risk groups, we compared the model
during the target window, in which case we labelled the predictions on multiple subgroups created from the test
instance as a positive data point (ie, our predictions are set. These groups comprised different age, sex, immi-
not cause-specific). The list of the ACSC diagnosis codes gration and socioeconomic groups obtained using data
used as well as additional rules for defining an ACSC can across datasets (eg, RPDB, CENSUS, Ontario Marginal-
be found in online supplemental table 3. ization Index (ON-MARG) in online supplemental table
1). We tested the model on patient groups split based on
Feature preparation the number of interactions they had with the healthcare
The features that were extracted from the data sources system as well.
included patients’ demographic and geographical infor- Based on our model, we also computed Shapley Addi-
mation, drug prescription history, chronic conditions, tive Explanations values, the weighted average of marginal
6 Yi SE, et al. BMJ Open 2022;12:e051403. doi:10.1136/bmjopen-2021-051403Open access
contributions,41 to identify features that contribute the date prior to the end of the first observation window. After
BMJ Open: first published as 10.1136/bmjopen-2021-051403 on 1 April 2022. Downloaded from http://bmjopen.bmj.com/ on June 21, 2022 by guest. Protected by copyright.
most to model predictions. We used a randomly selected the exclusion criteria, a total of 1 854 116 patients were
pool of 50 000 instances to generate these values. selected, resulting in 31 010 869 instances. Among them,
1 237 507 patients with 16 921 175 instances were used
Geospatial variation for training, 309 380 patients with 4 227 660 instances
We finally examined the performance of our model in for validation and 1 375 277 patients yielding 9 862 034
capturing geospatial variation of ACSC incidence rates instances for testing. The ACSC incidence rates among
in Ontario. Ontario has 14 Local Health- Integrated instances were around 1.1% for all sets. Descriptive statis-
Networks (LHINs), responsible for coordinating and tics for key demographic, socioeconomic and chronic
funding local healthcare to improve resources access illness variables are presented in table 1.
and patient experience.42 The LHINs are further divided
into 74 sub- LHINs, and each of these aims at identi-
Model performance
fying healthcare needs and priorities within the region.
The model achieved an average AUC of 80.5 (range
We chose sub- LHINs to represent the subdivisions of
80.4–80.5) and AUPRC of 0.093, when evaluated on all
the province. Following the predictions of our model,
instances in the test set. Figure 2 shows the overall cali-
we computed and plotted the average risk of ACSCs for
bration curve of the model as well as model evaluation
patients in each sub-LHIN.
on important subgroups of the population. The calibra-
Patient and public involvement tion curve of figure 2A has 20 bins of equal data size, and
No patients with ACSCs or members of the public at-large shows the average risk of ACSC predicted by the model
were involved in the conceptualisation, analysis, or the versus the actual ACSC-related hospitalisation rate. The
write-
up of this study. However, the public at- large is inset on the right side of the graph shows that the model
involved at ICES through the form of a Public Advisory is slightly overpredicting the risk.
Council which provides input into decisions made on how Figure 2B shows the average prediction of the model
research is conducted using the individual-level personal compared with the real incidence rate of ACSCs for
health information collected. We plan to disseminate different subgroups of the population. As in the cali-
the knowledge gained through this study with the use of bration curve, the model slightly overpredicts the risk
press releases and presentations on the value of popula- but accurately captures the variation in ACSC hospital-
tion health planning, for both ACSCs and more broadly, isation risk across different subgroups (eg, higher risk
tailored to general public audiences. of hospitalisation in a subcohort with a higher age or a
lower income index). Ranking the predictions made by
the model, we found that the top 5% of test set instances
RESULTS predicted by the model as ‘high-risk’ covered 37.4% of
Starting from the initial cohort of 4 520 076 patients instances who actually present an ACSC-related hospital-
aged 50 years or older as of 2008, we excluded 1 873 139 isation during the target window period. The top 1% and
patients who did not meet inclusion criteria due to age 10% of test set instances covered 15.2% and 50.8% of
restrictions. From the remaining 2 646 937 patients, 752 total positive data points, respectively. Main characteris-
505 were removed for their absence of interaction with tics of these risk groups are described in online supple-
the healthcare system, and 40 316 patients had a death mental table 6.
Figure 2 (A) Calibration curve. (B) Model evaluation on major subgroups of the population. The incidence rates are shown in
blue and the average model prediction in pink. The subgroup sizes are displayed on the x-axis along with the subgroup types.
For education and income quintiles, higher index refers to higher education level and income respectively, in the area a given
patient lives in. The number of events refers to the number of any interaction a given patient had with the healthcare system—
clinician visits, hospitalisation, ambulatory usage, lab tests and drug prescriptions. ACSC, ambulatory care sensitive condition.
Yi SE, et al. BMJ Open 2022;12:e051403. doi:10.1136/bmjopen-2021-051403 7Open access
BMJ Open: first published as 10.1136/bmjopen-2021-051403 on 1 April 2022. Downloaded from http://bmjopen.bmj.com/ on June 21, 2022 by guest. Protected by copyright.
Figure 3 Global feature importance. Shapley values were generated using 50 000 random samples from the test set. Multiple
runs using different samples showed the same ordering of feature contribution. ACSC, ambulatory care sensitive condition;
COPD, chronic obstructive pulmonary disease.
Feature contribution Geospatial variation
Figure 3 shows 20 features with the highest Shapley Figure 4 shows the geospatial variation of ACSC inci-
values. It is clear that the model is leveraging features dence rates in Ontario. Figure 4A (map in red) shows the
across datasets, as the top features span demographics, distribution of ACSC-related hospitalisations in different
geography, chronic conditions, prescriptions and sub-LHINs of Ontario, weighted by the population size in
interactions with the healthcare system. The AUC of each sub-LHIN. Figure 4B (map in blue) shows the distri-
the model when trained on individual datasets as well bution of ACSC risks predicted by the model. Our model
as different combinations of the subsets (see online is able to capture the geospatial heterogeneity of ACSC
supplemental figure 2) shows the impact of combining risk, in rural regions (eg, Northwestern Ontario) as well
all features to achieve the best prediction performance. as in urban and populous areas (eg, Southern Ontario).
The previous number of ambulatory care visits, time
since last ambulatory care visit, as well as presence of
ACSC- related hospitalisations during the observation DISCUSSION
window were predictive of future ACSC-related hospital- The goal of this work was to use AHD to develop a single,
isations. Several features related to medication prescrip- large-scale, machine learning model to predict hospital-
tion during the observation period were also found to isations due to ACSCs in a cohort of 1.85 million older
be predictive of ACSC-related hospitalisations including adults in Ontario, Canada. This model is designed for
the number of selective beta2- adrenergic agonists, population health planning and health resource alloca-
absence of prescriptions for patients in long-term care tion versus individual health decision-making. Our model
(LTC) facilities and number of statin prescriptions. accurately predicted the 1-year risk for ACSCs with a high
Geographical features such as latitude and rural resi- AUC and the prediction values are well calibrated. The
dence were also predictive of our outcome. As shown in model leverages a variety of features across multiple
online supplemental figure 3, the model predictions are administrative health databases to make its predictions,
influenced by different features depending on whether including outpatient visits, demographic information as
or not a given individual already has an ACSC-related well as past drug prescriptions. The presence of comor-
hospitalisation. Having a precedent was found to the bidities such as COPD, hypertension or chronic HF as
contribution of future ACSC hospitalisations and the well as geography was important features in the model
related features appear as the top supporting features. which is consistent with previously identified risk factors
8 Yi SE, et al. BMJ Open 2022;12:e051403. doi:10.1136/bmjopen-2021-051403Open access
BMJ Open: first published as 10.1136/bmjopen-2021-051403 on 1 April 2022. Downloaded from http://bmjopen.bmj.com/ on June 21, 2022 by guest. Protected by copyright.
Figure 4 Distribution of ambulatory care sensitive condition (ACSC) risks predicted by the model compared with the actual
variation in ACSC incidence rates in the province, in 2017. (A) The incidence rates of ACSC by sub-Local Health-Integrated
Network (LHIN), normalised by the population size of the corresponding sub-LHIN. For (B), we computed the predictions of
ACSC with our model for all patients and mapped them for different sub-LHINs. The model (in B) captures the normalised
distribution of these patients (in A).
in Canada.10 Shapley values were provided for model application at the population level, while achieving similar
transparency but should not be interpreted as causal risk model performance in terms of discrimination and cali-
factors. Our model is able to also capture geographical bration. The second study involved predicting the 1-year
variations in risk across Ontario in both rural and urban risk of hospitalisations from ACSCs in a cohort from the
settings. Veteran’s Health Administration in the USA.44 An advan-
tage of their work was the inclusion of individual-level
Strengths and weaknesses in relation to other studies
socioeconomic variables. However, their cohort was much
There have been numerous studies that predict the
more homogenous than ours and designed for individual
risk of emergency admissions in community- dwelling
patient care of a very specific segment of the population.
adults, some of which focus on those that are poten-
Such a model would not be applicable for population
tially avoidable.43 A 2014 systematic review of 18 models
that used either administrative or clinical data found health planning or for use on routinely collected data
that performance, as measured by the c-statistic, ranged where these individual determinants are not available.
between 0.63 and 0.83. Three of these studies focused on Finally, the Sussex Predictor of Key Events model lever-
ACSCs.44–46 The first is an Italian study that used AHD to aged a neural network architecture with 1000 features
identify adult patients at risk of hospitalisation or death across diverse health datasets to predict admission risk
within a year who may be candidates for care through a due to a range of chronic diseases for every individual in
‘patient-centred Medical Home’ programme.45 We used Sussex.46 While it achieved a slightly higher AUC (0.82)
similar sets of features, however, we were able to incor- than our model, its complex architecture and use of
porate additional demographic and socioeconomic vari- almost ten times the amount of features present serious
ables. Notably, we only created one single model for use challenges for model implementation and increases the
in the entire population in order to facilitate the ease of likelihood of overfitting.
Yi SE, et al. BMJ Open 2022;12:e051403. doi:10.1136/bmjopen-2021-051403 9Open access
Meaning of the study to clinicians and policy-makers still capture demographic and geographical information
BMJ Open: first published as 10.1136/bmjopen-2021-051403 on 1 April 2022. Downloaded from http://bmjopen.bmj.com/ on June 21, 2022 by guest. Protected by copyright.
With our model, we are able to assess the 1-year risk of for those individuals, which do contribute to the risk esti-
hospitalisations due to ACSCs by aggregating individual mate and minimise any impact.
patient risks at a subregional level on a quarterly basis. It
is important to see the ACSC rates not simply as a marker Future directions
of access to primary care, but as an indicator for how While our study focused solely on AHD, it is theoretically
resources could be allocated and optimised in a health possible to link this information with data captured in
system by better addressing the needs of specific regions inpatient electronic medical records (EMRs) such that
and patient groups. In Ontario, it has been demonstrated individual clinicians can use this information to direct
that ambulatory care services for cardiovascular disease specific care or treatments. The EMR would also facili-
were actually provided more frequently in regions with tate the capture of individual clinical or risk behaviour
lower rates of cardiovascular events (ie, myocardial infarc- features that are known to contribute ACSC-related hospi-
tion, stroke or cardiovascular-related death).47 Therefore, talisation risk and thus may also increase model perfor-
a model such as the one developed in this work is a valu- mance. Future work could also test longer buffer periods,
able tool for health systems planners to inform healthcare such as 3 or 5 years, to support resource allocation efforts
delivery models and allocate community-based interven- at the population level with greater lead time (eg, health
tions over space and time with a focus on health equity.47 48 region-level allocations for enrollees in an intervention).
Such reallocations are thought to be impactful, as it has Finally, there is uncertainty around what interventions are
been shown that readmission due to certain conditions, most effective at reducing rates of hospitalisations in high-
such as HF, can be reduced by the efficient and timely risk populations. For example, trials of care coordination
allocation of inpatient and outpatient counselling and programmes have demonstrated mixed results for various
monitoring efforts.49 chronic diseases.54 55 Designing and validating these inter-
ventions across the population remains an important area
Strengths and weaknesses of the study for future work. In cases where there are data from real-
Our study has several strengths. Our cohort is large and is world pilots of interventions, causal machine learning
constructed from a highly diverse population. We devel- approaches may be able to help improve the design and
oped a model that uses a wide range of features to predict targeting of such interventions by identifying subgroups
the risk of hospitalisation for ACSCs, which is an indi- within a population that may have the largest treatment
cator of the effectiveness of the healthcare system indi- effects.29
cator. The model is designed in a way it can be deployed
in a real-world setting at relatively low cost, using avail- Conclusion
able AHD as well as area-level data that capture concepts In this work, we demonstrate that the development and
related to the social determinants of health. It also allows validation of a single, large-scale machine learning model
risk assessment at different aggregation levels for geog- to predict the 1-year risk of hospitalisation from a series of
raphy and over time. Given that population-risk scores are ambulatory-care sensitive conditions is feasible in a large
known to be biased,50 we conducted a rigorous calibra- and diverse cohort of seniors using AHD. Such a model
tion evaluation not just globally, but in subgroups as well. has the potential to reduce the burden of hospitalisations
However, our work also has some important limitations. from ambulatory care conditions by supporting the allo-
A challenge lies in the focus of ACSC as an outcome, cation of community-based interventions during popula-
which has been the focus of some debate regarding the tion health planning and health resource allocation.
extent of its preventable nature.51 Furthermore, the
definition of ACSCs relies on diagnosis codes that are Author affiliations
1
often considered to be a partial way of patient condition Layer6 AI, Toronto, Ontario, Canada
2
Department of Computer Science, University of Toronto, Toronto, Ontario, Canada
assessment.52 It varies across different jurisdictions, even 3
Dalla Lana School of Public Health, University of Toronto, Toronto, Ontario, Canada
though the set of conditions used in this study is common 4
Temerty Faculty of Medicine, University of Toronto, Toronto, Ontario, Canada
in most definitions.5 7 8 51 The lack of access to certain 5
Temerty Centre for Artificial Intelligence Research and Education in Medicine,
indicators (eg, smoking, body mass index, etc) that are University of Toronto, Toronto, Ontario, Canada
6
known to be important determinants of ACSC risks10 44 is Vector Institute, Toronto, Ontario, Canada
7
School of Computer Science and Engineering, Nanyang Technological University,
expected to bottleneck model performance and empha- Singapore
sises the difficulty of assessing an individual’s risk without 8
Institute for Clinical Evaluative Sciences, Toronto, Ontario, Canada
fully observing their health and behavioural status.53 A 9
Institute for Better Health, Trillium Health Partners, Mississauga, Ontario, Canada
3-month lag period for administrative data updates also
limits any potential applications in real-time; however, we Twitter Laura C Rosella @LauraCRosella
have designed our system for use 1 year in the future. By Acknowledgements This study was supported by ICES, which is funded by
excluding patients without known interactions with the an annual grant from the Ontario Ministry of Health (MOH) and the Ministry of
Long-Term Care (MLTC). Parts of this material are based on data and information
health system, it is possible we are underestimating risk compiled and provided by the Ministry of Health (MOH) and Canadian Institute
for individuals who have very little interaction with the for Health Information (CIHI). However, the analyses, conclusions, opinions and
health system or other barriers to access. However, we do statements expressed in the material are those of the author(s), and not necessarily
10 Yi SE, et al. BMJ Open 2022;12:e051403. doi:10.1136/bmjopen-2021-051403Open access
those of CIHI or MOH. Parts or whole of this material are based on data and/ and license their derivative works on different terms, provided the original work is
BMJ Open: first published as 10.1136/bmjopen-2021-051403 on 1 April 2022. Downloaded from http://bmjopen.bmj.com/ on June 21, 2022 by guest. Protected by copyright.
or information compiled and provided by Immigration, Refugees and Citizenship properly cited, appropriate credit is given, any changes made indicated, and the use
Canada (IRCC) current to 2018. However, the analyses, conclusions, opinions is non-commercial. See: http://creativecommons.org/licenses/by-nc/4.0/.
and statements expressed in the material are those of the author(s), and not
necessarily those of IRCC. We thank IQVIA Solutions Canada Inc. for use of their ORCID iD
Drug Information File. Laura C Rosella http://orcid.org/0000-0003-4867-869X
Contributors LCR conceptualised the study and secured funding for the research.
SEY, TP, MV and LCR planned the first version of the study protocol. TW and
KK facilitated data acquisition to the data and TW prepared the analytic cohort
with support from KK. MV, MR, VH and MG critically reviewed the study protocol REFERENCES
provided initial and ongoing input on the analysis. SEY carried out the analysis 1 Kruk ME, Gage AD, Arsenault C, et al. High-quality health systems in
with contributions from JG, MR, MV. VH and KK took part in interpreting results and the sustainable development goals era: time for a revolution. Lancet
Glob Health 2018;6:e1196–252.
providing feedback for model refinement. SEY and VH wrote the first draft of the
2 Sikka R, Morath JM, Leape L. The quadruple aim: care, health, cost
paper. All authors contributed to the critical revision of the manuscript for important and meaning in work. BMJ Qual Saf 2015;24:608–10.
intellectual content and approved the final version of the manuscript. LCR is the 3 Enhancing the continuum of care - report of the avoidable
guarantor and is responsible for the overall content. hospitalization advisory panel. Submitted to the Ministry of Health
and Long-Term care, 2011. Available: http://www.health.gov.on.ca/
Funding This work was supported by the New Frontiers in Research Fund (NFRFE-
en/common/ministry/publications/reports/baker_2011/baker_2011.
2018-00662), a Canada Research Chair in Population Health Analytics (950- pdf [Accessed 5 Jan 2021].
230702) (LR), Ontario Graduate Scholarship (number N/A) (VH), Canadian Institutes 4 Purdy S, Griffin T, Salisbury C, et al. Ambulatory care sensitive
of Health Research Banting and Best Canada Graduate Scholarship Master’s and conditions: terminology and disease coding need to be more specific
Doctoral awards (numbers N/A) (VH), and Vector Institute Post-graduate Fellowship to aid policy makers and clinicians. Public Health 2009;123:169–73.
(number N/A) (VH). 5 Sarmento J, Rocha JVM, Santana R. Defining ambulatory care
sensitive conditions for adults in Portugal. BMC Health Serv Res
Competing interests All authors have completed the ICMJE uniform disclosure 2020;20:754.
form at www.icmje.org/coi_disclosure.pdf and declare: SY, JG, MR, MV, and TP are 6 Ambulatory Care Sensitive Conditions (ACSC) - NHS Digital.
full-time employees of Layer 6 AI, cofounded by MV and TP, owned by Toronto- Available: https://digital.nhs.uk/data-and-information/data-tools-
Dominion Bank. VH, KK and TW are employed at the Dalla Lana School of Public and-services/data-services/innovative-uses-of-data/demand-on-
Health. The employers of the authors had no role in the design or funding of this healthcare/ambulatory-care-sensitive-conditions [Accessed 5 Jan
research. 2021].
7 Prevention quality indicators (PQI) overview. Available: https://www.
Patient and public involvement Patients and/or the public were involved in the qualityindicators.ahrq.gov/Modules/pqi_resources.aspx [Accessed 5
design, or conduct, or reporting, or dissemination plans of this research. Refer to Jan 2021].
the Methods section for further details. 8 Ambulatory care sensitive conditions. Available: http://
indicatorlibrary.cihi.ca/display/HSPIL/Ambulatory+Care+Sensitive+
Patient consent for publication Not applicable. Conditions [Accessed 5 Jan 2021].
9 Busby J, Purdy S, Hollingworth W. How do population, general
Ethics approval This prokevct was reviewed by the University of Toronto Research
practice and hospital factors influence ambulatory care sensitive
Ethics Board (protocol number is 37650).ICES has obtained ethical approval (and admissions: a cross sectional study. BMC Fam Pract 2017;18:67.
repeats this review tri-annually) for its privacy and security policies, procedures, 10 Hospitalizations for Ambulatory Care Sensitive Conditions (ACSC).
and practices. Each research project that is conducted at ICES is also subject The factors that matter, 2011. Available: https://www150.statcan.
to internal ethical review by the ICES Privacy and Compliance Office. ICES is gc.ca/n1/pub/82-622-x/82-622-x2011007-eng.htm [Accessed 5 Jan
a prescribed entity under section 45 of Ontario’s Personal Health Information 2021].
Protection Act (PHIPA). Section 45 is the provision that enables analysis and 11 Emergency admissions to hospital: managing the demand - National
compilation of statistical information related to the management, evaluation, Audit Office (NAO) Report. Available: https://www.nao.org.uk/report/
emergency-admissions-hospitals-managing-demand/ [Accessed 5
and monitoring of, allocation of resources to, and planning for the health system. Jan 2021].
Section 45 authorizes health information custodians to disclose personal health 12 QualityWatch: focus on preventable admissions. Available: https://
information to a prescribed entity, like ICES, without consent for such purposes. www.health.org.uk/publications/qualitywatch-focus-on-preventable-
Projects conducted wholly under section 45, by definition, do not require review by admissions [Accessed 5 Jan 2021].
a Research Ethics Board. As a prescribed entity, ICES must submit to trio-annual 13 McDarby G, Smyth B. Identifying priorities for primary care
review and approval of its privacy and security policies, procedures and practices investment in Ireland through a population-based analysis of
by Ontario’s Information and Privacy Commissioner. These include policies, avoidable hospital admissions for ambulatory care sensitive
conditions (ACSC). BMJ Open 2019;9:e028744.
practices and procedures that require internal review and approval of every project
14 Feely A, Lix LM, Reimer K. Estimating multimorbidity prevalence with
by ICES’ Privacy and Compliance Office. the Canadian chronic disease surveillance system. Health Promot
Provenance and peer review Not commissioned; externally peer reviewed. Chronic Dis Prev Can 2017;37:215–22.
15 Rosella L, Kornas K, Huang A, et al. Accumulation of chronic
Data availability statement Data may be obtained from a third party and are not conditions at the time of death increased in Ontario from 1994 to
publicly available. The dataset for this study is held securely in coded form at ICES. 2013. Health Aff 2018;37:464–72.
While data sharing agreements prohibit ICES from making the dataset publicly 16 Trachtenberg AJ, Dik N, Chateau D, et al. Inequities in ambulatory
available, access may be granted to those who meet prespecified criteria for care and the relationship between socioeconomic status and
confidential access, available at www.ices.on.ca/DAS. The full dataset creation plan respiratory hospitalizations: a population-based study of a Canadian
City. Ann Fam Med 2014;12:402–7.
is available from the authors upon request.
17 Grigoroglou C, Munford L, Webb R, et al. Impact of a national
Supplemental material This content has been supplied by the author(s). It has primary care pay-for-performance scheme on ambulatory care
not been vetted by BMJ Publishing Group Limited (BMJ) and may not have been sensitive hospital admissions: a small-area analysis in England. BMJ
peer-reviewed. Any opinions or recommendations discussed are solely those Open 2020;10:e036046.
18 Billings J, Zeitel L, Lukomnik J, et al. Impact of socioeconomic status
of the author(s) and are not endorsed by BMJ. BMJ disclaims all liability and
on hospital use in New York City. Health Aff 1993;12:162–73.
responsibility arising from any reliance placed on the content. Where the content 19 Conway R, O’Riordan D, Byrne D, et al. Deprivation influences the
includes any translated material, BMJ does not warrant the accuracy and reliability emergency admission rate of ambulatory care sensitive conditions.
of the translations (including but not limited to local regulations, clinical guidelines, Clin Med 2016;16:119–23.
terminology, drug names and drug dosages), and is not responsible for any error 20 Wallace E, Smith SM, Fahey T, et al. Reducing emergency
and/or omissions arising from translation and adaptation or otherwise. admissions through community based interventions. BMJ
2016;352:h6817.
Open access This is an open access article distributed in accordance with the 21 Jain SH, Chandrashekar P. Implementing a targeted approach
Creative Commons Attribution Non Commercial (CC BY-NC 4.0) license, which to social determinants of health interventions. Am J Manag Care
permits others to distribute, remix, adapt, build upon this work non-commercially, 2020;26:502–4.
Yi SE, et al. BMJ Open 2022;12:e051403. doi:10.1136/bmjopen-2021-051403 11Open access
22 Bates DW, Saria S, Ohno-Machado L, et al. Big data in health care: 40 Ozenne B, Subtil F, Maucort-Boulch D. The precision–recall curve
BMJ Open: first published as 10.1136/bmjopen-2021-051403 on 1 April 2022. Downloaded from http://bmjopen.bmj.com/ on June 21, 2022 by guest. Protected by copyright.
using analytics to identify and manage high-risk and high-cost overcame the optimism of the receiver operating characteristic curve
patients. Health Aff 2014;33:1123–31. in rare diseases. J Clin Epidemiol 2015;68:855–9.
23 Virnig BA, McBean M. Administrative data for public health 41 Lundberg SM, Erion GG, Lee S-I. Consistent individualized feature
surveillance and planning. Annu Rev Public Health 2001;22:213–30. attribution for tree ensembles. arXiv [cs.LG], 2018. Available: http://
24 Jutte DP, Roos LL, Brownell MD. Administrative record linkage arxiv.org/abs/1802.03888
as a tool for public health research. Annu Rev Public Health 42 Central West local health integration network (LHIN). Available: http://
2011;32:91–108. www.centralwestlhin.on.ca/About%20Us/Frequently%20Asked%
25 Srinivas S. A machine learning-based approach for predicting patient 20Questions/About%20Ontario%20LHINs.aspx [Accessed 5 Jan
punctuality in ambulatory care centers. Int J Environ Res Public 2021].
Health 2020;17:3703. 43 Wallace E, Stuart E, Vaughan N, et al. Risk prediction models to
26 Srinivas S, Salah H. Consultation length and no-show prediction for
predict emergency hospital admission in community-dwelling adults:
improving appointment scheduling efficiency at a cardiology clinic: a
a systematic review. Med Care 2014;52:751–65.
data analytics approach. Int J Med Inform 2021;145:104290.
44 Gao J, Moran E, Li Y-F, et al. Predicting potentially avoidable
27 Geilleit R, Hen ZQ, Chong CY, et al. Feasibility of a real-time hand
hygiene notification machine learning system in outpatient clinics. J hospitalizations. Med Care 2014;52:164–71.
Hosp Infect 2018;100:183–9. 45 Louis DZ, Robeson M, McAna J, et al. Predicting risk of
28 Angraal S, Mortazavi BJ, Gupta A, et al. Machine learning prediction hospitalisation or death: a retrospective population-based analysis.
of mortality and hospitalization in heart failure with preserved ejection BMJ Open 2014;4:e005223.
fraction. JACC Heart Fail 2020;8:12–21. 46 Oliver-Baxter J, Bywood P, Erny-Albrecht K. PHCRIS policy issue
29 Marafino BJ, Schuler A, Liu VX, et al. Predicting preventable hospital review: predictive risk models to identify people with chronic
readmissions with causal machine learning. Health Serv Res conditions at risk of hospitalisation, 2015.
2020;55:993–1002. 47 Tu JV, Chu A, Maclagan L, et al. Regional variations in
30 Government of Ontario, Ministry of Finance. 2016 census highlights: ambulatory care and incidence of cardiovascular events. CMAJ
Factsheet 9. Available: https://www.fin.gov.on.ca/en/economy/ 2017;189:E494–501.
demographics/census/cenhi16-9.html#:~:text=Ontario’s%20 48 Chen IY, Joshi S, Ghassemi M. Treating health disparities with
Population%20is%20Highly%20Diverse&text=About%20250%20 artificial intelligence. Nat Med 2020;26:16–17.
ethnic%20origins%20were%20reported%20by%20Ontarians%20 49 Amarasingham R, Patel PC, Toto K, et al. Allocating scarce resources
in%20the%202016%20Census [Accessed 5 Jan 2021]. in real-time to reduce heart failure readmissions: a prospective,
31 Ontario demographic Quarterly: highlights of first quarter, 2020. controlled study. BMJ Qual Saf 2013;22:998–1005.
Available: https://www.ontario.ca/page/ontario-demographic- 50 Obermeyer Z, Powers B, Vogeli C, et al. Dissecting racial bias in
quarterly-highlights-first-quarter-2020 [Accessed 5 Jan 2021]. an algorithm used to manage the health of populations. Science
32 ICES. Available: https://www.ices.on.ca/ [Accessed 5 Jan 2021]. 2019;366:447–53.
33 Kohavi R, John GH. Wrappers for feature subset selection. Artif Intell 51 Fleetcroft R, Hardcastle A, Steel N, et al. Does practice analysis
1997;97:273–324. agree with the ambulatory care sensitive conditions’ list of avoidable
34 Python API reference — xgboost 1.4.0-SNAPSHOT documentation. unplanned admissions?: a cross-sectional study in the East of
Available: https://xgboost.readthedocs.io/en/latest/python/python_ England. BMJ Open 2018;8:e020756.
api.html [Accessed 5 Jan 2021].
52 McKillop M, Polubriaginof F, Weng C. Exploration of temporal ICD
35 Chen T, Guestrin C. XGBoost. Proceedings of the 22nd ACM
coding bias related to acute diabetic conditions. AMIA Annu Symp
SIGKDD international conference on knowledge discovery and data
mining 2016. Proc 2015;2015:2005–14.
36 Bojer CS, Meldgaard JP. Kaggle forecasting competitions: an 53 Agniel D, Kohane IS, Weber GM. Biases in electronic health record
overlooked learning opportunity. Int J Forecast 2020. data due to processes within the healthcare system: retrospective
37 Akbani R, Kwek S, Japkowicz N. Applying support vector machines observational study. BMJ 2018;361:k1479.
to imbalanced datasets. machine learning: ECML 2004:39–50. 54 Peikes D, Chen A, Schore J, et al. Effects of care coordination
38 Pozzolo AD, Caelen O, Johnson RA. Calibrating probability with on hospitalization, quality of care, and health care expenditures
Undersampling for unbalanced classification. 2015 IEEE symposium among Medicare beneficiaries: 15 randomized trials. JAMA
series on computational intelligence 2015. 2009;301:603–18.
39 Huang J, Ling CX. Using AUC and accuracy in evaluating learning 55 McCall N, Cromwell J. Results of the Medicare health
algorithms. IEEE Transactions on Knowledge and Data Engineering support disease-management pilot program. N Engl J Med
2005;17:299–310. 2011;365:1704–12.
12 Yi SE, et al. BMJ Open 2022;12:e051403. doi:10.1136/bmjopen-2021-051403You can also read