Preference or Controversy: What Predicts Virality Most?
←
→
Page content transcription
If your browser does not render page correctly, please read the page content below
Preference or Controversy: What Predicts
 Virality Most?
 Yening Hu
 Wenzhou Kean University, China

Abstract
Viral marketing, if done successfully, creates great exposure for brands and product offerings.
YouTube, as a video platform, is an important marketing channel and we study what predicts
video virality in this context. With the increasing usage of online platforms and social media,
YouTube is an ideal setting to study what predicts video virality. Previous literature indicates
that emotional response leads to consumer engagement in social media and two aspects of such
response can be characterized as preference and controversy. To study what associates with
virality most, we utilized a large dataset from Kaggle.com which consists daily record of top
trending YouTube videos from 2017-2018. We construct measures of preference-related
variables and controversy-related variables and apply lasso and ridge regression to answer the
research question: is it preference or controversy that predicts virality better. We found out that
preference predicts virality much better than controversy. Our results bridge the gap in the
literature: we reconcile the impact of preference and controversy on virality. This research also
has managerial implications: marketers, content producers, and platform owners will be better
off providing well-liked content.

Keywords: Virality, social media, marketing strategy, prediction analysis, online platforms

1. Introduction
 With the increasing usage of online platforms and social media, YouTube is an ideal setting
to study viral marketing. YouTube, as a content community established in 2005, provides a
great platform for content producers to promote organic content or commercial content. After
more than ten years of development, YouTube is not only a platform for viewing videos, but it
also functions as social media due to its nature in communication and interactions. More than
90 percent of U.S. internet users aged 18 to 44 years accessed YouTube. If every single person
on earth watched a video, that’s around 8.4 minutes per day per person (YouTube, 2019).
YouTube is an important channel for marketers to promote their content and for content
producers to establish their individual brands. A viral video on YouTube has great potentials
to reach a large audience and deliver the proper message.
 YouTube is popular not only because it is considered a platform for personal video viewing,
but it is also a valuable tool for businesses. According to YouTube (2019), 62 percent of
businesses use YouTube as a channel to post video content. In fact, 78.8 percent of marketers
consider it to be the most effective platform for video marketing (GO Globe, 2019). The
platform has a two-sided nature: it takes both viewers’ engagement and video creators’ efforts
to make YouTube popular. On the one hand, statistic suggests that 500 hours of video are

 54

uploaded to YouTube every minute worldwide (YouTube, 2019). On the other hand, viewers
engage in interaction with YouTubers and make videos viral by sharing the videos with family
and friends. Viewers use YouTube’s like, dislike, and comment function to interact with
YouTubers. Therefore, it is important to understand the interaction between YouTubers and
users and study what predicts the probability of video virality as it has great implications for
marketers to use the platform well for business purposes.
 In this study, we characterize patterns of video virality. In particular, we use publicly
available data regarding YouTube video characteristics to construct measures of preference-
related variables and controversy-related variables. Previous literature indicates that emotional
response leads to consumer engagement in social media and two aspects of such response can
be characterized as preference and controversy. Our analysis is designed to answer the research
question: is it preference or controversy that predicts virality better? By using lasso and ridge,
we take the advantage of a large number of constructed variables and derive more insights. We
found out that preference predicts virality much better than controversy.
 Our results contribute greatly to literature and to practice. Regarding academic contribution,
we mainly contribute to the literature on emotional response and virality. Previous literature
shows the link between emotional response and virality/ social media engagement behavior.
This research moves a step further and quantifies the impact of different emotional responses
on virality. For managerial implications, our results show that marketers, content producers,
and platform owners will be better off providing well-liked content.
 The rest of the paper proceeds as follows: Section 2 discussed previous research results on
the link between emotional response and virality in the online behavior context. Section 3
describes our data and study context. Section 4 documents our model and the estimation results.
Section 5 discusses our findings and provides concluding remarks.

2. Literature Review
 Online Behavior
 YouTube is a representative platform to study as online behavior in different social media
are quite similar. On Facebook, users engage in online interaction by liking, commenting, and
sharing (Khan 2017). Similar to Facebook and Twitter, YouTube allows users to interact with
the site in multiple ways. What makes YouTube being perceived more like social media instead
of a video-sharing website is that the content on YouTube is allowed to be shared, embedded,
and discussed so users are engaged in online interaction (Burgess and Green, 2013). YouTube
users, as well as consumers, consume the video by viewing the video, reading and writing the
comment, clicking the like and dislike buttons. Therefore, the insights we obtained from
YouTube context can be applied to other social media platforms.
 One prominent feature of such social media websites is “one-click social plugins”. It is an
affective evaluation mechanism excited in SNS like Facebook, Twitter, etc. It is convenient for
users to present affective evaluation responses in this way. Some researchers analyze how
emotion is related to virality in SNS through scanning users’ behavior with “One-click social
plugins” (Lee et al., 2016). Since the “One-click social plugins” on different SNS vary, there
will be some extreme situation. For example, there is only “like” button on a Facebook page,
as a result, the affective response is only presented as a positive response. Thus, a Facebook

 55
user who has the positive affective evaluation of an SNS ad may choose to explicitly reveal his
or her own empathy by clicking on Like.
 “One-click social plugins” make it easier for social media users to express their emotions
by clicking buttons and it offers researchers opportunities to study and infer consumer’s
reactions and emotions towards viral videos by examining how they press those little buttons.
 Emotional Response and Virality
 Virality has a close relationship with an emotional response. Previous research suggests that
social media engagement is driven by emotions (MindComet, 2006) which leads to the virality
of videos. Karen, Riebe, and Newstead's (2013)’s work explores how different types of
emotions drive videos viral. Alhabash and McAister's (2015)’s research focuses on the
emotional expression and virality on Facebook and Twitter. Bradley (1994), however,
promoted the concept called excitation arousal. Excitation arousal is defined as the outcome
depicting of individual’s emotional response, which can be positive and/or negative. When
such emotional response and excitation reflect on YouTube video viewers’ behavior,
Bradley(1994) and Long's (1994) research reveal that excitation transfer can be promoted
when the excitation arousal reaches the need-to-release point. After that, as a result of excitation
transfer, viewers are likely to click like or share button, even commenting on the post or video,
which requires more cognitive resources (Bradley & Lang, 1994). So, we can briefly conclude
that messages with stronger emotional appeals, or we say excitation arousal is considered easier
to be shared and spread online (Alhabash et al., 2013). The virality of online content reflects
people's acceptance and universality of the proposed behavior or attitude (Alhabash, 2015).
From previous research, we can see that virality has a close relationship with emotional arousal,
which leads to the clicks of “one-click social plugins”.
 Preference plays an important role in video virality. In Eclker and Bolls (2011)’s research,
they show their subjects 12 commercial videos and they report that subjects’ forwarding
intention is closely related to the emotional tone, especially the positive tone. Besides,
Alhabash and McAlister (2014) point out that viral reach refers to both sharing and viewership
of content (e.g., views, shares). Compared with negative messages, positive messages have a
greater chance of virality (Hagerstrom, Alhabash, and Kononova 2014).
 However, many other types of research also suggest that virality could have a close
relationship with controversy. The controversy is defined as the public disagreement involves
different ideas or opinions about something (Cambridge Dictionary). Bardzell (2008) indicates
that emotional responses to viral videos are complex and often conflicting. Existed controversy
analysis mainly focuses on some specific topic. For example, Adamic and Glance (2004)
studied polarization on social media networks and identified a clear separation in the hyperlink
structure of political blogs. Alhabash (2015) dugs into how controversy on cyberbully related
to the virality of these YouTube videos. Qiu et. al (2019) conduct a case study about how the
controversy of Chinese movies has to do with the audience’s reaction. Different from online
videos, the virality of these movies is reflected in the box-office and rate. Their finding suggests
that almost all of the high box-office movies have a high level of controversy.
 An online social network can be considered as the main media of learning about information.
It provides a platform for people to express ideas, contributing to public debates, and
participating in opinion-formation processes (Coletto 2017). However, little research utilizes
YouTube, an important video-sharing platform, to study how emotional tones, preference or

 56
controversy, relate to virality. In this research, we bridge the literature gap by the study which
mechanism predicts video virality on YouTube better, preference or controversy.

3. Data
 To study what associates with virality most, I have obtained a large dataset from Kaggle.com
which consists daily record of top trending YouTube videos from 2017-2018. The dataset
consists of trending YouTube video characteristics data from ten different countries, including
France, the United Kingdom, the United States, Japan, Russia, India, Mexico, Denmark, Korea,
and Canada. To ensure the consistency of analysis and the accuracy of the answers to my
research question, I further select the data from the US in the later analysis.
 YouTube, the biggest video-sharing website, has its own algorithm to determine what's the
top trending videos on the platform. Even we do not know YouTube’s recommendation
algorithm, we have a detailed set of data and this dataset would allow us to study what is
associated with the virality of the video. The variables in the dataset include the video title,
channel title, publish time, tags, views, likes and dislikes, description, and comment count. To
be more specific, such videos are not necessary the most-viewed videos overall. A few
examples of such videos are music videos, celebrity/TV-related videos, and random viral
videos that are uploaded by normal people. In each day each country, there are up to 200 listed
trending videos entering the dataset. As for the comment and views on YouTube, unregistered
users can only watch videos on the site, while registered users are being allowed to comment
on videos and upload their own videos. The data collected was located between 2017 and 2018
to make the information as updated as possible. Data in each observation is collected on the
12th day of each month. There were in total 7998 observations. After data cleaning, there are
7525 (94%) observations left.
 To be more specific, this paper explores what factors impact views in order to answer the
research question of whether preference or controversy impacts virality most. Our variable of
interest is Views. In order to explore how each variable and the interaction of each variable
impact views, our independent variables not only include existed variables such as Likes,
Dislikes, and Comments, but also include constructed variables listed in the following:
 Preference Ratio: The preference ratio is defined as Likes divided by Dislikes. It is an
independent variable used to show how much do viewers like the video. It is one of the key
variables in this study.
 Controversy Ratio: Controversy ratio is defined as the difference between Likes and
 −
Dislikes divided by the sum of Likes and Dislikes, i.e. = + . This variable
indicates the controversy shown in the audience who are interested in clicking likes and dislikes
button. This is also a key variable in this study.
 General preference: General preference is defined as the result of the preference ratio
divided by Comments count. This variable indicates how does the preference is shown in the
audience who viewed the video.
 General controversy: General controversy is defined as the result of the controversy ratio
divided by Comments count. This variable indicates how the hate are shown in the audience
who viewed the video.

 57
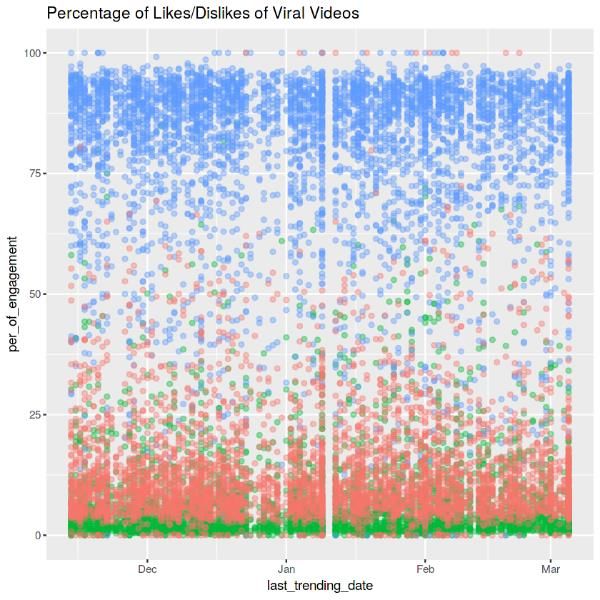
Particular preference: Particular preference is defined as the result of preference ratio
 multiplied by Comments count. This variable indicates how the preference is shown in the
 audience who are willing to take more time commenting.
 Particular controversy: Particular controversy is defined as the result of controversy ratio
 multiplied with Comments count. This variable indicates how the controversy is shown in the
 audience who are willing to take more time commenting.
 Square of Dislikes: = 2 The squared variables can be used to infer the first
 derivative of the variable impacts on the variable of interest, i.e. views.
 Square of Likes: = 2
 Square of Comments: = 2
 Table 1 shows that, compared with Likes, the number of Comments is much smaller. In
 addition, the Controversy ratio is a lot higher than the Preference ratio on average. It indicates
 that there is a persistent pattern of controversy that exists and it is important to study how
 controversy impacts views. However, Dislikes is relatively small compared with Likes and
 Comments. It indicates that being preferred is also important to achieve virality. It is possible
 that both variables impact virality. Therefore, it is important to study what impacts virality
 more when both mechanisms present.
 In Figure 1, blue dots represent Likes, green dots represent Dislikes, and red dots represent
 Comments. We show that the percentage of engagement of Likes and Dislikes don’t change
 dynamically over time and it is reasonable to use the percentage of Likes, Dislikes, and
 Comments to study how YouTube viewers’ attitudes towards those videos impact virality. The
 implication from this study is not time-sensitive.
 Table1 The Summary of Dataset
Variable Median Mean Min Max Std
 13.38 6.53 19.23 1.60
Log Views 13.45
 9.83 9.70 0.00 15.54 2.06
Log Likes
 6.47 6.45 0.69 14.33 1.88
Log Dislikes
 7.58 7.55 0.69 14.12 1.83
Log Comments
 41.85 44.93 0.48 205.4 21.58
Square of Log Dislikes
 96.63 97.84 0.00 241.5 34.83
Square of Log Likes
 57.38 60.14 0.48 199.5 24.89
Square of Log Comments
 1.52 1.58 0.00 9.11 0.59
Preference ratio
 4.85 9.20 1.00 28240 36.57
Controversy ratio
 0.20 0.24 0.00 8.06 0.07
General preference
 0.65 1.24 0.23 3356 2.63
General controversy
 11.67 11.61 0.00 40.13 0.28
Particular preference
 37.47 72.45 0.69 237666 4.38
Particular controversy
N 7895 7895 7895 7895 7895

 58
Figure 1 Percentage of Engagement of Likes and Dislikes Overtime

Blue represents Likes, Green represents Dislikes and Red indicates Comment

4. Model & Results
 In this research, I applied Lasso and Ridge regression and intend to compare these two
models. Lasso regression is useful in identifying key variables for prediction exercise and
Ridge regression is helpful in using all information contained in the variables. Both are valid
statistical methods that would indicate the predictability of each key variable greatly. This
allows me to explore which variable matters most and answer the research question whether it
is preference or controversy that impacts virality most. In the regressions, the dependent
variable is a log of the number of views and the independent variable includes likes, dislikes,
comments, and additional constructed variables. The regression results are shown in Table 2.

 59
Table 2 Regression Results
 lasso ridge

 Likes 0.11 0.00

 Dislikes 0.24 0.00

 Comments 0.05 0.00

 Preference Ratio 4.59 0.01

 Controversy Ratio 0.01 0.00

 General Preference 46.99 0.01

 General Controversy 0.14 0.00

 Particular Preference 1.00 0.00

 Particular Controversy 0.02 0.00

 Square of Dislikes 0.02 0.00

 Square of Likes 0.01 0.00

 Square of Comments 0.00 0.00

Table 2 supports the theory that preference matters much more to virality. In the Lasso
regression, preference-related variables including Preference Ratio, General Preference, and
Particular Preference have larger coefficients than their counterparts (Controversy Ratio,
General Controversy, and Particular Controversy). The coefficient of Dislikes is larger than
the coefficient of Likes. It is possible that the more views a video has, the more likely it that
people who do not like the video will also have the chance to watch the video and thus result
in more dislikes. Preference Ratio is defined as Likes divided by Dislikes. The large coefficient
indicates that Likes results in more views than Dislikes and a viral video is likely to be well-

 60
liked by far more audience. General Preference, defined by Preference Ratio divided
Comments, also has a large coefficient. It indicates that when a video goes viral, the majority
of the audience will like the video but not necessarily leave a comment. It indicates that a viral
video will provoke the audience’s emotions enough to click the “like” button and share the
video but the emotion is not necessarily strong enough to leave any comments. It proves our
point again that a viral video is more likely to be well-liked than to be controversial. To be
viral, preference is undoubtfully the most important indicator. In the Ridge regression, only
Preference Ratio and General Preference have a non-zero coefficient. It indicates that in
general, the ratio of Likes to Dislikes matters most to the prediction of virality. It signifies our
conclusion that preference matters to virality more.

5. Conclusion
With the popularity of social media and online platforms, we saw controversial content more
and more frequently. It is possible that controversial content might bring additional views and
connect with the audience who have particular perspectives. From time to time, there are
instances that some content producers gain influence by producing controversial content. It
leads to the question: is it preference or controversy that leads to virality?

In this research, we study the research question in the content of video views on the social
media platform, i.e. YouTube. Our results show that preference is a stronger predictor of views
than controversy, and thus a strong preference by consumers is more likely to predict virality.
In particular, a viral video is more likely to be a high account of likes, but not necessarily a
large number of comments or dislikes. It indicates that preference is a positively influential
element of virality for YouTubers.

Our research has significant implications for content producers, marketers, and platform
owners. For content producers, while it is possible to use controversial content to attract
additional views, it is important to make high-quality, and well-liked video content to achieve
a large audience. For marketers, the implication is similar. They would be better of working
with YouTubers/ Influencers who are well-liked to increase the probability of content going
viral as well as to connect with consumers more. To advertise products and brands, it is
important for marketers to create content that consumers like to see. For platform owners, it is
critical to promote videos that are welcomed by the general republic. Controversy, as a strategy,
might not be as effective as we think. Click-bait titles and controversial content might attract
initial traffic, but our research shows that it is not what consumers like and will not reach a
large audience. Platform owners could consider policy levers at their disposal to promote well-
liked content and increase consumer engagement.

References
Alhabash, S., & McAlister, A. R. (2015). Redefining virality in less broad strokes: Predicting viral
 behavioral intentions from motivations and uses of Facebook and Twitter. New Media & Society,
 17(8), pp. 1317–1339.
Alhabash, S., McAlister, A. R., Hagerstrom, A., Quilliam, E. T., Rifon, N. J., & Richards, J. I. (2013).
 Between likes and shares: effects of emotional appeal and virality on the persuasiveness of

 61
anticyberbullying messages on Facebook. Cyberpsychology, behavior and social networking, 16(3),
 pp. 175–182.
Coletto, Mauro & Garimella, Kiran & Gionis, Aristides & Lucchese, Claudio. (2017). Automatic
 controversy detection in social media: A content-independent motif-based approach. Online Social
 Networks and Media. 3-4. pp. 22-31.
Hagerstrom, A., Alhabash, S., & Kononova, A. (2014). Emotional dimensionality and online ad virality:
 Investigating the effects of affective valence and content arousingness on processing and
 effectiveness of viral ads. In: J., Huh, (Ed.), Proceedings of the 2014 Conference of the American
 Academy of Advertising, pp. 109.
Hoffman, Donna & Novak, Thomas. (2012). Toward a Deeper Understanding of Social Media. Journal
 of Interactive Marketing. 26. pp. 69–70.
Jiangtao Qiu, Zhangxi Lin, Qinghong Shuai, Investigating the opinions distribution in the controversy
 on social media, Information Sciences, Volume 489, 2019, pp. 274-288.
Karen Nelson-Field, Erica Riebe, Kellie Newstead, The emotions that drive viral video, Australasian
 Marketing Journal (AMJ), Volume 21, Issue 4, 2013, pp. 205-211
M. Laeeq Khan, Social media engagement: What motivates user participation and consumption on
 YouTube?, Computers in Human Behavior, Volume 66, 2017, pp. 236-247.
Smith, Andrew & Fischer, Eileen & Yongjian, Chen. (2012). How Does Brand-related User-
 generated Content Differ across YouTube, Facebook, and Twitter?. Journal of Interactive
 Marketing. 26. 1 pp. 02–113.

 62
You can also read