PRESENTATION TO THE MUNICIPALITY OF THE COUNTY OF INVERNESS - December 4, 2017

Page created by Leslie Stevenson
 
CONTINUE READING
PRESENTATION TO THE MUNICIPALITY OF THE COUNTY OF INVERNESS - December 4, 2017
PRESENTATION TO THE
MUNICIPALITY OF THE COUNTY OF INVERNESS
             December 4, 2017
PRESENTATION TO THE MUNICIPALITY OF THE COUNTY OF INVERNESS - December 4, 2017
NOVA SCOTIA POPULATION TRENDS                                                                                                            2

                                                                                                                                  >17,000
        1/5 Canadians
                                                                                                                                  individuals
        are immigrants
                                                                                                                                  since 2012

          1/33 Atlantic                                                NOVA                                                       Population Gain
         Canadians are                                                SCOTIA                                                      – Aged 55+
            immigrants                                              POPULATION
             Age 15-54,
                                                                      TRENDS
                                                                                                                                  Cape Breton loses
        decline of 4300                                                                                                           800 individuals per
        (-0.9%) in 2016                                                                                                           year

                    In Nova Scotia the additional working-age population in 2016 could not reverse the
                    trend of a shrinking labour force.

*Statistics Canada – Environmental Scan – Nova Scotia 2017 & Canmac Ecomomics ltd. – Cape Breton Economic Outlook (Preliminary Study)
PRESENTATION TO THE MUNICIPALITY OF THE COUNTY OF INVERNESS - December 4, 2017
A LENS ON CAPE BRETON                                                                                                                                       3

                Cape Breton Population by Age Group and Total                                          Cape Breton - Components of Population
               Both Sexes; 0- Both Sexes; 15- Both Sexes; 25- Both Sexes; Both sexes; All                                                      Net             Net
                 14 years        24 years        64 years      65+ years      ages                                                       interprovincial intraprovincial
   2001               26,876         20,375          80,445         23,492      151,188                Births      Deaths     Immigrants    migration       migration
   2002               25,942         20,151          79,987         23,675      149,755
                                                                                 2002                  1284         1602         53            -627           -610
   2003               25,147         20,135          79,608         23,988      148,878
                                                                                 2003                  1240         1570         47            -223           -373
   2004               24,600         19,968          79,680         24,411      148,659
                                                                                 2004                  1258         1550         28            -318            160
   2005               23,482         19,665          79,031         24,711      146,889
                                                                                 2005                  1237         1635         38            -551           -938
   2006               22,604         19,330          78,398         25,111      145,443
                                                                                 2006                  1226         1559         61            -960           -327
   2007               21,856         18,925          77,196         25,329      143,306
                                                                                 2007                  1216         1613         89           -1120           -545
   2008               21,337         18,479          76,435         25,653      141,904
                                                                                 2008                  1352         1580         41            -482           -615
   2009               20,924         18,032          75,770         26,076      140,802
                                                                                 2009                  1270         1527         86            -351           -537
   2010               20,480         17,836          75,279         26,379      139,974
                                                                                 2010                  1251         1634         43            -111           -388
   2011               19,776         17,531          74,445         26,769      138,521
                                                                                 2011                  1123         1630         110           -471           -550
   2012               19,260         17,196          72,730         27,644      136,830
                                                                                 2012                  1161         1525         52            -859           -531
   2013               18,788         16,777          70,923         28,507      134,995
                                                                                 2013                  1156         1553         59            -809           -545
   2014               18,512         16,427          69,359         29,190      133,488
                                                                                 2014                  1146         1582         72            -460           -530
   2015               18,219         16,092          67,934         29,847      132,092
                                                                                 2015                  1143         1620         52            -478           -464
   2016               18,164         15,759          66,849         30,600      131,373
                                                                                 2016                  1144         1646         104           -361           -464
                                                                               Source: Documents>Current Projects>Nova Scotia Regions Macro Outlook 2017>0510059
  Source: Documents>Current Projects>Nova Scotia Regions Macro Outlook 2017>0510059
                 Population by economic region - Tables for Appendices                        Population by economic region - Tables for Appendices

*Canmac Economics Ltd – Cape Breton Economic Outlook (Preliminary Study)
PRESENTATION TO THE MUNICIPALITY OF THE COUNTY OF INVERNESS - December 4, 2017
BENEFITS OF IMMIGRATION                                                                                                               4

          NET                                        BUSINESS                       INCREASE                             HEALTHY
       MIGRATION                                     OWNERS                        OF IMPORTS                        PROFESSIONALS
                                                                                   & EXPORTS

        As the number of deaths                  Immigrants are more likely to      A 1 percent increase in the     Economic immigrants tend to
     exceeds the number of births                  start their own businesses        number of immigrants to           be healthy professionals
      in Canada, immigration will                than the Canadian-born, and        Canada corresponds to an        between 20 to 55 years of age
      become a priority source of                export to countries other than   increase in imports of 0.21 per   who contribute to the tax base
     population growth and labour                             the US.              cent and exports by 0.11 per       and depend less on social
          force replacement.                                                                   cent.                  assistance and health care
                                                                                                                     than the Canadian average.

*Atlantic Immigration Pilot – Key Messages on Fostering Welcoming Communities
PRESENTATION TO THE MUNICIPALITY OF THE COUNTY OF INVERNESS - December 4, 2017
THREE CAPE BRETON PARTNERSHIP IMMIGRATION INITIATIVES                               5

   Cape Breton Local                Cape Breton
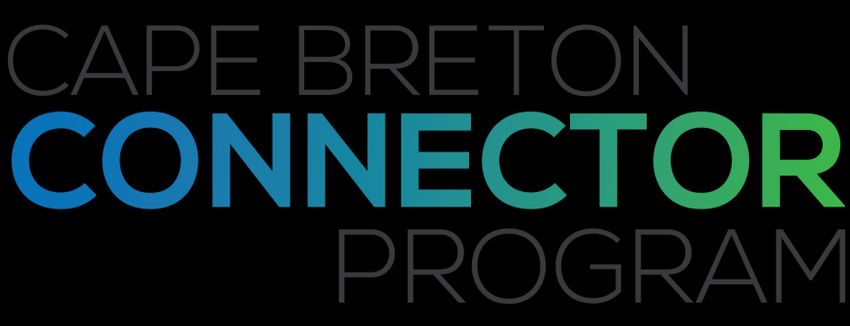
     Immigration                     Connector                   Atlantic
      Partnership                     Program                  Immigration
       (CBLIP)                                                    Pilot
   A collaborative initiative    A networking program       A creative approach to
   fostering welcoming and      matching Connectors and     address labour market
    inclusive communities             Connectees           challenges by attracting /
                                                          retaining recent graduates
                                                             and Foreign Workers
PRESENTATION TO THE MUNICIPALITY OF THE COUNTY OF INVERNESS - December 4, 2017
CAPE BRETON LOCAL IMMIGRATION PARTNERSHIP                         7

DESIGNED TO:                         ACHIEVING THIS BY:

  Improve the integration of            Supporting community-level
  newcomers                             research and planning

  Better integrate immigrant needs      Improving the coordination of
  into local planning                   settlement and integration
                                        services
  Foster welcoming communities          Raising awareness around the
                                        needs of newcomers
CAPE BRETON LOCAL IMMIGRATION PARTNERSHIP   8
CAPE BRETON LOCAL IMMIGRATION PARTNERSHIP   9
WHAT MUNICIPALITIES CAN DO:                                              10

      Bring the unique perspectives of        Share data on immigration and
      Chamber members to the CBLIP Council    newcomers in your municipality

      Act as immigration champions and        Get involved in CBLIP Working
      bring the values of the CBLIP back to   Groups
      your Communities

      Strike a committee that
      addresses issues of diversity and
      inclusion
Connecting work-ready professionals (Connectees) to community and business
                   leaders (Connectors) in Cape Breton.

 The intention is to give the Connectee an understanding of how their industry
         works in Cape Breton and what opportunities may be available.

 Additionally, it’s a great way to for businesses to see what talent is new to the
                                       market.
QUALIFICATIONS OF PARTICIPANTS                                                  13

Connectors                                    Connectees
Connectors are people in a community who      Work Ready Professionals
                                               Local & International Graduates
know large numbers of people and who are in
                                               Immigrants
the habit of making introductions.             African NS
                                               Aboriginals
    Know large numbers of people               People with disabilities
    through social, cultural, professional
    and economic circles                         Post- Secondary Degree or Diploma
    Have a special gift of bringing              Valid work permit
    people together
                                                 Sufficient English/French language skills
    Commitment of time and referrals
                                                 Ready to work
HOW IT WORKS                                                                                 14

         MATCH
         The Connectees will be matched based on industry experience, professional
         backgrounds, or the Connectee’s interest in a specific industry.
         Once the connection has been made, an introduction email is sent to the Connector
         and Connectee to setup a meeting.

          CONNECT
         Once the match has been made, the connector and the Connectee will meet face-to-face
         to discuss things like: industry backgrounds, skills and areas of expertise, industry related
         news, current market demands, and hidden job opportunities in the community.

          REFER
          Connectors are asked to refer the Connectee to a minimum of three people in their
          network, and then each of these people are asked to refer the connectee to three more.
          These referrals may be potential employers, influential leaders within their industry or
          other people who will benefit from meeting with a skilled professional.
PROGRAM OUTCOMES SO FAR                                15

                            25
     51 Registered
     Connectees
                                       39 Registered
                                         Connectors
     4 Overseas

                  0                    50

                        21 Matches
                  9 Connectees Found Jobs
ATLANTIC IMMIGRATION
     PILOT (AIP)
ATLANTIC IMMIGRATION PILOT – GOALS                                      17

   Attract and retain skilled immigrants
   in Atlantic Canada
                                           Address persistent and emerging
                                           labour market needs
  Create strong partnerships between
  federal and provincial governments,
  employers and settlement agencies
                                           Make Atlantic Canada a destination of
                                           choice for immigrants
   Support the Atlantic Growth Strategy
   goals of driving economic growth and
   enhancing the region’s capacity to
   develop and retain a skilled labour     Complement the wider suite of
   force                                   immigration programs available in
                                           Atlantic Canada.
ATLANTIC IMMIGRATION PILOT - BENEFITS                                               18

                                              Broadening the range of jobs that
   Priority processing at the federal level   grants permanent residency to include
   (less than six months)                     NOC C for intermediate-skilled and
                                              international graduates.
   There is no need for employers to          (Food and Beverage Servers, Customer Service
   complete Labour Market Impact              Representatives, Retail Salespersons, Continuing
                                              Care Assistants, Hotel Front Desk Clerks)
   Assessment (LMIA)

                                              Enhances the settlement and
   Temporary pathway to allow                 retention of foreign workers
   candidate to work while permanent
   residence application is processed
                                              Lower Language requirement –
   Flexibility to focus on labour needs in    CLB 4 with commitment from
   each region (highly skilled,               employer for language training
   intermediate skilled and international
   students).
HOW DOES IT WORK?                                                                        19

                                                               What Municipalities can do:

                                                                    •   Tell employers about the
                                                                        opportunity.

                                                                    •   Tell your centers of
                                                                        influences and
                                                                        connections.

                                                                    •   Refer to us employers
                                                                        having labour shortages.
 Connect to a     Apply to      Offer a full-     Apply to
  Settlement     become a      time job to a    have a full-        •   Repeat, Repeat and
   Services      Designated      candidate       time job               Repeat
 Organization   employer by                        offer
                the province                     endorsed
20
OUR OFFICE LOCATION

                                 THANK YOU

     CAPE BRETON LOCAL            CAPE BRETON CONNECTOR       ATLANTIC IMMIGRATION
     IMMIRATION PARTNERSHIP       PROGRAM                     PILOT
     Kailea Pedley                Elva Zhou                   Omar Tag El-Din
     Coordinator                  Coordinator                 Program Lead
     902-258-7331                 902-562-0122                902-562-0122
     local.immigration@           connector@                  omar@
     capebretonpartnership.com    capebretonpartnership.com   capebretonpartnership.com
You can also read