Probing cerebellar involvement in cognition through a meta analysis of TMS evidence
←
→
Page content transcription
If your browser does not render page correctly, please read the page content below
www.nature.com/scientificreports
OPEN Probing cerebellar
involvement in cognition
through a meta‑analysis of TMS
evidence
Daniele Gatti1*, Luca Rinaldi1,2, Ioana Cristea1 & Tomaso Vecchi1,2
Traditionally, the cerebellum has been linked to motor coordination, but growing evidence points
to its involvement in a wide range of non-motor functions. Though the number of studies using
transcranial magnetic stimulation (TMS) to investigate cerebellar involvement in cognitive processes
is growing exponentially, these findings have not yet been synthesized in a meta-analysis. Here, we
used meta-analysis to estimate the effects of cerebellar TMS on performance in cognitive tasks for
healthy participants. Outcomes included participants’ accuracy and response times (RTs) of several
non-motor tasks performed either during or after the administration of TMS. We included overall
41 studies, of which 44 single experiments reported effects on accuracy and 41 on response times
(RTs). The meta-analyses showed medium effect sizes (for accuracy: d = 0.61 [95% CI = 0.48, .073]; for
RTs: d = 0.40 [95% CI = 0.30, 0.49]), with leave-one-out analyses indicating that cumulative effects
were robust, and with moderate heterogeneity. For both accuracy and RTs, the effect of TMS was
moderated by the stimulation paradigm adopted but not by the cognitive function investigated, while
the timing of the stimulation moderated only the effects on RTs. Further analyses on lateralization
revealed no moderation effects of the TMS site. Taken together, these findings indicate that TMS
administered over the cerebellum is able to modulate cognitive performance, affecting accuracy or
RTs, and suggest that the various stimulation paradigms play a key role in determining the efficacy of
cerebellar TMS.
The human cerebellum has been traditionally studied in relation to motor functions. Yet growing evidence sup-
ports the involvement of the cerebellum in a wide range of non-motor functions, spanning from the cognitive to
the emotional domains (e.g., emotive processing1; perceptual processing2; cognitive processing3; language4; and
for an overall overview see5,6). To account for the cerebellar contribution in non-motor processes, Schmahmann7
proposed the so-called dysmetria of thought hypothesis, arguing that the cerebellum performs the same com-
putational processes across all domains in which it is involved in. Evidence supporting this perspective comes
from studies showing that the microstructure of the cerebellar cortex is uniform8 and that cerebro-cerebellar
connections are s egregated9–11. Specifically, structural uniformity would underlie functional uniformity and
the segregated cerebro-cerebellar connections would allow specific cerebellar modules to participate in specific
cognitive functions12.
Cerebellar modulation of motor and non-motor behavior has been primarily investigated through neuro-
stimulation techniques, such as transcranial direct current stimulation (tDCS) or transcranial magnetic stimu-
lation (TMS). This growing evidence was synthesized in several qualitative r eviews13–16 as well as in a recent
meta-analysis, demonstrating that anodal and cathodal cerebellar tDCS are effective in modulating participants’
performance (i.e., whether in the form of cognitive impairment or enhancement) and that the effect of cerebellar
tDCS on motor functions is higher compared with non-motor f unctions17. Yet, no systematic review has insofar
examined cerebellar modulation by synthesizing the evidence for TMS.
Here, we are therefore interested in quantifying the effect of TMS across non-motor functions. This choice is
motivated by the significant increase of TMS studies investigating cerebellar involvement in non-motor functions,
as well as by the theoretical difficulty to frame cerebellar involvement in cognitive processing. Furthermore, we
note that the inclusion of the studies investigating motor functions could be problematic from a metanalytic
point of view as they are highly heterogeneous: that is, the studies that investigated cerebellar involvement in
1
Department of Brain and Behavioral Sciences, University of Pavia, Piazza Botta 6, 27100 Pavia, Italy. 2Cognitive
Psychology Unit, IRCCS Mondino Foundation, Pavia, Italy. *email: daniele.gatti@unipv.it
Scientific Reports | (2021) 11:14777 | https://doi.org/10.1038/s41598-021-94051-5 1
Vol.:(0123456789)www.nature.com/scientificreports/
motor processes using TMS highly differ in terms of paradigms a dopted18–24, dependent variables used25–27 and
population tested28,29, and could not consequently be directly comparable.
TMS is a noninvasive brain stimulation technique that uses electromagnetic induction principles to induce
electrical currents in the brain30,31. Albeit the precise mechanisms through which TMS influences brain func-
tion are currently not fully understood, this technique is thought to stimulate axons placed in the cortex or in
the white matter and to not directly modulate cell bodies activity32. Typically, TMS is used to investigate the
link between the activity of a certain brain area and a motor or non-motor function, since a change in behavior
induced by TMS (i.e., generally measured using accuracy or response times, RTs) is causally informative of
the relationship among the area stimulated and the function investigated33. It should be noted that TMS does
not necessarily cause performance disruption; in some specific conditions, TMS can also induce performance
enhancement. Performance enhancement has been ascribed to direct modulation of a cortical region involved
in one function, but also to indirect modulation (i.e., diaschisis), to non-specific effect of the stimulation (e.g.,
intersensory facilitation), or to addition-by-subtraction processes, which is a disruption of those processes sup-
posed to compete or distract from task performance34. Within this context is should be noted that, given the
assumption that every performance modulation (impairment or enhancement) is thought to be caused by the
stimulation, it is impossible to observe “real” negative effects. This point was indeed handled by previous meta-
analyses by computing both absolute and signed effect sizes, but focusing mainly on the f ormer17.
TMS has been employed to the study of cerebellar functions, both in the motor and non-motor domains35.
Cerebellar TMS aims at investigating temporal features of cerebellar-cortical c onnectivity36 as well as more basic
features of cerebellar involvement in various processes. For instance, for the motor domain, TMS evidence indi-
cates that the cerebellum exerts an inhibitory effect on motor a reas18, that it is involved in saccadic a daptation19,20,
and in the acquisition and extinction of conditioned responses21–24. Similarly, for the cognitive domain, TMS
evidence supports cerebellar involvement in semantic m emory37, working m emory38, executive f unctions39, social
cognition40 and spatial p rocessing41. However, the cerebellar cortex is significantly different compared with other
cortical areas, such as the frontal or temporal regions of the brain, in terms of number of neurons, composition
of neurons and glia and their organization8. Because of these key differences, it is not known whether the effects
of TMS could be similar to the effects reported for the other areas of the cerebral cortex.
Here, we therefore propose a systematic review and meta-analysis to quantify the effect of TMS in non-motor,
cognitive domains. Despite the proliferation of this literature, no such review currently exists. We focus on stud-
ies of non-motor function because as a whole they are more homogeneous in terms of paradigms, dependent
variables and populations. We also aim to parse variability by looking at potential moderators of effect, such as
differences in stimulation paradigms in terms of burst pattern (e.g., double pulse, triple pulse, etc.) or timing
(online vs. offline), function investigated, or cerebellar site stimulated. Quantifying the effect of TMS across non-
motor functions or possible moderators identified could provide parameters for the use by future TMS studies
targeting the cerebellum. As any performance modulation (impairment or enhancement) could be potentially
ascribed to TMS influence, in line with previous methodological a pproaches17 we ran different meta-analyses
on absolute and signed effect sizes: the former approach indeed accounts for any cognitive modulation induced
by cerebellar TMS (whether in the form of impairment or enhancement), while the latter may be useful to gain
insights into the specific direction of the effect (whether cerebellar TMS typically leads to cognitive impairment
or enhancement).
Materials and methods
Identification and selection of studies. To identify potential studies for inclusion in the meta-analysis,
we systematically searched Pubmed for studies conducted from January 2000 (the first TMS study targeting the
cerebellum and investigating non-motor functions has been performed by Rami et al.42) to January 2021. We
used the following search string: “((((((transcranial magnetic stimulation) OR tms) OR rtms) OR theta burst)
OR tbs)) AND ((cerebellum) OR cerebellar)”. We also manually checked references for narrative reviews inves-
tigating cerebellar involvement in cognition using neurostimulation techniques13–16. Study identification and
selection was performed by DG.
We included studies with the following characteristics: (i) a sample composed by healthy and adult partici-
pants, (ii) the administration of TMS for at least one cerebellar site, (iii) the presence of a cognitive (i.e., non-
motor) performance index, (iv) the use of accuracy and/or response times (RTs) as dependent variables, (v) the
adoption of cerebellar TMS protocols with the explicit intention to modulate cerebellar function.
From each study, we extracted: the sample size, the dependent variable(s) of interest (accuracy, response
times), the cerebellar site stimulated, the stimulation paradigm adopted (e.g., theta-burst stimulation, triple-pulse
TMS, single-pulse TMS), the design of the study, the control condition adopted, the timing of the stimulation,
the mean and standard deviation of participants’ performance in the various conditions, and the specific cogni-
tive function investigated.
Effect size calculations. Accuracy and RTs were the dependent variables of interest. For each dependent
variable, from each study, we included only one effect size (see Supplementary Material for more information
regarding which effect was chosen for each study). This procedure is considered as the most straightforward one
in case of within-participants dependencies in the same study43.
The effect size used was Cohen’s d44. Cohen’s d for between-participants designs is defined as the mean
standardized difference between the two measurements (in our case, cerebellar TMS vs. control area / no TMS
/ sham stimulation). For within-participants designs, Cohen’s d computation requires taking into account the
correlation between the two measurements (cerebellar TMS vs. control area / sham stimulation / no TMS; see
Scientific Reports | (2021) 11:14777 | https://doi.org/10.1038/s41598-021-94051-5 2
Vol:.(1234567890)www.nature.com/scientificreports/
Table 1 for more information regarding the control condition used by each study included); that is, the mean
difference between the two measurements is divided by:
(SD21 + SD22 ) − (2 × r × SD1 × SD2 )
That is, the mean difference is divided by the square root of the difference between the sum of the two squared
standard deviations of the means (SD) and the multiplication among the two SDs and twice the correlation
between the means (r).
For between-participants designs the effect size and variance calculation were performed using R45 and its
package compute.es46 using the functions mes or pes. The calculation of Cohen’s d for within-participants was
performed using a value of r = 0.75. This value was obtained by computing the correlation between measurements
(pooling individual participants’ data) in four published papers investigating left cerebellar participation in social
cognition41, spatial c ognition47 and semantic m
emory48,49 and from one in preparation from our lab, investigat-
ing right cerebellar participation in semantic p rocessing50. The computed correlations ranged from r = 0.64 to
r = 0.95 (Mean = 0.78, SD = 0.10). To further control for the possible variability of this measure, we also computed
Cohen’s d using a value of r = 0.5 and ran sensitivity analyses. All the Cohens’ d included were either used in
their relative sign or transformed in their absolute value, due to the difficulty to estimate “negative” effects when
employing brain stimulation techniques: we thus ran separated meta-analyses on signed and absolute effect-sizes.
For the studies employing a task explicitly used as a control task, only the data from the target task was used
to calculate the effect size. We expected several studies to employ more than one task: a “target task”, which is
thought to measure a specific function, and a “control task”, which is thought to measure a non-relevant (i.e.,
for the specific purpose of a certain study) function. When performing cerebellar TMS, the adoption of control
tasks is particularly important to exclude non-specific effects. The absence of a cerebellar TMS effect in the
control task is generally interpreted as evidence of the (possible) main effect of cerebellar TMS in the target task
(thus excluding non-specific effects). In such cases, we consequently included only the data from the target task.
The effect size was then computed on the target task, measuring the difference between cerebellar TMS and a
control TMS condition using the following rules (in hierarchical order; for more information about the control
TMS condition, see Table 1): (i) when available sham, vertex stimulation or no TMS trials within cerebellar TMS
session; (ii) if not available, the condition without TMS; (iii) stimulation of a control area; (iv) stimulation of
another cerebellar area.
For the studies investigating pre vs. post cerebellar stimulation, if possible, we computed the effect size com-
paring post cerebellar TMS and post control condition (following the above-mentioned rules). If, within one
study, more than one experiment was performed between cerebellar TMS and control conditions (i.e., including
different samples of participants), we considered these experiments as independent ones.
For a certain number of studies, it was impossible to identify an effect more relevant than others (e.g., see:42,
in which right cerebellar TMS was administered across five different tasks and no significant effects were found).
In such cases (see Table 1), the effect sizes were aggregated using the R-package MAd51, with the function agg.
This function simultaneously aggregates all the effect sizes implementing Borenstein p rocedure52 for aggregat-
ing dependent effect sizes. Please also note that data from different dependent variables were not aggregated,
but kept separated.
When complete data were provided only graphically, effect sizes and variances were computed using the
function mes, and the descriptive statistics were extracted from the figures using the WebPlotDigitizer s oftware53.
Meta‑analyses. We performed two separate meta-analyses, one for each dependent variable (i.e., accuracy
and RTs) on the absolute effect sizes. We also performed four distinct meta-regressions (i.e., two on accuracy
and two on RTs as main dependent variables, respectively) to assess if the stimulation timing (online vs. offline)
and the stimulation paradigm adopted (e.g., theta-burst stimulation, triple-pulse TMS, single-pulse TMS, etc.)
moderated the observed effect. Two additional meta-regressions (i.e., one on each dependent variable) were
performed to assess if the specific cognitive function (for a full list of cognitive functions see Table 1) moderated
the observed effect.
Next, to investigate if the effect of cerebellar TMS was moderated by the site of stimulation (i.e., left vs. medial
vs. right cerebellum), we first performed two meta-analyses (one for each dependent variable) excluding the stud-
ies which employed as control condition another cerebellar area, and then we performed two meta-regressions
with the site of stimulation as moderator, again using the absolute effect sizes.
All the analyses were performed with restricted maximum-likelihood estimator method. The alpha for the
p-values was set at = 0.01 (Bonferroni correction for multiple testing). The meta-analyses and meta-regressions
performed, as well as the related plots, were computed using the R-package metafor57.
Heterogeneity was evaluated using the Q-test. In addition, we also report I254, which provides the percent-
age of the total variability in the effect size estimation that could be attributed to heterogeneity among the true
effect (heterogeneity is considered high if I2 > 75%54). To further investigate heterogeneity, we also computed the
prediction intervals (PI) of the effect, which quantify the dispersion of effect. That is, 95% PI indicate the range
of values that the effect size of a future study similar to those included should probably take.
Publication bias was evaluated using funnel plots, the trim-and-fill m ethod55 and Egger’s t est56. The trim-and-
fill method provides an estimate of the number of studies missing from the meta-analysis due to the suppression
of the most extreme results on one side (generally the left, i.e., non-significant results) of the plot. The Egger’s
test examines if the funnel plot is asymmetric performing a regression of the effect size on the standard error
weighted by the inverse variance, a significant p value indicates publication bias. To explore the robustness of the
Scientific Reports | (2021) 11:14777 | https://doi.org/10.1038/s41598-021-94051-5 3
Vol.:(0123456789)www.nature.com/scientificreports/
ES.5 ES.75
Study ID Function Paradigm Timing Design Dep.var Exp N TMS site CC ES.5 V.5 ES.75 V.75 Agg direction direction
37 Semantic
cTBS Offline Between RTs 1 24 RC No TMS 0,83 0,18 0,83 0,18 N 0,83 0,83
Memory
37 Semantic
cTBS Offline Between RTs 1 22 MC No TMS 0,24 0,18 0,24 0,18 N -0,24 -0,24
Memory
38 Working
spTMS Online Within Accuracy 1 17 RC No TMS 0,12 0,06 0,16 0,03 N 0,12 0,16
Memory
38 Working
spTMS Online Within RTs 1 17 RC No TMS 0,32 0,06 0,43 0,03 N -0,32 -0,43
Memory
39 Executive
cTBS Offline Between Accuracy 1 27 RC vs LC Cerebellum 0,79 0,16 0,79 0,16 N NA NA
Functions
40 Social
tpTMS Online Within Accuracy 1 32 MC Vertex 0,35 0,03 0,50 0,02 N -0,35 -0,50
Cognition
40 Social
tpTMS Online Within RTs 1 32 MC Vertex 0,10 0,03 0,14 0,02 N 0,10 0,14
Cognition
40 Social
tpTMS Online Within Accuracy 2 48 MC Vertex 0,35 0,02 0,49 0,01 N -0,35 -0,49
Cognition
40 Social
tpTMS Online Within RTs 2 48 MC Vertex 0,03 0,02 0,04 0,01 N -0,03 -0,04
Cognition
40 Social
tpTMS Online Within Accuracy 3 32 LC Vertex 0,44 0,03 0,63 0,02 N -0,44 -0,63
Cognition
40 Social
tpTMS Online Within RTs 3 32 LC Vertex 0,09 0,03 0,13 0,02 N 0,09 0,13
Cognition
41 Spatial
tpTMS Online Within Accuracy 1 12 MC Sham 0,42 0,09 0,58 0,05 N -0,42 -0,58
cognition
41 Spatial
tpTMS Online Within RTs 1 12 MC Sham 0,04 0,08 0,05 0,04 N -0,04 -0,05
cognition
41 Spatial
tpTMS Online Within Accuracy 2 12 LC Sham 0,12 0,08 0,16 0,04 N 0,12 0,16
cognition
41 Spatial
tpTMS Online Within RTs 2 12 LC Sham 0,06 0,08 0,09 0,04 N 0,06 0,09
cognition
Memory
42
(various HFrTMS Online Within Accuracy 1 16 RC No TMS 0,40 0,04 0,56 0,02 N NA NA
sub-types)
47 Spatial
spTMS Online Within Accuracy 1 30 MC Vertex 0,13 0,03 0,18 0,02 N NA NA
cognition
47 Spatial
spTMS Online Within RTs 1 30 MC Vertex 0,02 0,03 0,03 0,02 N NA NA
cognition
47 Spatial
spTMS Online Within Accuracy 2 24 LC Vertex 0,52 0,05 0,64 0,03 N NA NA
cognition
47 Spatial
spTMS Online Within RTs 2 24 LC Vertex 0,53 0,05 0,71 0,02 N NA NA
cognition
48 Semantic
tpTMS Online Within Accuracy 1 24 RC Vertex 0,50 0,05 0,62 0,02 N -0,50 -0,62
Memory
48 Semantic
tpTMS Online Within RTs 1 24 RC Vertex 0,26 0,04 0,36 0,02 N -0,26 -0,36
Memory
48 Semantic
tpTMS Online Within Accuracy 2 20 RC Visual C 0,76 0,06 0,90 0,03 N -0,76 -0,90
Memory
48 Semantic
tpTMS Online Within RTs 2 20 RC Visual C 0,13 0,05 0,18 0,02 N -0,13 -0,18
Memory
Memory
49
(various tpTMS Online Within Accuracy 1 24 RC Vertex 0,11 0,05 0,15 0,02 N -0,11 -0,15
sub-types)
Memory
49
(various tpTMS Online Within Accuracy 2 32 RC Vertex 0,36 0,03 0,51 0,02 N -0,36 -0,51
sub-types)
58 Semantic
cTBS Offline Within RTs 1 19 LC vs RC Cerebellum 0,54 0,06 0,77 0,03 N NA NA
Memory
Sham &
59 RC vs LC
Attention cTBS Offline Between Accuracy 1 45 Cerebel- 0,96 0,11 0,96 0,11 N NA NA
& Sham
lum
60 Semantic
cTBS Offline Within Accuracy 1 4 MC vs RC Cerebellum 0,92 0,36 1,24 0,18 N NA NA
Memory
60 Semantic
cTBS Offline Within RTs 1 8 MC vs RC Cerebellum 0,96 0,18 1,09 0,09 N NA NA
Memory
61 Semantic
cTBS Offline Between RTs 1 24 MC vs RC Cerebellum 0,66 0,18 0,66 0,18 N NA NA
Memory
62
Timing LFrTMS Offline Between Accuracy 1 26 RC Sham 0,51 0,16 0,51 0,16 N -0,51 -0,51
Continued
Scientific Reports | (2021) 11:14777 | https://doi.org/10.1038/s41598-021-94051-5 4
Vol:.(1234567890)www.nature.com/scientificreports/
ES.5 ES.75
Study ID Function Paradigm Timing Design Dep.var Exp N TMS site CC ES.5 V.5 ES.75 V.75 Agg direction direction
63 Working
dpTMS Online Within Accuracy 1 9 RC No TMS 1,51 0,24 2,12 0,12 N -1,51 -2,12
Memory
63 Working
dpTMS Online Within RTs 1 9 RC No TMS 0,13 0,11 0,19 0,06 N -0,13 -0,19
Memory
64 Episodic
HFrTMS Offline Within Accuracy 1 24 RC Visual C 0,38 0,04 0,54 0,02 N 0,38 0,54
Memory
65
Attention iTBS Offline Within Accuracy 1 14 fmri_based Cerebellum 0,13 0,07 0,19 0,04 N NA NA
66 Working
tpTMS Online Within Accuracy 1 18 RC Vertex 0,60 0,07 0,83 0,03 N -0,60 -0,83
Memory
66 Working
tpTMS Online Within RTs 1 18 RC Vertex 0,15 0,06 0,21 0,03 N -0,15 -0,21
Memory
66 Working
tpTMS Online Within Accuracy 2 18 RC Vertex 0,42 0,06 0,55 0,03 N -0,42 -0,55
Memory
66 Working
tpTMS Online Within RTs 2 18 RC Vertex 0,10 0,06 0,14 0,03 N -0,10 -0,14
Memory
67 Social
tpTMS Online Within Accuracy 1 36 LC Vertex 0,11 0,03 0,15 0,01 N -0,11 -0,15
Cognition
67 Social
tpTMS Online Within RTs 1 36 LC Vertex 0,06 0,03 0,08 0,01 N -0,06 -0,08
Cognition
67 Social
tpTMS Online Within Accuracy 2 20 LC Visual C 0,17 0,05 0,24 0,03 N -0,17 -0,24
Cognition
67 Social
tpTMS Online Within RTs 2 20 LC Visual C 0,38 0,05 0,54 0,03 N 0,38 0,54
Cognition
67 Social
tpTMS Online Within Accuracy 3 20 LC Visual C 0,18 0,05 0,25 0,03 N -0,18 -0,25
Cognition
67 Social
tpTMS Online Within RTs 3 20 LC Visual C 0,47 0,06 0,66 0,03 N -0,47 -0,66
Cognition
68 Social
tpTMS Online Within Accuracy 1 20 LC Vertex 0,49 0,06 0,69 0,03 N -0,49 -0,69
Cognition
68 Social
tpTMS Online Within RTs 1 20 LC Vertex 0,11 0,05 0,15 0,03 N 0,11 0,15
Cognition
68 Social
tpTMS Online Within Accuracy 2 20 LC Vertex 0,69 0,06 0,92 0,03 N -0,69 -0,92
Cognition
68 Social
tpTMS Online Within RTs 2 20 LC Vertex 0,05 0,05 0,07 0,03 N 0,05 0,07
Cognition
69
Timing LFrTMS Offline Within Accuracy 1 10 RC vs LC Cerebellum 0,71 0,12 0,94 0,06 N NA NA
70 Social
tpTMS Online Between Accuracy 1 40 RC No TMS 0,04 0,10 0,04 0,10 N NA NA
Cognition
70 Social
tpTMS Online Between RTs 1 40 RC No TMS 0,47 0,10 0,47 0,10 N NA NA
Cognition
71 Semantic
cTBS Offline Within RTs 1 21 RC Vertex 0,56 0,06 0,78 0,03 N 0,56 0,78
Memory
71 Semantic
cTBS Offline Within RTs 2 20 LC Vertex 0,29 0,05 0,40 0,03 N -0,29 -0,40
Memory
72
Timing HFrTMS Online Within RTs 1 16 RC No TMS 0,49 0,07 0,69 0,04 N 0,49 0,69
73
Timing cTBS Offline Between Accuracy 1 24 MC Sham 1,00 0,19 1,00 0,19 N -1,00 -1,00
74
Timing LFrTMS Offline Within Accuracy 1 9 LC DLPFC 0,31 0,12 0,44 0,06 N -0,31 -0,44
74
Timing HFrTMS Online Within Accuracy 2 8 LC Vertex 0,04 0,13 0,06 0,06 N 0,04 0,06
75
Music LFrTMS Offline Within RTs 1 14 RC Sham 0,56 0,08 0,78 0,04 N -0,56 -0,78
76 Semantic
LFrTMS Offline Between RTs 1 43 RC Vertex 0,69 0,10 0,69 0,10 N -0,69 -0,69
Memory
77
Timing cTBS Offline Within Accuracy 1 14 RC DLPFC 0,44 0,08 0,62 0,04 N -0,44 -0,62
78 Spatial
LFrTMS Offline Within Accuracy 1 8 LC Neck 2,15 0,83 3,37 0,42 N NA NA
cognition
79 Semantic
LFrTMS Offline Between Accuracy 1 24 RC vs LC Cerebellum 3,04 0,27 3,04 0,27 Y NA NA
Memory
79 Semantic
LFrTMS Offline Between RTs 1 24 RC vs LC Cerebellum 0,69 0,13 0,69 0,13 Y NA NA
Memory
80 Executive
cTBS Offline Between Accuracy 1 14 LC Sham 0,30 0,29 0,30 0,29 N -0,30 -0,30
Functions
80 Executive
cTBS Offline Between RTs 1 14 LC Sham 1,62 0,38 1,62 0,38 N -1,62 -1,62
Functions
80 Executive
cTBS Offline Between Accuracy 2 14 LC Sham 0,00 0,29 0,00 0,29 N 0,00 0,00
Functions
80 Executive
cTBS Offline Between RTs 2 14 LC Sham 2,17 0,45 2,17 0,45 N -2,17 -2,17
Functions
Continued
Scientific Reports | (2021) 11:14777 | https://doi.org/10.1038/s41598-021-94051-5 5
Vol.:(0123456789)www.nature.com/scientificreports/
ES.5 ES.75
Study ID Function Paradigm Timing Design Dep.var Exp N TMS site CC ES.5 V.5 ES.75 V.75 Agg direction direction
81 Executive
cTBS Offline Between Accuracy 1 28 LC Sham 0,52 0,15 0,52 0,15 N 0,52 0,52
Functions
81 Executive
cTBS Offline Between RTs 1 28 LC Sham 0,71 0,15 0,71 0,15 N -0,71 -0,71
Functions
81 Executive
cTBS Offline Between Accuracy 2 28 LC Sham 0,22 0,14 0,22 0,14 N -0,22 -0,22
Functions
81 Executive
cTBS Offline Between RTs 2 28 LC Sham 0,19 0,14 0,19 0,14 N 0,19 0,19
Functions
82 Executive
cTBS Offline Within RTs 1 12 LC Sham 0,22 0,05 0,29 0,03 Y NA NA
Functions
83 Executive
LFrTMS Offline Within Accuracy 1 16 RC vs LC Cerebellum 0,47 0,05 0,59 0,02 Y NA NA
Functions
83 Executive
LFrTMS Offline Within RTs 1 16 RC vs LC Cerebellum 0,57 0,05 0,80 0,02 Y NA NA
Functions
84 Social
HFrTMS Online Within RTs 1 15 MC Sham 0,33 0,07 0,47 0,04 N -0,33 -0,47
Cognition
85 Working
dpTMS Online Within Accuracy 1 23 RC No TMS 0,85 0,06 1,07 0,03 N -0,85 -1,07
Memory
85 Working
dpTMS Online Within RTs 1 23 RC No TMS 0,33 0,05 0,44 0,02 N -0,33 -0,44
Memory
86 Working
cTBS Offline Within Accuracy 1 10 RC vs LC Cerebellum 0,82 0,10 1,13 0,05 Y NA NA
Memory
86 Working
cTBS Offline Within RTs 1 10 RC vs LC Cerebellum 0,13 0,08 0,17 0,04 Y NA NA
Memory
87 Working
cTBS Offline Within Accuracy 1 10 RC vs LC Cerebellum 0,45 0,11 0,60 0,06 Y NA NA
Memory
87 Working
cTBS Offline Within RTs 2 13 RC vs LC Cerebellum 0,48 0,09 0,67 0,05 y NA NA
Memory
88
Learning LFrTMS Offline Between RTs 1 36 RC No TMS 0,27 0,27 0,27 0,27 Y NA NA
89
Learning LFrTMS Offline Between Accuracy 1 28 LC Vertex 0,88 0,21 0,88 0,21 N -0,88 -0,88
Table 1. The studies included in this meta-analysis. TBS theta-burst stimulation, LFrTMS low-frequency
repetitive TMS, tpTMS triple-pulse TMS, spTMS single-pulse TMS, HFrTMS high-frequency repetitive TMS,
dpTMS double-pulse TMS, LC left cerebellum, RC right cerebellum, MC medial cerebellum, ES.5; V.5 effect
size and variance with r = 0.5, ES.75; V.75 effect size and variance with r = 0.75, Exp experiment, N sample
numerosity, CC control condition, Agg aggregated data, ES.5 direction; ES.75 direction signed effect size. More
information is available in the Supplementary Material.
results, we performed a leave-one-out analysis: this procedure evaluates the robustness of the effect excluding
one study at a time.
Finally, we performed sensitivity analyses performing the two main meta-analyses on accuracy and RTs
including the effect sizes of the within-participants designs computed with r = 0.5.
Note that, as discussed before, we also we performed four additional meta-analyses (two on accuracy and
two on RTs), this time using signed effect sizes (i.e., not transformed in absolute value; thus disentangling
performance impairment from enhancement) and hence recomputing the two possible correlations between
measurements. In this case, negative effect sizes index performance impairment, while positive effect sizes index
performance enhancement. Yet, the analyses on signed effect sizes were performed only on studies comparing
cerebellar vs. control condition different from the stimulation of another cerebellar site (in those comparing two
cerebellar sites it is generally not possible to infer performance impairment or enhancement). Similarly, the stud-
ies in which there is no default performance impairment or enhancement (e.g., as in the case of pseudoneglect)
were excluded from the analyses on signed effect size.
Additional information, including the plots of the meta-analyses performed using signed effect sizes as well
as the tables with the number of the studies per condition of the non-significant meta-regressions is reported
as Supplementary Material.
Results
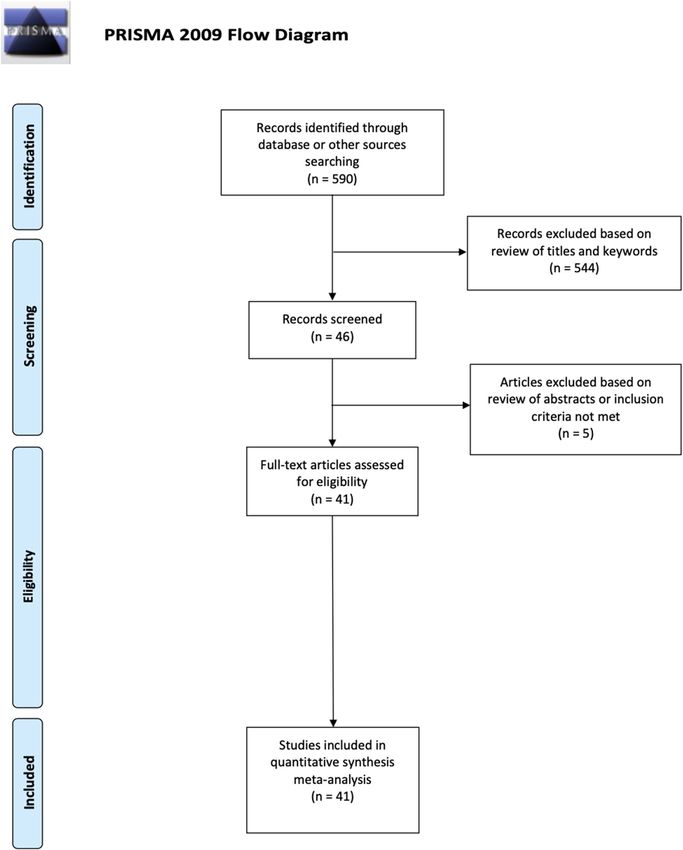
Study selection. The literature search identified 590 articles (Fig. 1—PRISMA flowchart). Following the
adoption of our selection criteria, a total of 41 studies were included in the present meta-analysis37–42,47–49,58–89).
In total, because some studies reported both accuracy and RTs or performed more than one experiment, 85
effects were included, 44 on accuracy and 41 on RTs.
Study characteristics. The characteristics of the included experiments are reported in Table 1. Studies
were conducted between 2003 and 2020.
Of the 44 experiments included using accuracy as dependent variable, 11 were performed with a between-
participants design, while 33 with a within-participants design. Of the 41 experiments included using RTs as
Scientific Reports | (2021) 11:14777 | https://doi.org/10.1038/s41598-021-94051-5 6
Vol:.(1234567890)www.nature.com/scientificreports/
Figure 1. Flowchart illustrating study selection, review strategy and data extraction, retrieved from: http://
prisma-statement.org/documents/PRISMA%202009%20flow%20diagram.pdf.
Scientific Reports | (2021) 11:14777 | https://doi.org/10.1038/s41598-021-94051-5 7
Vol.:(0123456789)www.nature.com/scientificreports/
dependent variable, 11 were performed with a between-participants design and 30 with a within-participants
design.
For timing of stimulation, of the 44 experiments included using accuracy as dependent variable, 24 targeted
the cerebellum while participants performed the task (i.e., online stimulation), while 20 targeted the cerebellum
before the task or between two task sessions (i.e., offline stimulation). Of the 41 experiments included using RTs
as dependent variable, 22 adopted online paradigms and 19 offline ones.
Concerning the stimulation paradigm, of the 44 experiments included using accuracy as dependent variable,
2 used double-pulse TMS (dpTMS), 3 high-frequency rTMS (HFrTMS), 7 low-frequency rTMS (LFrTMS), 3
single-pulse TMS (spTMS), 1 intermittent TBS (iTBS), 11 continuous TBS (cTBS), 17 triple-pulse TMS (tpTMS).
Of the 41 experiments included using RTs as dependent variable, 2 used dpTMS, 2 HFrTMS, 5 LFrTMS, 3
spTMS, 14 cTBS and 15 tpTMS. F ollowing31, we considered as HFrTMS those paradigms employing a TMS
frequency > 1 Hz.
With regards to the specific cognitive function investigated, of the 44 experiments included using accuracy
as dependent variable, 2 investigated attention, 1 episodic memory, 6 executive functions, 1 learning, 3 vari-
ous sub-types of memory, 4 semantic memory, 9 social cognition, 5 spatial cognition, 6 timing and 7 working
memory. Of the 41 experiments included using RTs as dependent variable, 6 investigated executive functions, 1
learning, 1 music, 11 semantic memory, 10 social cognition, 4 spatial cognition, 1 timing and 7 working memory.
In particular, here the term learning refers to procedural learning, while with various sub-types of memory we
target studies that employed tasks thought to measure more than one memory function (e.g., measuring both
episodic and semantic memory49) or whose results have been aggregated across several memory functions (com-
prising episodic, semantic, working and short-term memory42). Finally, with timing we target studies assessing
the representation and perception of time, thus not including musical processing.
Accuracy. Random effects meta-analysis (N = 44) showed a medium mean effect size, d = 0.61 [95% CI = 0.48,
0.73; 95% PI = − 0.08, 1.30], z = 9.56, p < 0.0001, indicating that cerebellar TMS significantly affects participants’
accuracy compared to control conditions. Total heterogeneity was significant, QT = 157.68, p = < 0001, I2 = 77%,
suggesting moderate variance across the experiments included (Fig. 2).
The leave-one-out analysis showed that the effect size was highly robust and ranged between 0.57 and 0.62
(M = 0.61, SD = 0.01). The trim and fill method did not add hypothetical missing studies on the left side of the fun-
nel plot (Fig. 3). The Egger’s test was significant, z = 3.70, p = 0.0002, supporting the possibility of publication bias.
A first meta-regression did not show any moderation induced by stimulation timing (N = 44), χ2(1) = 3.50,
p = 0.06. Heterogeneity remained significant, QT = 149.74, p < 0.0001, I2 = 76%.
A second meta-regression showed that stimulation paradigm moderated effects (N = 44), χ2(6) = 23.23,
p = 0.0007. Heterogeneity remained significant, QT = 111.16, p < 0.0001, but I2 decreased, I2 = 67%. The decrease
in heterogeneity suggests that the stimulation paradigm plays a role in determining the differences in the effects
reported by the various studies (Table 2).
A third meta-regression did not show any moderation induced by the specific cognitive function investigated
(N = 44), χ2(9) = 10.77, p = 0.29. Heterogeneity remained significant, QT = 127.97, p < 0.0001, I2 = 79%.
Response times. The random effect meta-analysis (N = 41) showed a medium effect size, d = 0.40 [95%
CI = 0.30, 0.49; 95% PI = -0.05, 0.85], z = 8.19, p < 0.0001, meaning that cerebellar TMS significantly affects par-
ticipants’ RTs compared to control conditions. Total heterogeneity was significant and moderate, QT = 105.95,
p < 0.0001, I2 = 60% (Fig. 4).
The leave-one-out analysis showed that the effect size ranged between 0.38 and 0.41 (M = 0.40, SD = 0.008).
The trim and fill method added 11 hypothetical missing studies on the left side of the funnel plot (Fig. 5). Add-
ing these hypothetical studies, the effect size became smaller but still significant, d = 0.28 [95% CI = 0.17, 0.38],
z = 5.11, p < 0.0001, and the heterogeneity remained significant, QT = 186.49, p < 0.0001, I2 = 73%. The Egger’s test
was significant, z = 3.28, p = 0.001, supporting the possibility of publication bias.
A first meta-regression showed that stimulation timing (N = 41) moderated effects, χ2(1) = 17.25, p < 0.0001.
Heterogeneity remained significant, QT = 71.45, p = 0.001, and I2 decreased, I2 = 44%, suggesting that the stimula-
tion timing plays a role in determining the differences in the effects reported by the various studies. In particular,
offline paradigms reported significantly higher effect sizes comparted with online ones, with both paradigms
reporting cumulative effect sizes significantly different from zero (Table 3).
A second meta-regression showed stimulation paradigm moderated effects (N = 41), χ2(5) = 26.44, p < 0.0001.
Heterogeneity remained significant, QT = 57.22, p = 0.01, but I2 decreased, I2 = 37%. The decrease in heterogeneity
suggests that the stimulation paradigm plays a role in determining the differences in the effects reported by the
various studies (Table 4).
A third meta-regression did not show any moderation induced by the specific cognitive function investigated
(N = 41), χ2(7) = 15.11, p = 0.03. Heterogeneity decreased slightly but remained significant, QT = 70.59, p = 0.0002,
I2 = 53%.
Cerebellar lateralization. Accuracy. The random effects meta-analysis (N = 35) showed a medium mean
effect size, d = 0.54 [95% CI = 0.42, 0.66; 95% PI = − 0.03, 1.11], z = 8.79, p < 0.0001, indicating that cerebellar TMS
significantly affects participants’ accuracy compared to control conditions. Total heterogeneity was significant,
QT = 114.93, p ≤ 0001, I2 = 72%, suggesting moderate variance across the experiments included.
The leave-one-out analysis showed that the effect size was highly robust and ranged between 0.50 and 0.55
(M = 0.54, SD = 0.01). The trim and fill method did not add hypothetical missing studies on the left side of the
funnel plot. The Egger’s test was significant, z = 2.17, p = 0.02, supporting the possibility of publication bias.
Scientific Reports | (2021) 11:14777 | https://doi.org/10.1038/s41598-021-94051-5 8
Vol:.(1234567890)www.nature.com/scientificreports/
Figure 2. Forest plot of the studies that used accuracy as main dependent variable included in the meta-
analysis. Each row corresponds to one experiment and the lines beside each square represent 95% confidence
interval. The size of each square represents the weight of the study. The diamond at the bottom represents
the cumulative effect size with 95% confidence interval. Higher positive values indicate higher behavioral
modulation in the cerebellar TMS condition.
A meta-regression did not show any moderation induced by the stimulation site (N = 35), χ2(2) = 1.37, p = 0.50.
Heterogeneity remained significant, QT = 108.17, p < 0.0001, I2 = 71%.
Response times. The random effects meta-analysis (N = 34) showed a medium mean effect size, d = 0.34 [95%
CI = 0.25, 0.44; 95% PI = − 0.04, 0.73], z = 7.12, p < 0.0001, indicating that cerebellar TMS significantly affects
participants’ accuracy compared to control conditions. Total heterogeneity was significant, QT = 76.82, p ≤ 0001,
I2 = 54%, suggesting moderate variance across the experiments included.
The leave-one-out analysis showed that the effect size was highly robust and ranged between 0.32 and 0.36
(M = 0.34, SD = 0.009). The trim and fill method added 4 hypothetical missing studies on the left side of the
funnel plot. Adding these hypothetical studies, the effect size became smaller but still significant, d = 0.30 [95%
CI = 0.21, 0.40], z = 6.26, p < 0.0001, and the heterogeneity remained significant, QT = 95.50, p < 0.0001, I2 = 56%.
The Egger’s test was significant, z = 3.23, p = 0.001, supporting the possibility of publication bias.
A meta-regression did not show any moderation induced by the stimulation site (N = 34), χ2(2) = 6.19, p = 0.04.
Heterogeneity decreased slightly but remained significant, QT = 61.86, p < 0.0001, I2 = 46%.
Scientific Reports | (2021) 11:14777 | https://doi.org/10.1038/s41598-021-94051-5 9
Vol.:(0123456789)www.nature.com/scientificreports/
Figure 3. Funnel plot of the studies that used accuracy as main dependent variable included in the meta-
analysis. Black dots represent the studies included. The vertical line represents the corrected effect size.
dpTMS HFrTMS LFrTMS spTMS iTBS cTBS tpTMS
1.43 0.42 0.98 0.32 0.19 0.71 0.48
Accuracy [0.92, 1.94] [0.05, 0.79] [0.66, 1.29] [−0.03, 0.68] [−0.47, 0.85] [0.45, − 0.97] [0.33, 0.64]
N=2 N=3 N=7 N=3 N=1 N = 11 N = 17
Table 2. Cohen’s d calculated using the stimulation paradigm as moderator. The effect for the study employing
both TBS and HFrTMS (with aggregated effects) are not showed.
Sensitivity analyses. The sensitivity analyses performed are reported in Table 5. Besides the two meta-
analyses reported above, with r = 0.75 for correlation between measures in within-participants designs, we also
performed two meta-analyses with r = 0.5. The meta-analyses performed with r = 0.5 show lower cumulative
effect sizes (d = 0.41 for accuracy; d = 0.27 for RTs), but both are still significant. The two meta-analysis per-
formed with r = 0.5 report also substantially different indexes in all the other measures assessed. In particular,
heterogeneity is reduced for r = 0.5, but funnel plot asymmetry is still problematic, with the trim and fill method
estimating a large number of studies missing (7 for accuracy; 11 for RTs). Egger’s test is also significant.
Signed effect sizes. The results of the meta-analyses on signed effect sizes are reported in Table 6. As
above, we performed on accuracy and RTs two meta-analyses with r = 0.75 and r = 0.5 for correlation between
measures in within-participants designs. In this case we used the signed effect sizes, with negative values indi-
cating performance impairment and positive values indicating performance enhancement. For accuracy, both
meta-analyses reported a negative cumulative effect size, indicating that generally the studies included reported
performance impairment. Conversely, for RTs, both meta-analyses reported non-significant cumulative effect
sizes, likely indicating that positive and negative effects countered each other. As above, with higher correla-
tion between measures, heterogeneity was higher and publication bias followed the same pattern (but was less
evident for accuracy).
Scientific Reports | (2021) 11:14777 | https://doi.org/10.1038/s41598-021-94051-5 10
Vol:.(1234567890)www.nature.com/scientificreports/
Figure 4. Forest plot of the studies that used RTs as main dependent variable included in the meta-analysis.
Each row corresponds to one experiment and the lines beside each square represent 95% confidence interval.
The size of each square represents the weight of the study. The diamond at the bottom represents the cumulative
effect size with 95% confidence interval. Higher positive values indicate higher behavioral modulation in the
cerebellar TMS condition.
Discussion
Because of the main propriety of magnetic stimulation, which allows to infer causal relationships between a
targeted brain area and a specific cognitive function, as well as the growing interest around cerebellar involve-
ment in non-motor functions, the number of studies targeting the cerebellum using TMS has largely increased
in the past few years. In particular, while several studies showed that the cerebellum is clearly involved in motor
coordination and a daptation19–24, the findings about cerebellar involvement in non-motor functions were quali-
tatively more variable. In the present meta-analysis, we thus aimed at quantifying the effects of TMS applied over
the cerebellum on non-motor functions for both accuracy and RTs. Our results showed that TMS is a reliable
technique for investigating cerebellar participation in cognitive processes. TMS administered over the cerebellum
was indeed found to successfully modulate cognitive performance (either in terms of cognitive impairment or
enhancement), affecting accuracy and RTs. The cumulative effects calculated were robust and heterogeneity was
partly accounted by the moderators added in meta-regressions for both accuracy and RTs data. Critically, the
effects of TMS were significant not only when considering a strong correlation among measurements (r = 0.75)
for within-participants designs, but also for a moderate correlational value (r = 0.5).
Scientific Reports | (2021) 11:14777 | https://doi.org/10.1038/s41598-021-94051-5 11
Vol.:(0123456789)www.nature.com/scientificreports/
Figure 5. Funnel plot of the studies that used RTs as main dependent variable included in the meta-analysis.
Black dots represent the studies included, while white dots represent hypothetical missing studies on the left side
(estimated using the trim and fill method). The vertical line represents the corrected effect size.
Online Offline
0.27 0.63
RTs [0.17, 0.36] [0.59, 0.77]
N = 22 N = 19
Table 3. Cohen’s d calculated using the stimulation timing as moderator.
dpTMS HFrTMS LFrTMS spTMS cTBS tpTMS
0.35 0.58 0.73 0.38 0.59 0.20
RTs [0.03, 0.67] [0.23, 0.92] [0.48, 0.99] [0.15, 0.62] [0.43, 0.75] [0.09, 0.31]
N=2 N=2 N=5 N=3 N = 14 N = 15
Table 4. Cohen’s d calculated using the stimulation paradigm as moderator.
In this study, we further investigated whether other potentially crucial variables, namely stimulation timing,
stimulation paradigm or the specific cognitive function investigated, could moderate the observed effects. We
found that stimulation timing moderated the observed effects on RTs only (and not on accuracy), with cumulative
effect sizes being significantly higher for offline compared with online paradigms. For both dependent variables,
the stimulation paradigm moderated the observed effects, suggesting that the various stimulation paradigms do
play a role in determining the effect of cerebellar TMS. These results indicate that certain TMS paradigms can be
more reliable than others when investigating cerebellar functions. Conversely, for both dependent variables, the
Scientific Reports | (2021) 11:14777 | https://doi.org/10.1038/s41598-021-94051-5 12
Vol:.(1234567890)www.nature.com/scientificreports/
Dependent variable Corr Effect size Q-test Higgins’I2 Trim and fill Egger’s test
0.60
r = 0.75 p < .0001 77% 0 p = .0002
[CI = .47, .73; PI = -.09, 1.30]
Accuracy
0.41
r = 0.5 p = .005 11% 7 p < .0001
[CI = 0.33, 0.49; PI = 0.22, 0.60]
0.40
r = 0.75 p < .0001 60% 11 p = .001
[CI = 0.30, 0.49; PI = −0.05, 0.85]
RTs
0.27
r = 0.5 p = .27 3% 11 p < .0001
[CI = 0.19, 0.35; PI = 0.16, 0.38]
Table 5. Results of the meta-analyses performed with the effect sizes of the within-participants studies
included computed using r = 0.75 or r = 0.5.
Dependent variable Corr Signed effect size Q-test Higgins’ I2 Trim and fill Egger’s test
−0.45
r = 0.75 p < .0001 84% 0 p = .67
[CI = −0.62, −0.27; PI = −1.29, 0.39]
Accuracy
−0.32
r = 0.5 p = .007 42% 3 p = .34
[CI = −0.45, −0.20; PI = −0.76, 0.10]
−0.13
r = 0.75 p < .0001 83% 3 p = .02
[CI = −0.30, 0.02; PI = −0.92, 0.65]
RTs
−0.09
r = 0.5 p = .0009 41% 4 p = .006
[CI = −0.21, 0.02; PI = −0.51, 0.31]
Table 6. Results of the meta-analyses performed on signed effect sizes with the effect sizes of the within-
participants studies included computed using r = 0.75 or r = 0.5.
specific cognitive function investigated did not moderate the observed effects, indicating similar effects across
the various functions at hand.
Finally, we also investigated the possible effect of lateralization (i.e., whether cerebellar TMS effects depend
on the stimulation site being left vs. medial vs. right), including this variable as a moderator in a meta-regression.
Across both accuracy and RTs, we found that TMS site did not moderate the observed effects, suggesting simi-
lar effects across the three cerebellar sites tested (left vs. medial vs. right cerebellum). Unfortunately, a deeper
relationship between TMS site and the specific cognitive function investigated could not be handled here due to
the low numerosity within each group, but would likely modulate the observed effects, since certain cognitive
functions appear to be lateralized in the cerebellum90,91. Indeed, a large number of studies focusing on social
cognition specifically targeted the left cerebellum o nly67,68, in line with neuroimaging evidence showing left
cerebellar activations during social t asks92,93. Similarly, studies focusing on semantic and linguistic processing,
as well as on verbal working memory, mainly targeted the right c erebellum49,60. The laterality of these cognitive
functions reflects the fact that cerebro-cerebellar interactions and cerebro-cerebellar connections are crossed94.
Therefore, because many studies targeted only the left or the right cerebellum as a function of the specific cogni-
tive process tested, we could not address the interaction between laterality and cognitive function directly in
our meta-analysis. Indeed, only a small number of available studies directly focused on cerebellar asymmetries
(e.g.,71,79), with this topic being particularly promising for future research in order to distinguish between left
vs. medial vs. right cerebellar involvement in cognitive processing.
Another critical point is related to the effect size differences between the two dependent variables considered
(i.e., RTs and accuracy), which may seem surprising, as from an experimental point of view both these meas-
ures quantify participants’ performance and are generally highly related (e.g., as in the case of speed-accuracy
tradeoff). Moreover, because of cerebellar involvement in event timing95,96, one may have expected higher effect
sizes for RTs than for accuracy. However, the specific stimulation paradigm adopted, the specific stimulation
timing (i.e., offline vs. online stimulation) and the specific task adopted can all play a critical role on the observed
behavior. That is, the pattern found may be affected by the interaction among these variables as well as by the
involvement of other cerebral areas in the specific function tested. This interpretation is consistent with previ-
ous evidence showing that TMS effects depend on various factors such as stimulation intensity, brain state and
timing97, and that TMS does not simply cause a generalized “virtual lesion”98.
We believe that our findings contribute to the debate on the role of the cerebellum in cognitive functions
from both methodological and theoretical points of view. Firstly, our findings provide cumulative information
quantifying the effect of the various TMS paradigms on cerebellar functions, as well as the effect of the various
TMS timing and sites on cerebellar functions. Secondly, our meta-analysis supports cerebellar involvement in
non-motor processing, indicating that the cerebellum does participate in cognitive processing and that this
involvement is not moderated by the specific function investigated. This evidence further supports theories
regarding cerebellar involvement in cognitive processing7,99. In addition to this, the cumulative effect sizes com-
puted may have a direct application, allowing researchers to use them when estimating the minimum sample
size needed to observe the hypothesized effect in future studies.
Regarding the effects of TMS on cerebellar cortex, it has been suggested that TMS directly modulates inhibi-
tory activity of Purkinje cells placed in cerebellar cortex, thus affecting the activity of the cerebral cortex via the
Scientific Reports | (2021) 11:14777 | https://doi.org/10.1038/s41598-021-94051-5 13
Vol.:(0123456789)www.nature.com/scientificreports/
t halamus100. Purkinje cells activity can modulate size, speed, and timing of m ovements101 and it has been shown
that when posterior cerebellar areas are targeted with TMS, the activity of other brain areas (e.g., deep nuclei,
prefrontal areas, thalamus, etc.36,65,102,103) is modulated. Critically, the effects of cerebellar TMS on the activity of
other brain areas as measured by motor-evoked potential (MEP) are frequency dependent. It has indeed been
shown that LFrTMS and iTBS enhance M EPs104,105, while cTBS exerts the opposite e ffect106. Investigating such
effects in future studies may be critical from a clinical point of view, particularly for the use of TMS in rehabilita-
tion protocols for neuropsychiatric d isorders107,108.
In interpreting our findings, three main limitations should be considered; namely, the potential publication
bias, the fact that we mainly focused on absolute effect sizes and the level of heterogeneity. First, evidence for pub-
lication bias was particularly strong in sensitivity analyses considering a smaller correlation for within-participant
designs. Various authors pointed to the need of interpreting null TMS results and making such findings available
to the scientific c ommunity109, possibly providing more detailed evidence for the involvement of certain brain
areas in certain functions. Second, concerning the issue of heterogeneity, our findings were strictly dependent
on the correlation used for effect sizes estimation. This pattern of results must be interpreted by considering that
almost none of the within-participants study included reported the correlation between measurements, leading to
imprecise effect size computation. Nevertheless, for both dependent variables we found that prediction intervals
were large and their lower bound negative, indicating that although cerebellar TMS is effective on average in
modulating human cognitive performance, heterogeneity is also high. Given cerebellar anatomo-physiological
characteristics, we believe that the high heterogeneity is likely related to differences in timing, intensity and
TMS procedures adopted by the studies included, some of which could not be analyzed here. In addition, using
a smaller correlation coefficient between the two measurements, heterogeneity was more contained, emphasizing
the importance of reporting the correlation in within-participant designs. Finally, in our main meta-analyses we
focused on absolute values of effect sizes, as we were interested in probing whether TMS generally modulates
cognitive performance, regardless of the specific direction of the considered effect (i.e., whether TMS induces
cognitive impairment or enhancement). In addition to this, defying a priori whether a certain TMS paradigm
would result in impairment or enhancement may be problematic and rather unrealistic. Our approach may
have therefore increased the likelihood of observing significant effects, affecting in turn the publication bias and
inducing consequently an asymmetric funnel plot. Yet, we also note that when we computed signed effect sizes,
thus accounting for the specific direction of modulation (i.e., impairment or enhancement), we still found that
TMS administered over the cerebellum was able to successfully modulate cognitive performance, showing that
cerebellar TMS typically results in cognitive impairment in terms of accuracy.
In conclusion, the present meta-analysis indicates that TMS is effective in modulating cerebellar activity.
These results therefore substantiate the well-established dysmetria of thought h ypothesis7, corroborating the
idea that the cerebellum is involved in non-motor, cognitive functions.
Received: 27 January 2021; Accepted: 28 June 2021
References
1. Adamaszek, M. et al. Consensus paper: Cerebellum and emotion. Cerebellum 16, 552–576 (2017).
2. Baumann, O. et al. Consensus paper: The role of the cerebellum in perceptual processes. Cerebellum 14(2), 197–220 (2015).
3. Koziol, L. F. et al. Consensus paper: The cerebellum’s role in movement and cognition. Cerebellum 13, 151–177 (2014).
4. Mariën, P. et al. Consensus paper: language and the cerebellum: An ongoing enigma. Cerebellum 13, 386–410 (2014).
5. D’Angelo, E. The cerebellum gets social. Science 363(6424), 229–229 (2019).
6. D’Angelo, E. & Casali, S. Seeking a unified framework for cerebellar function and dysfunction: From circuit operations to cogni-
tion. Front. Neural Circuits 6, 116 (2013).
7. Schmahmann, J. D. An emerging concept: The cerebellar contribution to higher function. Arch. Neurol. 48(11), 1178–1187
(1991).
8. Ramnani, N. The primate cortico-cerebellar system: Anatomy and function. Nat. Rev. Neurosci. 7(7), 511–522 (2006).
9. Kelly, R. M. & Strick, P. L. Cerebellar loops with motor cortex and prefrontal cortex of a nonhuman primate. J. Neurosci. 23(23),
8432–8444 (2003).
10. Krienen, F. M. & Buckner, R. L. Segregated fronto-cerebellar circuits revealed by intrinsic functional connectivity. Cereb. Cortex
19(10), 2485–2497 (2009).
11. Sokolov, A. A., Erb, M., Grodd, W. & Pavlova, M. A. Structural loop between the cerebellum and the superior temporal sulcus:
Evidence from diffusion tensor imaging. Cereb. Cortex 24(3), 626–632 (2014).
12. Schmahmann, J. D. The cerebellum and cognition. Neurosci. Lett. 688, 62–75 (2019).
13. Grimaldi, G. et al. Non-invasive cerebellar stimulation—A consensus paper. Cerebellum 13, 121–138 (2014).
14. Pleger, B. & Timmann, D. The role of the human cerebellum in linguistic prediction, word generation and verbal working
memory: Evidence from brain imaging, non-invasive cerebellar stimulation and lesion studies. Neuropsychologia 115, 204–210
(2018).
15. Tomlinson, S. P., Davis, N. J. & Bracewell, R. M. Brain stimulation studies of non-motor cerebellar function: A systematic review.
Neurosci. Biobehav. Rev. 37(5), 766–789 (2013).
16. van Dun, K., Bodranghien, F., Manto, M. & Marien, P. Targeting the cerebellum by noninvasive neurostimulation: A review.
Cerebellum 16, 695–741 (2017).
17. Oldrati, V. & Schutter, D. J. Targeting the human cerebellum with transcranial direct current stimulation to modulate behavior:
A meta-analysis. Cerebellum 17, 228–236 (2018).
18. Ugawa, Y., Uesaka, Y., Terao, Y., Hanajima, R. & Kanazawa, I. Magnetic stimulation over the cerebellum in humans. Ann. Neurol.
37, 703–713 (1995).
19. Jenkinson, N. & Miall, R. C. Disruption of saccadic adaptation with repetitive transcranial magnetic stimulation of the posterior
cerebellum in humans. Cerebellum 9, 548–555 (2010).
20. Panouilleres, M. et al. Transcranial magnetic stimulation and motor plasticity in human lateral cerebellum: Dual effect on sac-
cadic adaptation. Hum. Brain Mapp. 33, 1512–1525 (2012).
Scientific Reports | (2021) 11:14777 | https://doi.org/10.1038/s41598-021-94051-5 14
Vol:.(1234567890)You can also read