Product Brochure - Coaches | By The Numbers
←
→
Page content transcription
If your browser does not render page correctly, please read the page content below
Product Brochure
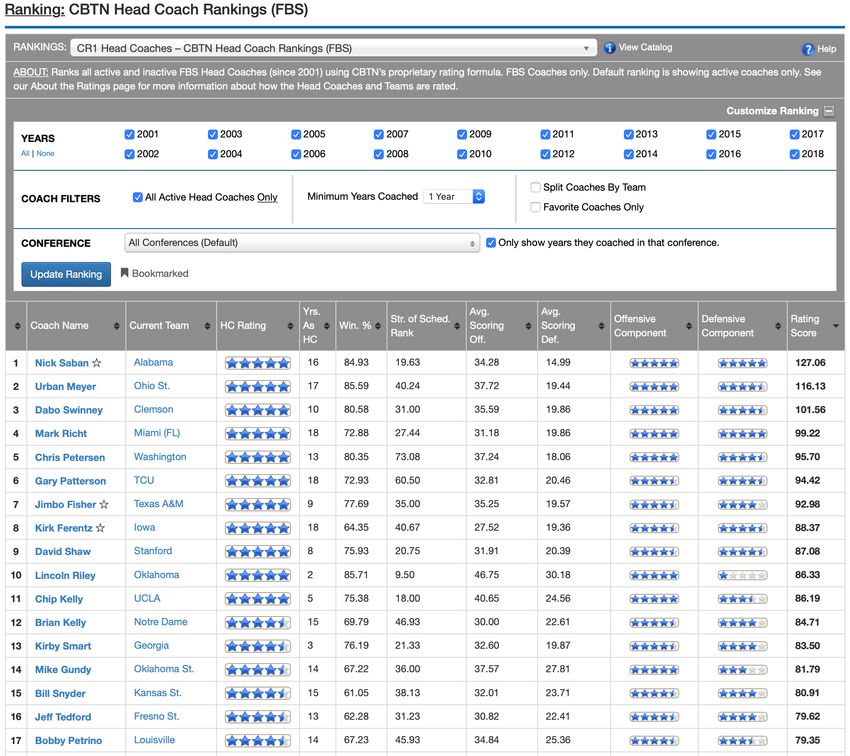
Coach Rankings
Visit the Coach Rankings area to see how all coaches
stack up against each other.

Features:

• Includes more than 130 different rankings, spanning
  more than 500 statistical categories for the three
  phases of the game: offense, defense, and special
  teams.
• Includes more than 20 off-field statistics including
  revenue, salaries, graduation rates, recruiting
  classes, and much more.
• Customizable, sortable rankings enable you to see
  the information the way you want to see it. Filter by
  active/inactive coaches, customize years, or split by
  job, by conference, and more.
• Head coach, offensive coordinator, and defensive
  coordinator rankings for every applicable statistic.

                                                          * Included in the Core Package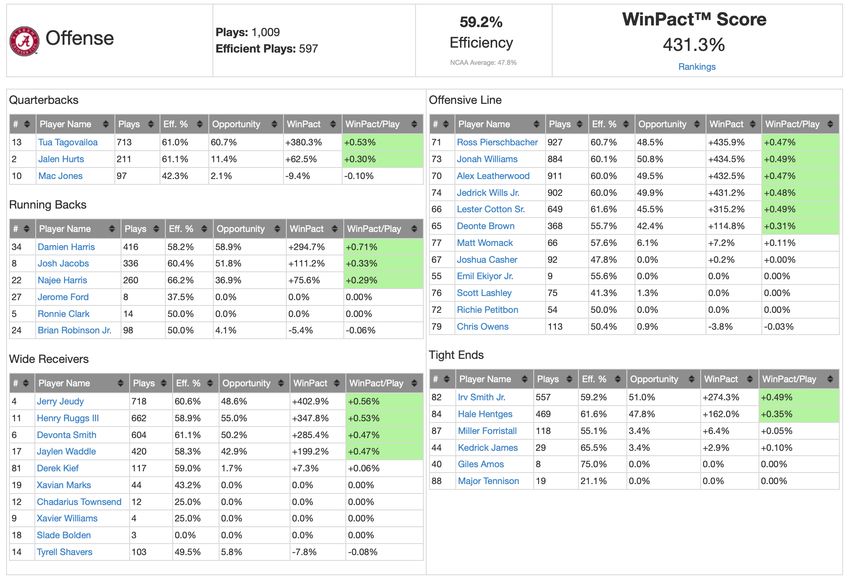
Team Rankings
Visit the Team Rankings area to see how teams stack
up against each other.

Features:

• Includes more than 100 rankings, spanning more
  than 500 statistical categories for three phases of
  the game: offense, defense, and special teams.
• Includes data for FBS and FCS teams.
• Features more than 20 off-field statistics, including
  revenue, coach salaries, graduation rates, recruiting
  classes, and much more.
• Customizable, sortable rankings enable you to see
  the information the way you want to see it. Filter by
  custom years, conferences, and more.

                                                          * Included in the Core Package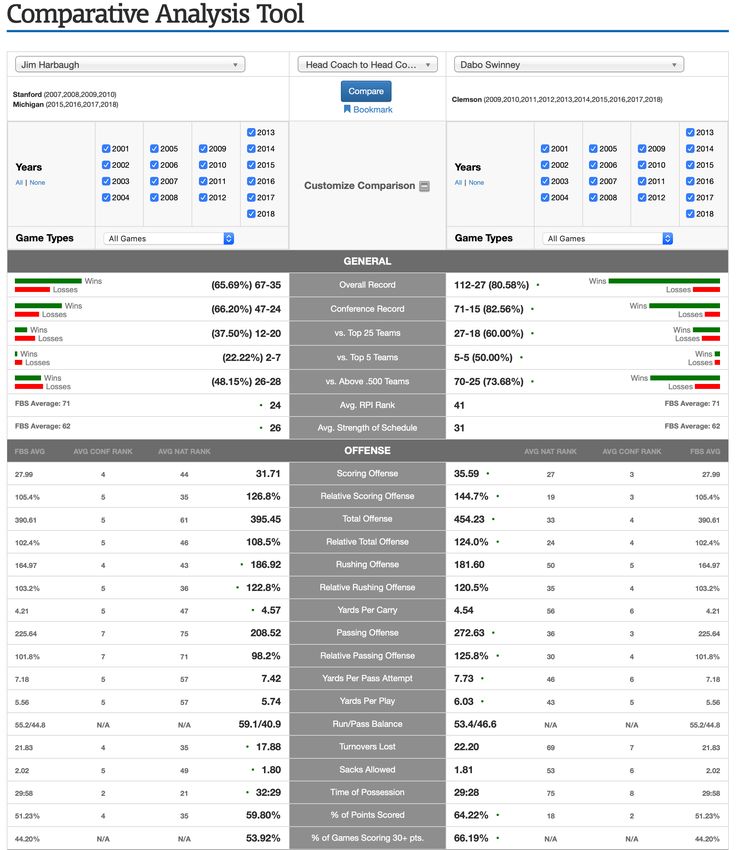
Situational Tool
The Situational Tool delivers detailed down-and-
distance and field zone analytics in the way that
coaches want. Complex game filters allow coaches to
self scout their teams and opponents quickly and
easily. Want to know what player Alabama targets the
most in the red zone on 3rd & Medium? Or, what
percent of the time to they target the tight end? This
tool breaks all of this down and more.

Features:

• Offensive and defensive situation breakdowns for
  every FBS team.
• Field zone breakdowns to determine the offensive
  and defensive success based on field position.
• Twenty different down-and-distance situations
  (including E and P downs) detailing the success of
  plays, run/pass bias, big-play frequency, yardage
  averages, and negative plays.
• Down-and-distance player performance broken
  down by both individual player and position to know
  who gets the ball on critical downs.
• Customizable and filterable by game type, yardage
  types, field zone, quarter/half, and conference/non-
  conference games.

                                                         * Included in the Core Package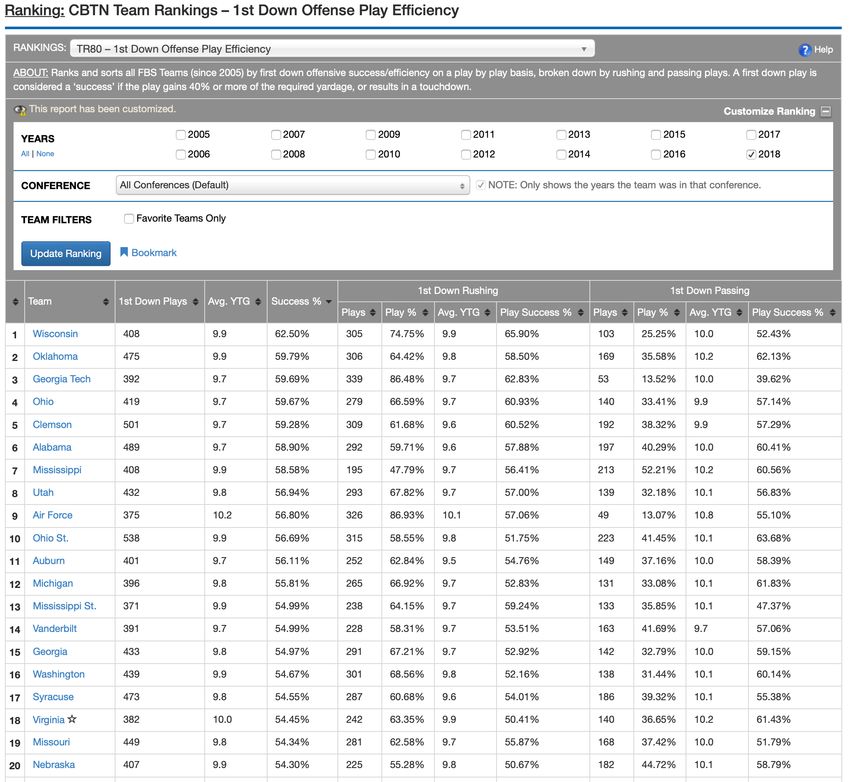
Drive Tool
The Drive Tool delivers detailed drive statistics
aggregated in a way that is most useful for coaches.
Complex game filters within the tool allow coaches to
self-scout their teams and opponents quickly and
easily. With only a few clicks, you can quickly see the
effects that tackles for loss, long rushes, long passes,
and sacks have on drives. The Drive Tool details
scoring, punt, and turnover percentages based on
critical drive occurrences. It also breaks down the
offensive and defensive drives by field zone to
demonstrate on what parts of the field a team is
successful. The combinations of game filters, field zone
filters, and occurrence filters make the tool’s statistical
combinations limitless.

Features:

• Offensive and defensive drive-success breakdowns
  for every FBS Team.
• Color-coded compare-and-contrast feature to easily
  spot patterns in drive performance against national
  benchmarks and averages.
• Field zone breakdowns to determine the offensive
  scoring potency based on field position.
• More than 45 drive occurrences detailing the success
  of drives with big plays, penalties, sacks, at the start
  of the game or half, inside of 1/2/4 minutes left in the
  game/half, and other occurrences that are important
  to the success of drives.
• Customizable drive data by offense/defense, game
  set, game portion (half, quarter, close game, blowout,
  etc), location, and field zone.
                                                              * Included in the Core Package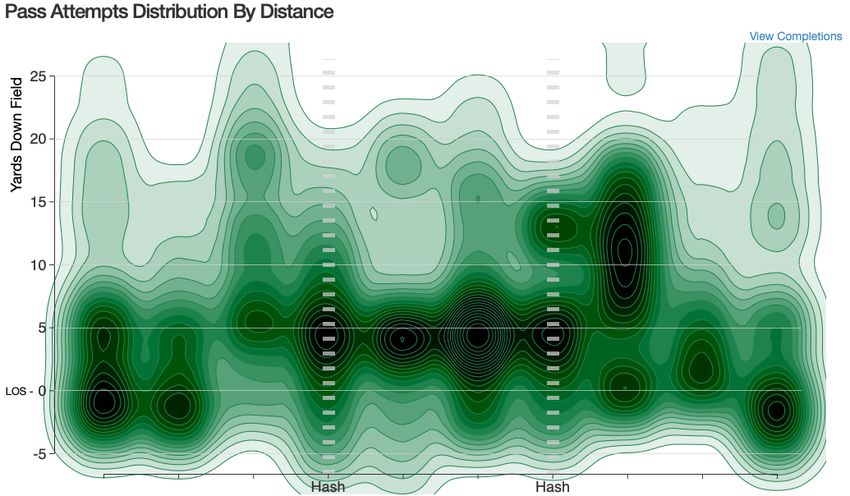
Predictive Analytics
Designed for coaches by coaches, the CBTN platform
has various tools that allow you understand play-
calling tendencies and styles for every FBS team.
Features:
• Offensive Styles are outlined to show how each
offense distributes the football among the skill
positions (true balance).
• Basic Tendencies show how an offense flows and
attacks with momentum after big plays, first downs,
negative plays, and efficient plays.
• Coming Out Tendencies show how teams like to
structure their attack at the start of a possession.
Understanding these play patterns illuminates what
makes an offense successful.
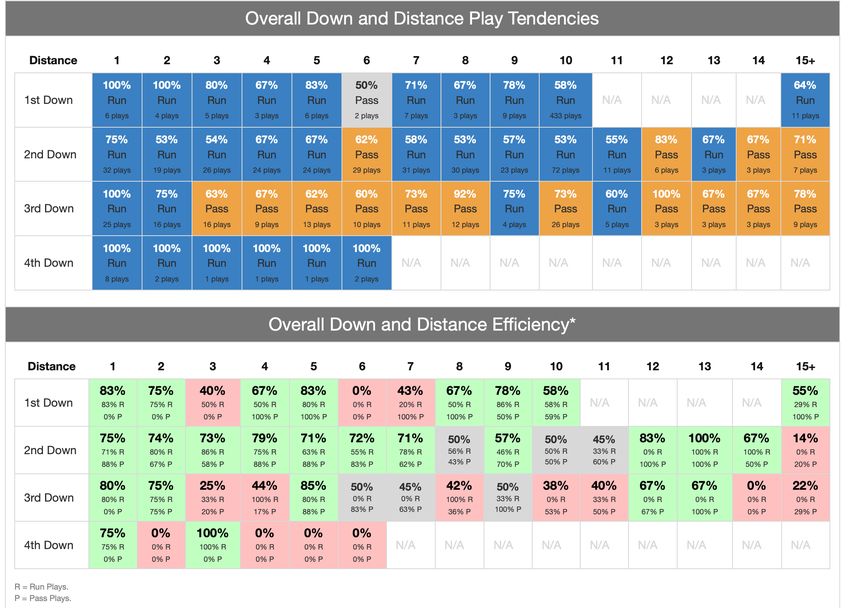
• Down and Distance Play Tendencies and Efficiency
show where an offense is strong and what its
tendencies are to run/pass the football across all
down-and-distance scenarios. This is critical for
understanding what makes an offense successful in
various situations.
• Customize all of these tendencies by game set,
game portion (half, quarter, leading, trailing, etc),
location, and field zone.
* Included in the Core Package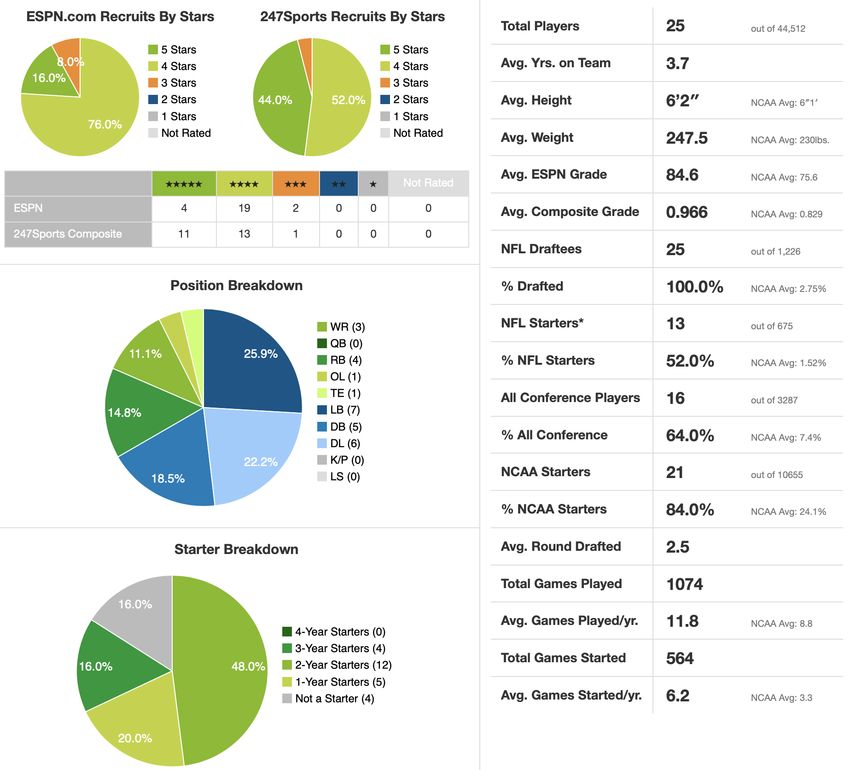
TeamStrat™ Reports
When it comes to detailed strategy, coaches often
need very fine-grained reports that guide decision-
making and game-planning. CBTN has created a
library of reports, designed by coaches and for
coaches to provide information to give any coach or
team a strategic edge.

Features:

• Customizable and filterable by game type,
  competitive situations, field zone, quarter/half,
  conference/non-conference games and more.
• 30+ Strategy Reports covering:
  • Player Tendencies for passing, rushing, blitzing,
    pass protection, tackling, etc.
  • Personnel and Formation Tendencies
  • 3rd Down Breakdowns on targets/touches, run/
    pass balance, blitz tendencies, and more.
  • Defensive Tendencies
  • Field/Boundary and Directional Tendencies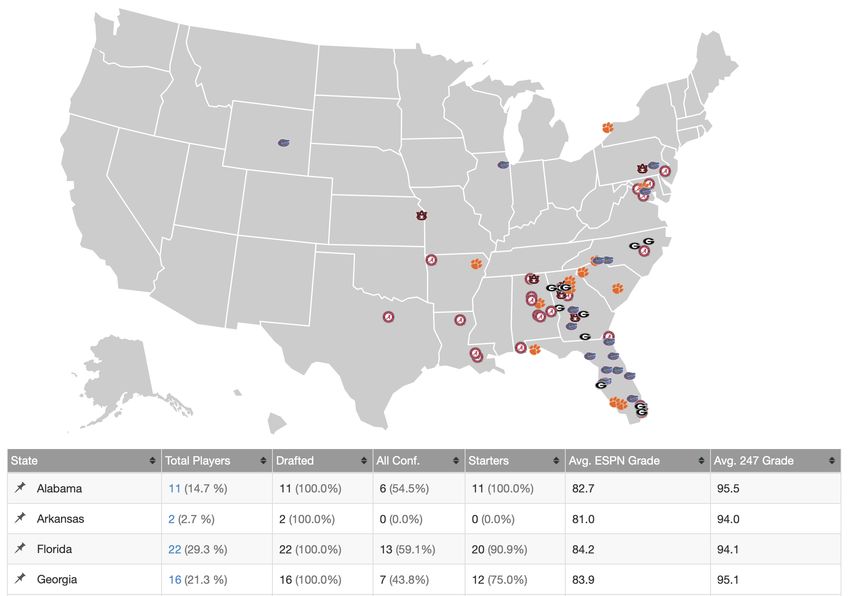
Player Alignment Tool
Analyzing and understanding how a team lines up is a
critical opponent scouting task. Coaches typically had
to crunch through hours of film to understand all of
the intricacies of sub-packages alignments and how
teams utilize their personnel. With the Player
Alignment Tool, we eliminate all of that work and allow
coaches to spend more time on technique and
tactics.

Features:

• Breakdowns of every offensive and defensive
  position group, customized for specifically for their
  tendencies.
• Filterable by offensive formation, offensive
  personnel, defensive personnel, and specific play
  types. This allows for a coach to easily compare
  and contrast sub-packages and understand game
  situation tendencies that are extremely difficult to
  quantify by watching video.
• Color-coding that makes it quick and easy to
  understand the player tendencies.
• Left/Right, Weak/Strong, Boundary/Field, and Slot/
  Outside breakdowns for qualifying position groups
  allow a coach to see how the opposing offense or
  defense is designed from a personnel perspective.
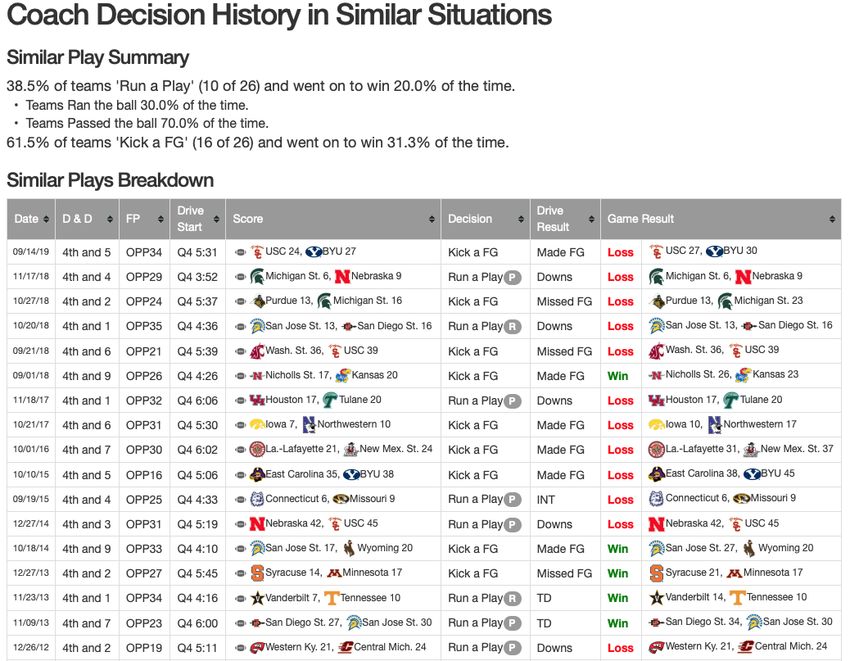
WinDecision™ Tool
When it comes to in-game strategy and decision-making,
coaches often rely on conventional wisdom and past
experiences. Very little actual information and data are
being used to drive their decisions. This exposes the
team and coach to the possibility of making both a
controversial and risky decision. To solve this problem,
we created the WinDecision™ Tool to empower coaches
to make the most informed decision possible to help put
their team in the best position to win the game.

Should you “kick the field goal” or “go for it” on 4th and 5
on the opponents 25 yard line, down by 3, with 5:00
minutes left on the road?

Coaches simply have never had the data to help answer
this question. With the WinDecision™ Tool, now they do.

Features:

• Configurable user interface to enter any possible game
  situation that may arise.
• Each situation shows detailed breakdown of the
  possible decisions, the likelihood of various outcomes,
  and the consequential change in win probability.
• For every coach decision, we show a detailed history of
  similar situations, what that coach chose in that
  situation, and the eventual outcome of the game.
QB Profiler™
Quarterback is the most important position in football.
The QB Profiler™ was created to go exhaustively deep
into every aspect of performance for the QB position.
Whether you are evaluating your quarterback, your
opponent’s quarterback, or evaluating quarterbacks for
the NFL, no tool goes deeper than that CBTN QB Profiler.

Features:

• Custom QB Strength Profile™ that analyzes the
  quarterback across 13 different passing dimensions,
  each with over 100+ different situational metrics.
• Detailed Pass and Completion tendency charts
  showing where the QB likes to pass the ball, and most
  importantly, where they are efficient passing the ball.
• Comprehensive Quarterback Release Time charts that
  show how quickly the QB gets rid of the football and
  how efficient those passes are within each 0.25 second
  time window.
• Custom ‘Passing to the Sticks’ charts that show how
  aggressive and efficient quarterbacks are at throwing
  passes short of and past the sticks in every down and
  distance category.
• Incompletion Breakdown analysis charts that
  categorize and quantify all of the reasons the
  quarterback throws an incomplete pass.
• Detailed ‘Complete Percentage Over Expectation’ (or
  CPOE) charts that truly show how accurate a
  quarterback is throwing the football taking into account
  the distance and difficulty level.
SalaryCast™ Tool
Projecting the market value of a coach is very difficult. You have
to take into account a wide variety of success factors both on
and off the field as well as adjust for a competitive, high-growth
market. To solve this problem, we created SalaryCast™, a
complex machine learning algorithm that takes into account all
of the market trends and performance factors and projects a
salary for coaches based on their performance profile and
history. No athletic director, coach, or agent should ever start
negotiating a contract without first understanding the true
market value of a coach. SalaryCast™ makes this extremely
easy.

Features:

• Salary projections for Head Coaches, Offensive Coordinators,
  and Defensive Coordinators.
• Multiple Projection models to support coaches of different
  career backgrounds.
• Project salaries for coaches at all 130 FBS schools taking into
  account regional market trends.
• Coach “fit” analyzed and assessed based on a school’s coach
  compensation history.
• Detailed market trends and multi-year contract projections.
• Comprehensive Strength Profile evaluation of every coach.
• Algorithmic selection of comparable coaches that have similar
  performance profiles, experience, and have salary projections
  that are similar for the projected job.

            * Included in the SalaryCast™ Package
Recruiting Analytics
CBTN captures biographic, biometric, recruiting,
and statistical information about every player for
the duration of their career, from high school to the
NFL (where applicable). With all of this data, we
provide incredibly detailed analyses of players,
which helps teams identify where they should be
recruiting or drafting based on the trends. Our
comprehensive Recruiting Analytics Tool allows the
user to perform their own research, customizable to
the smallest detail, to empower their own recruiting
strategies and success.
Features:
• Detailed Player Lists show all the player’s core
performance metrics, from their recruiting rating
in high school to their performance in college,
and all the way to the NFL.
• Player Summary Reports show high-level trends
across player groups and how they compare to
NCAA averages.
• Summary Reports that group and break down
players by Team, Recruiting Coach, Conference,
State, and Region.
• Interactive Player Map shows exactly where the
players played in high school, which yields a
critical understanding of geographical and
regional trends for different position and athlete
types.
* Included in the Core PackageComparative Analysis Tool
Context is a critical aspect of evaluating or analyzing
any team or coach. The Comparative Analysis Tool
(CAT) allows you to compare any combination of
coach, coordinator, or team to evaluate, comparatively,
which is truly better across over 75 critical statistics.
The CAT is designed to assess all aspects of the
game, contrasting only those statistics that most
highly correlate with winning.
Features:
• More than 75 comparative statistics for offense,
defense, and special teams.
• Comparative capabilities for every head coach,
offensive coordinator, defensive coordinator, and
team since 2001.
• Completely customizable to allow very fine grained
control over aggregate comparisons.
• Game filters that allow for isolating data for all
games, FBS-only games, conference-only games, or
non-conference-only games.
• In addition to the core statistics, we also provide the
national/FBS ranks, conference ranks, and the FBS
average to provide added context for each statistic.
• Red and green indicators show which coach or team
is better in an individual statistic.
* Included in the Core PackageWinning Formula Tool
In every game, when certain coaches or teams reach
specific statistical milestones (for example, 300+ yards
passing, 30+ points scored, 150+ yards rushing), their
odds of winning can change drastically. The Winning
Formula Tool allows the user to evaluate any coach or
team in any combination of more than 400 different
statistical categories to determine which situations
truly make up the ‘Winning Formula’.
Features:
• More than 400 statistical formula items that can be
viewed individually or combined together to
determine very specific game situations that are key
indicators of a team’s success.
• Easily compare and contrast all head coaches,
active coaches, and teams since 2005.
• Completely customize the years to allow very fine
grained control over the formulas.
• Game filters that allow for viewing all games,
conference-only games, non-conference-only
games, or games in a specific month.
• Formulas created to evaluate a single coach or team
will show the specific games in which that formula
occurred, whether the team won or lost those
games, and provide links to the Advanced Box
Score for a deeper dive into the specific games.
* Included in the Core PackageWinPact™ Features
WinPact™ is a measurement of the true Win probability
imPact of a play, player, offense, or defense, and is the
best indicator of a team’s success. Being able to
measure WinPact™ is critical for any coach in
assessing team performance. CBTN’s set of tools
outlines the WinPact™ of individual teams, games, and
players. The calculations are done at the play level,
which allows a coach to see every play and every player
in order to and determine how much those plays truly
impacted the game. This set of features answers the
main questions we get from coaches: Which plays
matter?, Which players matter?, and Why did we win or
lose the game?.
Features:
• Game-level WinPact™ analysis tool that details every
offensive and defensive play in a game. Easily find the
most critical plays and see who was the on the field
when they happened, which players factored into the
plays, and who/what ultimately impacted the game’s
outcome.
• Team-level WinPact™ provides a view of an entire
roster of players, broken down by position group, and
allows a coach to see which players are their highest-
impact players, their most efficient players, and the
players who are on the field in critical moments.
• Team level WinPact™ is ranked against all other FBS
teams and includes filters to break down the data by
personnel and formation, among others.
* Included in the WinPact™ Add-on PackageAdvanced Scouting Tool
At the core of the CBTN platform is a really great data set
that captures hundreds of pieces of information on every
single play run by every single team in every single FBS
game. We built the Advanced Scouting Tool (AST) so that
coaches could have direct access to this data and create
a report library that formats the data exactly how they
would like to see it. Additionally, it provides an exploratory
interface to allow coaches to find limitless trends and
patterns in the data (both self and opponent scouting) that
would take analysts weeks to determine manually.
Features:
• User-configurable sorting and grouping. Supports up to
five different grouping levels.
• Configurable report output:
• Turn on/off different columns on the reports.
• Select from a library of pre-defined graphs and
visualizations.
• More than 200 fields available to filter, sort, and group.
• Have your own team terminology? We can customize
the AST to show your data and terminology (typically
exported from XOS or DVSport video systems) to
leverage the hard work already being done to capture
team-specific data.
* Included in the AST Add-on PackageAST Report Dashboard
After building reports with the Advanced Scouting Tool
(AST), users can store and organize them with the AST
Report Dashboard. Organize and arrange the reports into
configurable tabs and dashboards in a way that makes
sense to your team. These dashboards are the perfect
way to organize self-scout and opponent scouting
reports.
Features:
• Completely customizable dashboard and tab names.
• One-click easy printing of a tab or an entire dashboard.
• Master Game Filter that allows you to change the
game set for your reports globally. No need to update
the reports to reflect different opponents or new
schedules.
• Easily add new reports by just going back to the AST.
No need to contact the vendor and wait around for a
response. The AST and AST Report Dashboard are
completely self-service.
• Easy-to-use “Duplicate” feature that allows you to
leverage the format and filters of an existing report to
quickly create a similar report.
• With the Content Manager, you can easily share
reports and dashboards with other CBTN users.
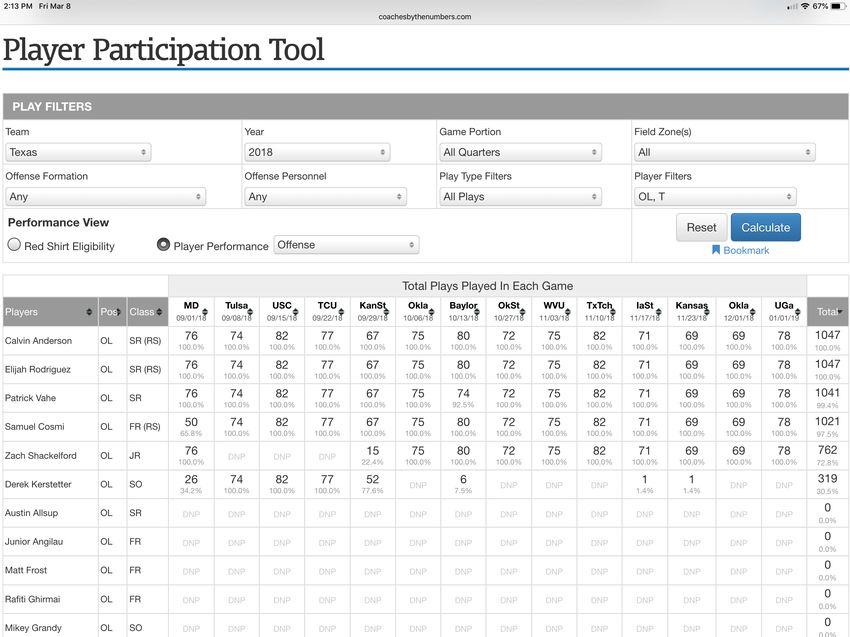
* Included in the AST Add-on PackagePlayer Participation Tool
The CBTN platform tracks every player on every single
play. Because of this capability, we can show coaches
limitless views on how their players are being utilized
and performing at a game and season level. The Player
Participation Tool, in its simplest form, tabulates every
single play for every player who is on the field for a
specified team. When used in combination with the
filters, you can quickly and easily see how players are
being utilized in every phase of the game, different
personnel/formation groupings, for different parts of the
field, and in different play types (run, pass, sacks,
touchdowns, etc). These views are critical for both self-
scouting and opponent scouting throughout the season.
Features:
• Players are filterable and sortable based on position
and class for unit-by-unit depth chart analysis.
• Game phase filters for viewing offense, defense, and
all 8 sub-phases of special teams.
• Play filters for formation and personnel, field zone,
game portion, and play type make finding sub-
package and situational substitution tendencies
extremely simple and easy.
• Custom Red Shirt Eligibility view allows teams to
closely monitor player compliance with new Red Shirt
rules.
* Included in the Core PackageInteractive Scouting Report
While the Team Rankings feature provides hundreds of
statistics with which you can contrast and compare
teams, there is still a need for an in-depth, visual, and
configurable way to understand the performance and
tendencies of a team. The Interactive Scouting Report
was designed to provide several of those key views that
can help a user understand a team’s analytical DNA.
Features:
• Configurable dashboard-style interface allows a user
to select from any of the 10+ visualizations to tailor a
scouting report specifically to their needs.
• Custom game sets allow users to hand pick the
games that they want to analyze for a team quickly
and easily.
• Filterable by half and quarter for very fine-grained
analysis.
• Scouting Report Visualization Library includes:
• Trend Charts
• Core Rates and Differentials Benchmarks
• Team and Opponent Game Breakdowns
• Offensive and Defensive Rushing/Passing
Efficiency Breakdowns (by Down and Distance)
• Starting Field Position Factors
• Offensive and Defensive Play-by-Play Visualizations
• Offensive and Defensive Possession Breakdowns
by Field Zone
* Included in the Core PackageCoach Hiring Analytics Tool
Hiring a coach is not easy. At SportSource, we have
performed more than 40 coaches searches in the past
five years. Our data and analytics on coaches are
critical tools that help an AD make a data-driven
decision. A large part of industry and market knowledge
comes from our Coach Hiring Analytics Tool (CHAT). We
co-designed the CHAT with the best sports coaching
agents in football to get right to the heart of the trends
and truths that truly matter when hiring a football coach.
The tool will not magically pick the best coach for you,
but it will drastically help you understand everything you
should be looking for in a coach and which coaches
meet that criteria.
Features:
• More than 18 years of head coach hiring résumé data
covering all 130 FBS schools.
• Every fire, hire, and resignation analyzed for trends
and historical grading.
• Filterable by more than 30 biographical fields from the
résumés of more than 500 coaching hires since 2001.
• View individual head coaches, age breakdowns,
before/after coach performance, Power 5/Non-Power
5 breakdowns, NFL/NCAA experience breakdowns,
coach exit breakdowns, and much more.
* Included in the Hiring Analytics PackageReferee Tool
Understanding the tendencies of the referees in a game
can be as critical as understanding the tendencies of an
opponent. Evaluating how a team commits penalties is
important for coaches to effectively teach corrective
behavior. The Referee Tool allows you to take an in-
depth look at all aspects of penalties in order to
understand what is being called and how to make
strategic changes that can help give your team an
advantage with the referees.
Features:
• Perform comparative analysis of penalties at a team,
coach, and head referee level.
• Penalties are measured at a “Per 100 Plays” rate to
normalize for different tempo rates.
• Team/Coach/Referee breakdowns showing how often
each penalty type is being called compared to the
national average.
• Detailed filters for comparing and contrasting teams
nationally, across specific conferences, specific
portions of the game, referee conference affiliations,
or game location.
* Included in the Core PackageTeam Goal Dashboard
Part of every coach’s challenge is designing and
communicating goals to their teams. We created the
Team Goal Dashboard to be an analytics-based goal
“report card” that measures yearly and weekly progress
towards a team’s goals.
Features:
• More than 500 yearly and weekly goals that measure
general team success (wins, etc), offensive goals,
defensive goals, and special teams goals. All goals
are color-coded based on team-provided benchmarks
in which they are trying to achieve.
• Goals can target raw statistics, national rankings, and
conference rankings.
• Completely customizable. If your goal isn’t in the
library, we can easily add it.
• Weekly and yearly goals are tracked throughout the
season to provide teams real-time progress reports
on their team goals.
• Is the goal realistic? Yearly goals show color-coded
historical performance to see if a goal is realistically
achievable based on three previous seasons.
• How close to the goal are you? All goals show the
exact team performance towards a specific goal.
* Included in the Core PackageCoach, Team, and Player Profiles
While CBTN has many powerful analytical tools, there are other
very important core functions that we provide, including an
unprecedented level of detail for every coach, team, and player
that is being analyzed. Our profiles are specifically geared
towards allowing our users to have an added depth of
knowledge for each coach, team and player in the platform.
* Included in the Core PackageOther Tools and Features * All Included in the Core Package
Two Point Conversion Decision Tool Correlation Tool
When you should you “go for two”? CBTN provides an easy-to-read chart that makes Which statistics affect winning? Which statistics affect other statistics? The Correlation Tool
the decision straightforward. A must-have reference for any head coach. allows you to easily see which statistics are highly correlated and which truly affect winning.
Margin Charts Content Manager
How do the critical battles within games truly affect winning and losing? CBTN’s Margin Every tool, report, and filter set on the CBTN platform can be saved or “bookmarked” for
Charts provide contextual insight into the importance of winning certain battles. quick access. This allows the user to easily assemble libraries of content that meet their
focus areas.2020 CBTN Subscription Packages
for FBS Teams
Packages
Core Package
Coach Rankings, Team Rankings, Situational Tool, Drive Tool, Film Room™,
Predictive Analytics, Recruiting Analytics, Comparative Analysis Tool, Winning Formula Multi-year pricing
Tool, Player Participation Tool, Interactive Scouting Report, Team/Coach/Player $13,500* available
Profiles, Margin Charts, Referee Tool, Correlation Tool, Two Point Conversion Decision
Tool, Team Goal Dashboard, QB Profiler™.
Advanced Scouting Tool
TeamStrat™ Reports, 2 Custom Data Sets, Standard CBTN Data Set, AST Report $3,500*
Dashboard.
WinPact™ Features $3,500*
Team WinPact™ Tool, Game WinPact™ Reports
SalaryCast™ Package $5,000*
Coaching Hiring Analytics Tool + SalaryCast™ Tool
Analytics-As-A-Service (AaaS) $17,500*
10 hours/week of customer analytic work and research. Maximum of 200 hours per
year. Additional hours available upon request.
- All packages include technical support and training. - * 12-month subscription fee
ADs, SIDs, Conferences, Media, and Agents, please email team@sportsourceanalytics.com for pricing.You can also read