A Global Analysis of Mobile Gaming Benchmarks - Industry Report Performance insights from more than 60K mobile games and over 3 billion players ...
←
→
Page content transcription
If your browser does not render page correctly, please read the page content below
Industry Report

A Global Analysis of
Mobile Gaming Benchmarks
Performance insights from more than 60K mobile games
and over 3 billion players from around the world.

 1                                                     2018 Edition
What’s inside...
    About this report								Page 3
    Key takeaways								Page 4

    Engagement
    D1 Retention     							Page 5 - 6
    D7 Retention     							Page 7 - 8
    D28 Retention								Page 9 - 10
    Average Session Length 							Page 11 - 12
    Stickiness									Page 13 - 14

    Revenue
    ARPPU     								Page 15 - 16
    ARPDAU 		  							Page 17 - 18
    Conversion									Page 19 - 20

    Our Customers
    Hear it from the best 							Page 21 - 22
    Voodoo Case Study							Page 23 - 26

    Other key stats								Page 27 - 28
    Key analytic features							Page 29 - 30

2
How we define our benchmarks
    GameAnalytics is a free tool that helps game developers and publishers around
    the world to better understand their players, refine gameplay and compare the
    performance of their titles to the general trends in the market (benchmarks).

    With more than 60K+ titles and 3 billion players analyzed, this report provides an
    insightful snapshot into the state of the mobile gaming industry. Throughout this
    report, we present our benchmarks to show insights into how the industry is
    performing for each genre and metric.

    How is this data presented?
    To avoid any bias from pre-launch titles skewing
    our analysis, we set a minimum threshold of 1,000
    daily active users for each game.
                                                                  How to read our graphs
    For titles that meet this minimum criteria, we’ve
                                                                        Any game with a metric
    collected our findings and presented the data for                   near the green line or star is
    each metric in two separate ways:                                   performing in the top 15% of
                                                                        games. Good job!

    1. Overall Yearly View
                                                                        Games with a metric near
                                                                        this yellow line or symbol are
    This is all of the genre data aggregated to                         performing OK, but there’s still
    show industry trends over the last year. It has                     some room for improvement.

    been broken down into top, median and under-
    performing titles (green, yellow and red lines).                    Games with KPIs near this red
                                                                        line or arrow are amongst the
                                                                        lowest performers compared to
    2. Genre Specific Breakdown                                         industry averages.

    This graph looks specifically at how each
    genre is performing and highlights the top,
    median and underperforming KPIs for each
    genre category (star, grey line and red arrow).

       60K+ games                     From 3 billion                 Over a full
       studied                        devices                        calendar year

       We crunched data from          Our analysis presents          Data for a full calendar
       a selection of our 60K+        findings from 850 million      year, running from July 1st
       games which are currently      monthly active players.        2017 to June 30th 2018.
       active on the app stores.

3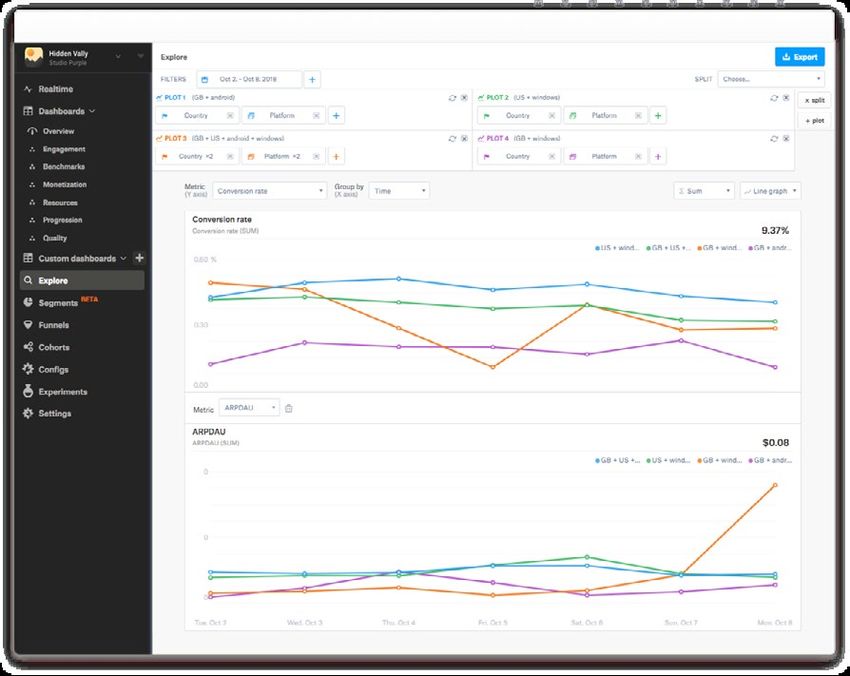
Key Takeaways
       After 1 day, top performing games show
       retention between 35-50%- Page 6

       At day 7, the most promising games show
       retention between 15-25% - Page 8

       By day 28, retention drops dramatically, with
       the best performing between 4-6% - Page 10

       People play longer in winter (by around 3 minutes),
       especially around Christmas - Page 11

       As people’s lives start to get busy around the New
       Year, stickiness tends to see a drop - Page 13

       When it comes to ARPPU, top performing games
       generate 3-4x more revenue than other titles
       - Page 15

       The role playing genre dominates with ARPDAU,
       whereas arcade and racing games average much less
       - Page 18

       Top performing games convert players up to 3x more
       than the average - Page 19

44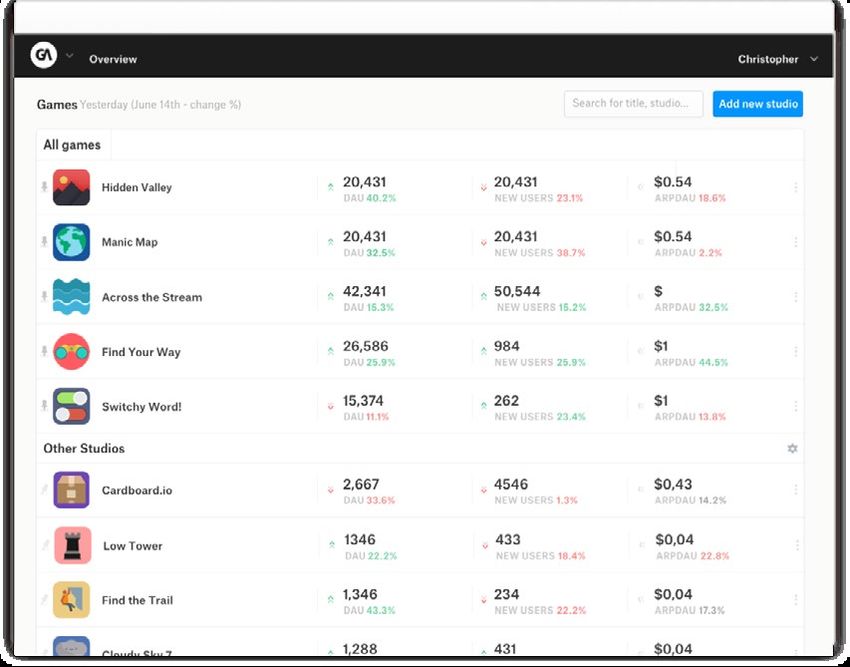
Retention (Day 1)

                                                              If your day 1
  How much potential                                          retention is low...
  do games have?                                              If a game has low day 1
                                                              retention, then it’s probably
  Day 1 retention looks at how many players return            going to need a massive
  after 1 day of playing a game. This is a vital KPI to       overhaul.
  get a quick impression of a game’s potential.               Many studios drop under-
                                                              performing titles (sometimes
                                                              killing games with anything
  Key takeaways:                                              less than 35%). Although this
                                                              can be a hard decision to
                                                              make, it’s sometimes better to
        If a game has more than 40% day 1 retention,          cut losses and move on to the
        then it is doing really well.                         next project.

        Anything below 30% retention isn’t considered
        good and may not be financially viable in the long                    Thanks!
        term.

        Kids games have extremely low retention -
        15% is above average for this genre.

   Games with 35% or
greater day 1 retention are
performing well compared
      to the average.         Yearly Overview for Day 1 Retention

                                                                                      Any game with KPIs
                                                                                      near the green line
                                                                                      means it’s in the top
                                                                                      performing 15% of
                                                                                      games and doing
                                                                                      well.

                                                                                      Games that are
                                                                                      around the yellow
                                                                                      line are average
                                                                                      when compared
                                                                                      to the industry.

                                                                                      Any games that are
                                                                                      near the red line are
                                                                                      underperforming
                                                                                      against the industry.

                                                                                                              5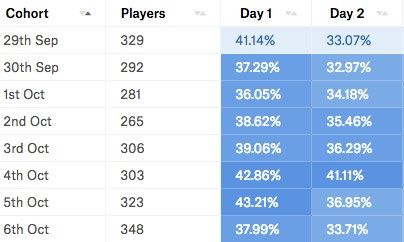
Breakdown of Genre for Day 1 Retention

    Top performing games                      Genre median                Underperforming games

                                                                                 40% day 1 retention is
                                                                               above average, but 35% and
                                                                                upwards is still promising.

    *All genres are listed in alphabetical order and based on the App Store categories.
6
Retention (Day 7)

                                                               Perfect your in-game
Are players still coming back                                  core loop
after a week?                                                  Players can lose interest in
                                                               repetitive things easily, which
Similar to day 1 retention, day 7 looks specifically at        is a valid reason why day 7
players who come back to a game after a week of                retention can suffer.
playing. Naturally, this will be lower than day 1 retention.   When repeating core loops
                                                               in games, it’s important to
                                                               make sure players can unlock
Key takeaways:                                                 new content, be that items,
                                                               areas or levels. Don’t let them
                                                               get bored!
     Retention to day 7 shows seasonality for the
     top 15% games.

     Retention tends to decrease around Christmas                           Good to know
     and in Summer holidays.

     A typical Word game has 16% day 7 retention,
     compared to just 1% for Kids games.

 As expected, there’s a
 decrease in retention
   around Christmas
 and Summer holidays.
                                  Yearly Overview for
                                    Day 7 Retention

                                                                                                 7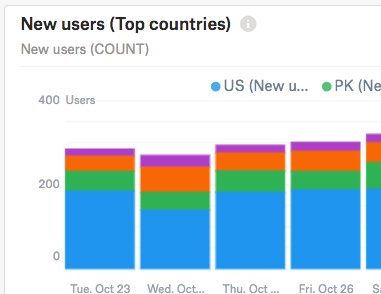
Breakdown of Genre for Day 7 Retention

    Top performing games     Genre median                Underperforming games

                             Games with day 7 retention
                               of between 15-30% are
                             performing particularly well.

8
Retention (Day 28)
If players are still playing
after 28 days, they really
Players that come back after 28 love that game. But then
days are truly engaged. what?
With so much competition out there, retaining
players for a full month can be difficult. Naturally, Consider the endgame
we see a dramatic drop-off when it comes to day The endgame is important
28 retention. to keep players engaged.
Although tricky to design,
great endgames allow users
to continue enjoying core
Key takeaways: gameplay.
PVP modes, daily challenges
The highest values are low. The best performing
and leaderboards are all great
games show 6% retention D28. options to keep users excited.
The bottom 15% have a D28 retention of 0%, showing
how difficult it is to retain players for a full month.
The highest retention is in the cold and boring
quarter, just before Christmas.
Highest day 28 retention
is in the cold and boring
quarter, before Christmas.
Yearly Overview for
Day 28 Retention
9Breakdown of Genre for Day 28 Retention
Top performing games Genre median Underperforming games
Games with more than
6% day 28 retention are
performing particularly well.
10Average session length
Reward loyal players
How long do people play
for on average? Users ultimately control
how long they play for, so it’s
important to not limit their
The average session length looks at how long gameplay. If they complete
users play a game, from initially opening the app to 10 levels within a game and
end up playing for 20
when the session is closed and sent to the background.
minutes, these players should
be rewarded to make sure
they have a good experience.
Key takeaways:
This should apply to any
stage of gameplay,
People play longer in winter (by around whether they are returning
3 minutes), especially around Christmas. after 1 day, 7 or 28.
ASL is slightly decreasing for underperforming
titles, indicating that the top 15% actively engage Makes sense!
players with marketing campaigns.
Casino and Card are the genres with longest
ASL (these genres have a great deal of overlap).
People play longer in winter
(by around 3 minutes),
especially around Christmas.
Yearly Overview for
Average Session Length
11Breakdown of Genre for Average Session Length
Top performing games Genre median Underperforming games
Players spend considerably more
time in Casino and Card games
- up to 35 minutes per session!
12Stickiness
How can I increase
engagement and keep
How engaged are players in a game? my players loyal?
To break this down, stickiness is the
DAU-to-MAU ratio, which essentially means How to keep them loyal
how many monthly users play each day.
Promotions, giveaways and
freebies are always a nice
Key takeaways: way to reward regulars.
Ultimately however, it all
Most games decrease slightly around comes down to content.
Christmas and New Year, with a small rise
If players are denied new
after New Year’s Eve. challenges or fresh gameplay,
then they will lose interest and
The peak is around October, with another peak move on to the next game.
before Chinese New Year.
The 5 top performing genres for this metric are
Board, Card, Casino, Puzzle and Word, with more
than 25% Stickiness.
As people’s lives start to get
busy towards the holidays,
stickiness tends to drop just Yearly Overview
before Christmas and the
New Year. for Stickiness
13Breakdown of Genre for Stickiness
Top performing games Genre median Underperforming games
For most genres, having
less than 7% stickiness
is considered bad.
14ARPPU
How to increase
How much do users spend? player spend
In this section, we look at the average revenue per There are loads of ways to
paying user across games on our platform. encourage players to spend
more in a game, including
To keep the data clean and accurate, we’ve only
push notifications, timely
considered games with actual revenue. promotions and dynamic
pricing to cater for different
player demographics.
Key takeaways:
Before optimising IAP,
developers should focus on
Spending habits are highest in the lead up to the overall gameplay. After all,
holidays, suggesting the top performing games people can’t spend money if
ramp up their marketing efforts around here. they aren’t playing that game.
There is little difference between the average and
underperforming games, but there is a 3-4x gap
between them and the top performing titles.
For top performing genres, Casino, Role Playing
and Strategy stand out as the highest performers -
with ARPPU up to $40.
For ARPPU, the top performing
titles are seeing an average of $25,
the median $7, whereas the bottom Yearly Overview
performing are seeing just $2.
for ARPPU
15Breakdown of Genre for ARPPU
Top performing games Genre median Underperforming games
For top performing games, Casino,
Role Playing and Strategy stand
out as the highest performers -
with ARPPU up to $40.
16ARPDAU
Offers are key
How much are players spending
Providing in-game offers to
in a game in one day? your players is key to
increasing your ARPDAU.
We break down average revenue per daily active
Player types should be
user to see how much money a developer makes considered in these offers, as
from a user in a single day. Similar to ARPPU, we well as how much they can
only consider games with actual revenue. actually afford. A/B testing
different price points is a
good tactic to see which IAP
Key takeaways: amounts players prefer, and
to get a grasp of what their
budget will allow.
The role playing genre dominates, whereas
arcade games perform the worst, on average.
Thanks for the tip!
Again, there is little difference between average and
underperforming games, but a 6-7x gap between
them and the top performing titles.
Strategy and role playing games as a whole are
performing up to 2x better than more other genres.
For ARPDAU, top performing games
are doing 6x better than the median and
bottom, suggesting they’re running more Yearly Overview
successful campaigns to convert players.
for ARPDAU
17Breakdown of Genre for ARPDAU
Top performing games Genre median Underperforming games
The role playing genre
dominates, however Strategy
games perform up to 2x better
than most other genres.
18Conversion
How to increase
Which genre gets the most conversion
players converting? Developers should know
what will help players with
their gameplay and push
Conversion data is the percentage of users offers and promotions
who made a purchase that day. In the following relating to these.
graphs, the conversion rate is analysed on a
daily basis. A couple of examples include
knowing which level they get
stuck on, when they need
extra lives or if they have
Key takeaways: run out of hints.
There was a peak around New Year’s Eve for Reactive in-game offers
are a great way to remind
top 15% games. players of the items they can
purchase, and can make the
Average games are converting, however the top game more helpful.
performing titles are getting 3x more in comparison.
Role playing games have up to 2x better conversion
rates than other top performing genres.
Values are very low in
general: a game with 1.2% is
performing particularly well. Yearly Overview for
Daily Conversion
19Breakdown of Genre for Daily Conversion
Top performing games Genre median Underperforming games
Role playing games have up to
2x better conversion rates than
other top performing genres.
20Hear what the
best have to say
52,000+ game developers use
GameAnalytics in more than 60K titles.
Alexander Krug | CEO
“The tools from GameAnalytics Ryan McLeod | Creator of Blackbox
have helped us increase our “From deep-dives to health-
monetization performance checks and benchmarking,
by up to 30% for several of GameAnalytics is my source
our Messenger titles.” of truth.”
Chris Benjaminsen | Founder
Gabriel Rivaud | VP of Games
“We use GameAnalytics to get
“I use GameAnalytics all the insight we need about
daily to track core KPIs our players on all platforms,
for our range of our from iOS to FB Instant.”
games. It’s an essential
tool for all data driven
gaming studios. Highly
recommended.”
Trusted by the world’s
leading developers
Player 6
21 21Nate Barker | Director of BD
“Our continued success is dependent on GameAnalytics
providing critical gaming KPIs at our fingertips.”
Marcus Dawson | CEO Mark C. Wang | Co-Founder
“I really like the “Game Analytics help us to
understand at the player
GameAnalytics platform.
behaviour in both macro and
It’s an excellent free tool micro level. We rely on it.”
that helps to shape many
of our daily decisions.”
Matti Kallonen | CEO
Andy Sum | Co-Founder
“We absolutely love
GameAnalytics. The real-
“GameAnalytics is an essential time metrics are a lifesaver
tool to help us understand how for tracking our campaigns.”
people are playing Crossy Road
- love it!”
Player 17
Alexander Krug | CEO
“I really like the GameAnalytics
platform. It’s an excellent free
tool that helps to shape many
of our daily decisions.”
22
22CASE STUDY
How GameAnalytics helps
Voodoo identify and release hit
mobile games each month
CHALLENGE SOLUTION
Taking a game from initial conception, Voodoo uses GameAnalytics to get
through prototype phases and on to a predictive insights about early-phase
financially successful launch is a difficult games. They’re able to quickly shortlist the
task for even the most established of games most promising new titles from hundreds of
studios. It’s even more challenging for those different games pitched to them each month
in the hyper-casual space, especially when by reviewing KPIs like D1 and D7 retention.
you consider the short lifespans of these
types of mobile games. What’s more, GameAnalytics helps Voodoo
gather crucial feedback based on data, so
For publishers like Voodoo, using data to that they can consult with their partners and
identify titles with the best potential, as well give actionable advice to improve the core
as optimize core gameplay loops, is key to metrics and gameplay in each title that they
their continued success. work on.
PLAYERS EMPLOYEES PLATFORM
1+ billion 120 iOS & Android
23Player 3
Where it all began
Voodoo actually started off as a small team developing and releasing their own games.
What originally began as a failed attempt to bring their titles Bool and Quiz Run to
market set in motion a journey to hone the process of mobile games publishing. Using
what they had learnt – tirelessly optimizing UA and monetization strategies – Voodoo
adapted their approach and published Paper.io, which became their first major hit back
in 2016.
These first few releases taught Voodoo two things. Firstly, that the most successful
publishers need practical experience in many areas of game marketing. Secondly, if
they really wanted to make the most of their knowledge of user acquisition and
monetization, they would have to apply this to more titles than just their own.
JUST A FEW OF VOODOO’S NOTABLE HITS
Paper.io Snake VS Block Dune!
20+ million downloads 87+ million downloads 56+ million downloads
Released: Dec 2016 Released: May 2017 Released: Oct 2017
One of Voodoo’s first major successes. Blending two iconic games to create a A visual reworking of a classic format.
An instantly playable title that’s still new and unique mechanic. Snake VS Dune! demands expert timing, but
popular for its charming UI and intuitive Block is a great example of outside the offers sleek graphics and energetic
gameplay. box thinking. gameplay.
Rolly Vortex Helix Jump Hole.io
44+ million downloads 310+ million downloads 40+ million downloads
Released: Aug 2017 Released: Feb 2018 Released: May 2018
Maneuver a ball through obstacles with- One of the biggest hyper-casual hits of Swallow everything in your path, grow
in a vortex. This game cleverly brings all time. Bouncing a ball sounds simple your hole, and kill opponents - there’s
into play progression mechanics like enough, but it’s a tricky game to master. something deeply satisfying about this
levelling up. game.
* Information based on App Annie statistics from November 2017 - November 2018
24A shift to publishing
Voodoo made the decision to shift their efforts and apply what they’d learnt to the
Player 44 wider market, leveraging their skill set to launch several games at any given time. In
order to scale quickly, they wrote a script to scrape the Google Play store, allowing
them to quickly compile the details of thousands of studios for outreach campaigns.
This efficient approach, combined with data collection and analysis using
GameAnalytics, helped Voodoo to identify a new game called Fight List (based largely
on its promising D1 and D7 KPIs). It quickly became a hit on the App Stores, reaching
#1 position in more than 40 countries. The key takeaway here: Voodoo’s game adoption
strategy streamlines the development and review process, whilst minimizing the
commercial risk of launching several titles.
Identifying core potential
When it comes to predicting the success of a title, simply playing the game is rarely
enough. Data is key for recognizing the games with the greatest potential, and
Voodoo reviews this data with user-level access to multiple studios at any given time
via GameAnalytics. They typically look for D1 retention of 50% or greater.
Around 19/20 games with low retention get set aside, whilst studios with promising
numbers and a great concept are given consultation to help improve core gameplay
elements. Voodoo has now become a world leader at finding and refining diamonds in
the rough, using GameAnalytics to see critical KPIs (and even game error logs).
25Tracking an entire portfolio
Once a game has been released, GameAnalytics still plays a role in progress tracking
for the entire Voodoo team, with custom integration via the GameAnalytics Rest API
that feeds GameAnalytics data into their own proprietary dashboard.
Within this platform, product managers, game designers and even partner developers
work together, using GameAnalytics as a way to regularly monitor and optimize the
lifecycle of each and every game across their entire portfolio.
A word from Voodoo
“At Voodoo we review hundreds of games each month. Thanks to the data collected
with GameAnalytics we’re able to help our partners with upcoming trends, clear
creation guidelines, features to increase retention and a unique ideation process.”
“One of the great perks of working as a publisher is seeing how the titles of
enthusiastic developers can be optimised to make a huge impact on their success.
With the many different GameAnalytics SDKs and a custom API integration into
our own platform, we can synchronise insights and feedback with our partners and
streamline the consultancy process. Using data to make judgements and informed
decisions has proved critical to our success.”
Hugo Peyron
PUBLISHING EXPERT |
Player 5
26Other cool stats
you should know
More than 50% of spend on the iOS app
store comes from Asia
Research from App Annie shows that over 50% of Global iOS App Store
spend in 2017 was in the APAC Region, and over 70% of spend in each
region went to games.
Average lifespan of a top 50 grossing
game is 27.75 days
Apptopia identified that the average lifespan for a game to stay within
the top 50 grossing ranks is 27.75 days. They also found that the top 50
grossing iOS mobile games in the US accounted for 76% of the total
revenue.
Rewarding multiple daily sessions is
growing
News from GameRefinery shows that rewarding multiple daily sessions
has become more common within the top 100 grossing games, rising
from 25% to 34% year-on-year.
27 27Mobile games will account for 76%
of global app revenue in 2019
Statistics from Newzoo show that mobile apps will take an estimated
revenue of $107.9 Billion in 2019, with mobile games accounting for
76% of this figure.
Top companies are willing to spend
$500 CPI on super whales
According to Game of Whales, the top grossing companies are willing
to spend more than $500 CPI for their super whales (especially when
they can earn up to $10K in their game).
1st impression pays between 27% to 43%
more than the average eCPM
Research from Soomla shows that in mobile apps, the 1st impression
typically pays between 27% to 43% more than the average eCPM.
Soomla also found that some advertisers churn 3x more users than
others when placed as ads in an app.
28Features any great
analyst should use
We’ve listed some of the most powerful GameAnalytics features you
should use to level up your games and keep your players happy.
Stay up-to-date with
custom dashboards
Build, annotate and share custom
dashboards with different stakeholders
across your studio, so everyone sees
the metrics that matter most to them.
View your
entire portfolio
Easily search, find, pin, and access
your most important titles from one
convenient view. Get a quick snapshot
into the health of your studio, or even
the games that you’ve helped publish.
29 29Slice and dice data
until it’s just right
View and report on the exact data
slice you need, then identify player
segments with advanced combinations
of filters - across multiple dimensions!
Change the game
experience without
updating code
Create variables inside the Command
Center which automatically update to
your players’ devices, allowing you to
trigger certain campaigns, or even adjust
the price of in-game items on the fly.
Learn how campaigns
influence players
See metrics relating to specific
audience groups and track changes
over time to find out how well a
particular campaign, promotion, or
in-game update is doing.
Want to take your
analytics to the next level?
Sign up for free at:
www.gameanalytics.com/signup
30Take your game
to the next level
Sign up for free at:
www.gameanalytics.com/signup
Got questions?
Email: insights@gameanalytics.comYou can also read