Projections for COVID-19 delta wave in Florida
←
→
Page content transcription
If your browser does not render page correctly, please read the page content below

Projections for COVID-19 delta wave in Florida
    Thomas J. Hladish1,2           Alexander N. Pillai1          Kok Ben Toh1,3           Ira M. Longini2,4
                              1
                               Department of Biology, University of Florida
                          2
                           Emerging Pathogens Institute, University of Florida
                    3
                      Department of Preventative Medicine, Northwestern University
                           4
                             Department of Biostatistics, University of Florida
                    Correspondence: tjhladish {at} ufl.edu and ilongini {at} ufl.edu
                                                August 14, 2021

    In summer 2021, the delta variant of concern (VOC) of SARS-CoV-2 was first detected in Florida, and accounted
for over 70% of reported cases by mid-July [1, 2]. The delta variant is currently driving a major wave of COVID-19
cases and hospitalizations. Because death due to COVID-19 tends to not occur until a few weeks after symptoms
begin, we are likely to see a substantial peak in deaths that follows the peak in reported cases. While there is
uncertainty around how the the general public and policy makers will respond to this wave, we do not believe there
will be a strong behavioral or policy response in Florida like we saw early in the pandemic. This is consistent with
observations from cellphone mobility data. In the results presented here, we do not consider VOCs that might be
introduced after delta, potentially driving winter 2021-2022 transmission.

Results

Figure 1: Reported daily cases for Florida, modeled (yellow) compared to empirically reported cases in the state of
Florida (black). The projected peak of 33,000 cases per day for the entire state corresponds to about 150 cases per
day per 100,000 residents.

                                                         1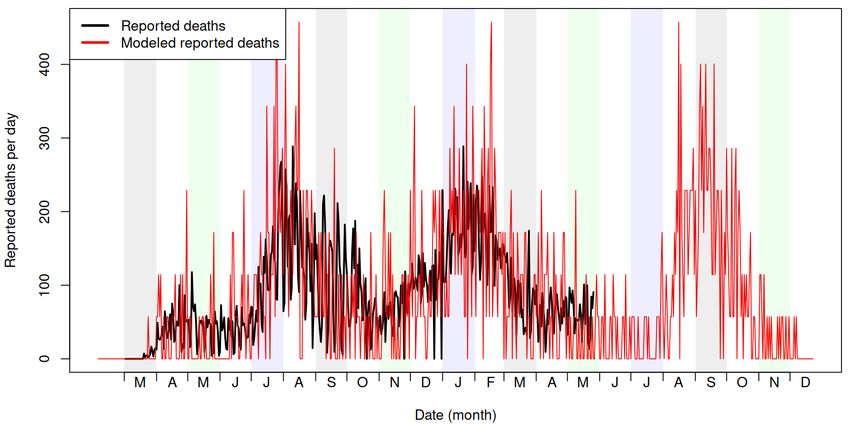
Figure 2: Reported weekly cases for Florida, modeled (yellow) compared to empirically reported cases in the state of
Florida (black). The projected peak of 220,000 cases per week for the entire state corresponds to about 1,000 cases
per week per 100,000 residents. Incomplete weeks in the reported data at the beginning and end of the time series
have been omitted.

Figure 3: Time-varying reproduction number (Rt ) measured from our model. Rt is the average number of infections
that will be directly caused by each person infected on a given day. Note that Rt corresponds to how rapidly an
epidemic is growing, and not when the most infections are reported, and thus is highest at roughly the halfway point
during the growth phase of an epidemic wave.

                                                         2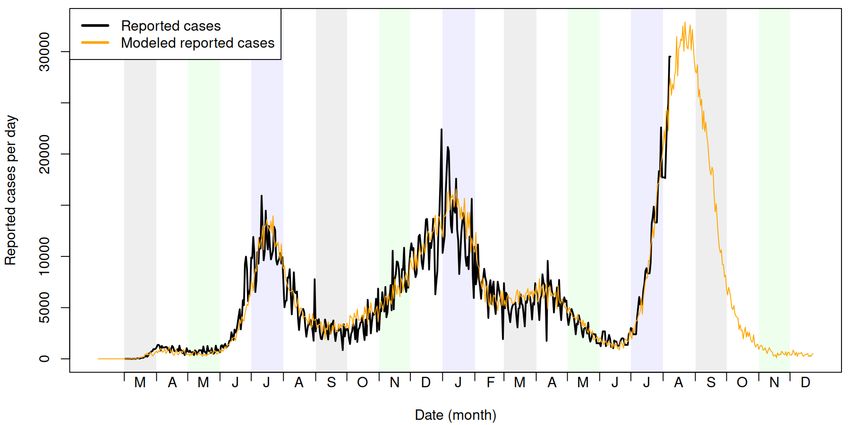
Figure 4: Total (both asymptomatic and symptomatic) infections for Florida from our model. Note that availability
of testing and reporting lags have changed during the course of the pandemic, and thus the infection curve looks
substantially different from the reported case curve above.

Figure 5: Reported daily deaths for Florida, modeled using the ABM (red) compared to empirically reported cases
in the state of Florida (black).

                                                       3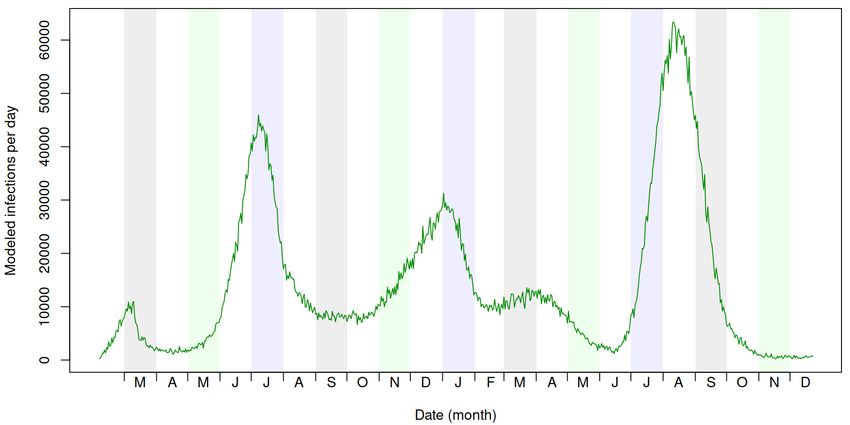
Methods
    We have developed a detailed simulation model to serve as a tool for assessing the COVID-19 epidemic in Florida.
The model is a data-driven, stochastic, discrete-time, agent based model with an explicit representation of people
and places [3]. Households in the model are sampled from census and survey data in order to establish a realistic
distribution of age, sex, comorbidity, employment and school-attendance status. Activities and interaction patterns
affect how likely someone is to be exposed in the model, and age, health status, and healthcare seeking behavior affect
how severe a person’s infection is likely to be. People go to work or school, visit friends, and patronize businesses in
the model. The simulation includes closure of non-essential businesses, reduced school attendance, and changes in
behaviors during the course of the pandemic. Our full Florida model represents 20.6 million people residing in 11.2
million households and 3.8 thousand long-term care facilities and who work in 2.3 million workplaces and attend
7.6 thousand schools. However, for this simulation study, we created a smaller, representative sample of the entire
synthetic population totalling 375,000 people. We rescale the output from the model in order to estimate the cases
and deaths for the entire state.
    During each simulated day, infectious and susceptible individuals can aggregate in households, workplaces (both
as employees and as customers), schools, long-term care facilities, and hospitals at different times in the day (Fig. 6).
When susceptible and infectious people come together at the same location, there are new opportunities for the
transmission of the virus.
    If an individual becomes infected, the progression of the infection follows an SEIRD model where people progress
through susceptible (S), exposed (E), infected (I), recovered (R), and dead (D) states. Additionally, infected
individuals can develop mild (IA ), severe (IM ), or critical (IC ) symptoms (Fig. 6. People who become ill can may
seek healthcare, resulting in that individual receiving hospital care (for severe symptoms) or ICU care (for critical
symptoms), which in turn lowers the risk of death.
    Beyond non-pharmaceutical interventions (e.g. business or school closures, social distancing, stay-at-home orders),
the model also represents vaccination of the synthetic population. In our model, we simulate a generalized mRNA
vaccine (Table. 1) that performs similarly to the BioNTech and Moderna mRNA vaccines that have been used in
Florida [4]. We simulate a rollout of vaccines that begins in January, 2021, with vaccine availability and campaign
phases reflecting the vaccine rollout that has occurred in Florida (i.e. starting with healthcare workers and older
members of the population and progressively widening eligibility to younger age groups).

                  Wildtype               Alpha                   Delta
                                                                                               Details
               Dose 1 Dose 2         Dose 1 Dose 2          Dose 1 Dose 2
     V ES         0.4 | 0.8            0.21 | 0.76            0.05 | 0.52         Efficacy against susceptibility
                                                                                    Efficacy against pathology
     V EP         0.67 | 0.75           0.35 | 0.71            0.29 | 0.75
                                                                                         (given infection)
                                                                                 Efficacy against severe outcomes
     V EH          0.9 | 1.0              0.9 | 1.0             0.9 | 1.0
                                                                                         (given infection)
     V EI          0.4 | 0.8              0.2 | 0.5             0.1 | 0.1         Efficacy against infectiousness

Table 1: Vaccine efficacy (V E) values assumed in our model, based on estimates from multiple Phase III trials and
other published sources [4].

                                                           4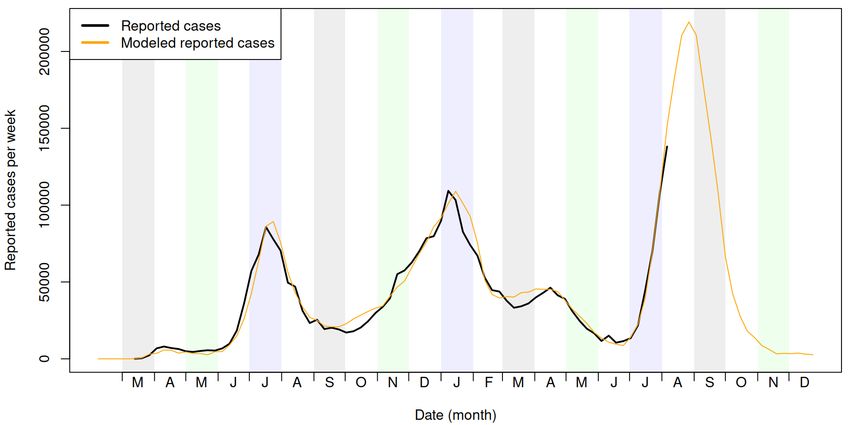
Figure 6: (A) Progression of the disease states in the model: susceptible (S) individuals may become exposed (E)
to the virus, then progress to being infected (initially asymptomatic [IA ], possibly progressing to mild [IM ], severe
[IS ] or critical [IC ]), and finally recovering (R) or dying (D). (B) Model locations of households and workplaces
in an urban region (Miami, FL). (C) An example household. People may contact others by socializing with other
households, by going to work or school, by going to the hospital, or by patronizing nearby businesses (not shown).
(D) Attributes of the people in this household.

References
1.   CDC. Variant Proportions https://covid.cdc.gov/covid-data-tracker/#variant-proportions.
2.   HELIX. The Helix COVID-19 Surveillance Dashboard https://www.helix.com/pages/helix- covid- 19-
     surveillance-dashboard.
3.   Shea, K. et al. COVID-19 reopening strategies at the county level in the face of uncertainty: Multiple Models
     for Outbreak Decision Support. medRxiv. doi:10.1101/2020.11.03.20225409. https://www.medrxiv.org/
     content/early/2020/11/05/2020.11.03.20225409 (2020).
4.   Shapiro, J. et al. Efficacy Estimates for Various COVID-19 Vaccines: What we Know from the Literature and
     Reports. en. medRxiv, 2021.05.20.21257461. doi:10.1101/2021.05.20.21257461. https://www.medrxiv.org/
     content/10.1101/2021.05.20.21257461v1 (2021) (May 2021).

                                                          5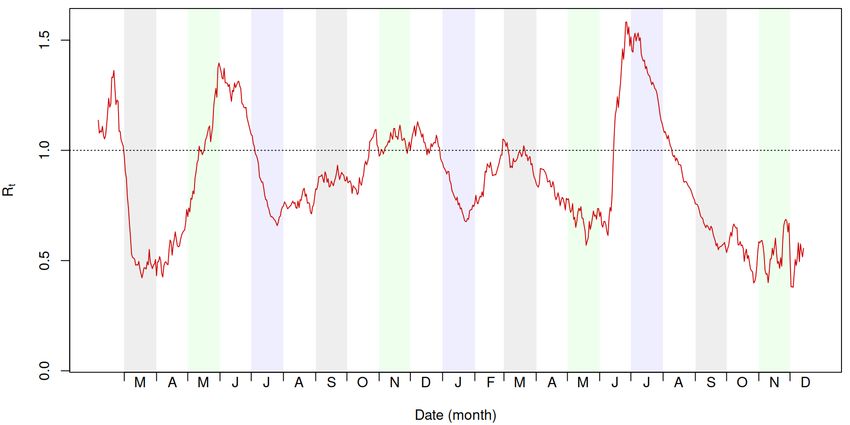
You can also read