Public Attitudes to Road Safety 2020 - 15 April 2021 Paul Graham, Principal Scientist - Transport Knowledge ...
←
→
Page content transcription
If your browser does not render page correctly, please read the page content below
Public Attitudes to
Road Safety 2020
15 April 2021

Paul Graham, Principal Scientist
Where it fits with Road to Zero

 • Our vision is a New Zealand where no one is killed or seriously
 injured in road crashes.

 • The survey allows Waka Kotahi and our road safety partners to
 better understand peoples’ attitudes and behaviour around
 important road safety issues.

 • It restores the time series of public attitudes to road safety
 conducted annually from 1995-2016, so we can see how attitudes
 are changing over the course of Road to Zero.

 • It allows us to establish baselines for new questions, such as
 public support for the idea of Vision Zero.
Methodology
• 3,300 survey respondents in two streams, representative of the
 New Zealand population

• 127 questions on specific road safety topics, including:
 • speed
 • car safety
 • driver fatigue, impairment and distraction
 • attitudes to enforcement
 • Road to Zero/Vision Zero.

• Built on the foundation of LTSA’s and Ministry of Transport’s road
 safety survey programme

• The report will be published annually
Publication

• The survey results and data are available on the Waka Kotahi
 website at:

 https://www.nzta.govt.nz/resources/public-attitudes-to-road-safety/

• The survey data are also available on the Open Data Portal
 (use the latest version of Google Chrome, Apple Safari, Mozilla Firefox, or Microsoft Edge)
Contents

 General attitudes to road safety and
 Seat belts
 enforcement

 Speed and speed enforcement Fatigue

 Alcohol-impaired driving and
 enforcement Driver distraction

 Drug-impaired driving and
 enforcement Car safety

 Vision Zero Safety

 7
General attitudes to road safety and enforcement
Most (81%) New Zealanders consider our roads to be generally safe to travel on.

 100

 90

 80

 70

 60

 50

 40

 30
 Fairly / very safe
 20

 10

 0

 Source (Stream b): Q2 Now thinking about road safety - In your opinion, would you say New Zealand roads are generally safe or unsafe to travel on?
 [PROBE] Is that very or fairly?
 Wording prior to 2020: Q2 In your opinion, how safe or unsafe are New Zealand roads to travel on? Using the scale on this CARD, would you say travelling
 on New Zealand roads is….?
 8
 Base: Total New Zealand 2020 n = 1,699 | 2016 n = 1,666

General attitudes to road safety and enforcement
Other drivers, speeding, road design and road surface/quality are the main aspects that can make travelling on New Zealand roads unsafe.

 Other driver related (i.e. bad driving) 43
 Road design related 25
 Road surface / quality related 25
 People speeding / driving too fast 16
 The weather 11
 Roadworks / road maintenance related 8
 Drunk drivers / drug driving related 7
 Road markings / signage related 6 Things that can make travelling on New
 Zealand roads unsafe – top 13,
 Lack of median strips / central barriers 5 unprompted, coded into general themes
 High traffic volume / congestion related 5 (% among total New Zealand)
 Road speeds / too fast for some roads related 4
 People not driving to the conditions 3
 Large trucks on the road 3

 Source (Stream A and B): Q4 In your opinion, what things, if any, can make travelling on New Zealand roads unsafe? Are there any others?
 Wording prior to 2020: Q4 Now I’d like you to think about the different things which can make travelling on New Zealand roads unsafe. In your opinion,
 what things can make travelling on New Zealand roads unsafe? Are there any others?
 Base: Total New Zealand 2020 n = 3,392 9
Speed and speed enforcement
The majority think that the speed limits on the roads they normally use are about right for the road and traffic conditions

 Source (Stream A): Q27 Now thinking about the roads you normally use, in your opinion are the speed limits for these roads too high, too low or about right
 for the road and traffic conditions?
 Base: Total New Zealand 2020 n = 1,695 | 2016 n = 1,666
 10
Speed and speed enforcement
30% of New Zealanders believe there is not much chance of an accident if you are careful when speeding.
Perceived risk of being caught speeding is on decline.

 Percentage who agree

 Not much chance of an accident if 30 2020
 careful when speeding 16
 2016

 Risk of being caught speeding is small
 44
 24

 Penalties for speeding are not very 40
 severe even if caught 30

 The higher your speed the more chance 88 New question in 2020
 of a crash

 Enforcing the speed limit helps lower the 74
 road toll 73

 Source (Stream A): Q24 Do you strongly agree, agree, are neutral, disagree or strongly disagree with each of the following statements?
 Statement wording prior to 2020: Q24 Various reasons have been suggested for people speeding. Using the scale on this CARD, tell me how strongly you
 agree or disagree with each of these suggestions. –
 Base: Total New Zealand 2020 n = 1,695 | 2016 n = 1,666
 11
Speed and speed enforcement
Attitudes towards speed, by age group.

 Percentage who agree

 Risk of being caught speeding is small

 55
 51 49
 48
 40 41 40
 37 37
 34
 31

 16-19 20-24 25-29 30-34 35-39 40-44 45-49 50-54 55-59 60-64 65+

 14
Speed and speed enforcement
Attitudes towards speed, by Region.

 Percentage who agree

 The higher your speed the more chance of a crash
 94 92 93
 88 91 88 91 88 91
 87 85 86

 71

 31

 15
Seat belts
There has been an increase in agreement that the risk of being caught not wearing a seat belt is small, and that the penalties are
not very severe if you are caught.

 Agreement over time (% strongly agree / agree)

 The risk of being caught not wearing a seat belt is small
 The penalties for not wearing a seat belt are not very severe even if you are caught
 100
 90
 80
 70
 60
 50
 40
 30
 20
 10
 0
 1995
 1996
 1997
 1998
 1999
 2000
 2001
 2002
 2003
 2004
 2005
 2006
 2007
 2008
 2009
 2010
 2011
 2012
 2013
 2014
 2015
 2016
 2020
 16
Seat belts
Wellington and Otago regions are the least likely to agree that the risk of being caught not wearing a seat belt is small.

 Percentage who agree

 The risk of being caught not wearing a seatbelt is small

 57 59 60 60
 55 54 54 57 54
 50 52
 47
 41 44

 17
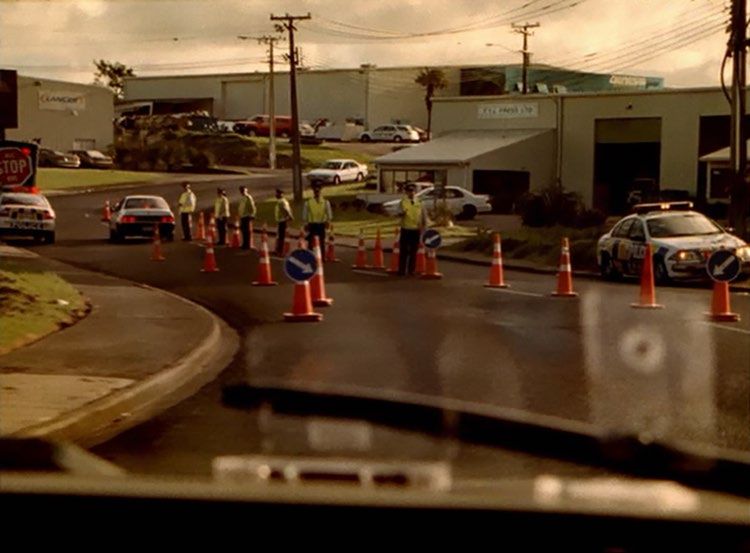
Alcohol-impaired driving and enforcement

 18
Alcohol-impaired driving and enforcement
Similar to previous years, just over one in three agree that they normally can tell where alcohol checkpoints will be and 23% use
the back streets if they are unsure if over the limit or not.

 Agreement over time (% strongly agree / agree)

 100
 Around here, you can usually tell where alcohol
 90 checkpoints will be
 80 If I am not sure if I am over the limit or not, I usually
 70 use the back streets to drive home
 60
 50
 40
 30
 20
 10
 0
 1995
 1996
 1997
 1998
 1999
 2000
 2001
 2002
 2003
 2004
 2005
 2006
 2007
 2008
 2009
 2010
 2011
 2012
 2013
 2014
 2015
 2016
 2020
 19
Alcohol-impaired driving and enforcement
One in three New Zealanders with a driving licence have been stopped at an alcohol checkpoint while driving in the last 12
months - a significant decrease on recent years.

 Stopped at an alcohol checkpoint in the last 12 months… - Over time
 (% among those with a driver's licence)

 100
 90
 80
 70
 60
 50
 40
 30
 20
 10
 0
 1995
 1996
 1997
 1998
 1999
 2000
 2001
 2002
 2003
 2004
 2005
 2006
 2007
 2008
 2009
 2010
 2011
 2012
 2013
 2014
 2015
 2016
 2020
 20
Drug-impaired driving
Very few claim to have driven while affected by prescription or pharmacy drugs, being more common without alcohol (at 7%).

 Driven in past 12 months affected by… - Over time

 Prescription or pharmacy drugs combined with alcohol
 Prescription or pharmacy drugs without alcohol
 100
 90
 80
 70
 60
 50
 40
 30
 20
 10
 0
 2014 2015 2016 2020

 21
Driver distraction
There has been an increase in use of hands free phone calling while driving to 51% since 2016 and a decrease in use of hand
held phone calling to 16%.

 How often use a mobile phone while driving in the last month to make…

 2016 2020

 Hand-held
 phone calls 22 % 16 %
 78 84

 Hands-free
 phone calls 61
 39 % 49 51 %

 Source (Stream B): Q65 For the following question, please think about your driving in the month prior to New Zealand entering Level 4 Covid-19 restrictions.
 How often did you use a mobile phone while driving to do each of the following? Please answer whether it was often, occasionally, once or twice or not at all.
 Base: Those with a driver's licence 2020 n = 1,586 | 2016 n = 1,522 22
Enforcement: perceived likelihood
Percentage of people surveyed who think they are likely to be caught undertaking risky behaviours.

 Survey
 report
 Those who page

 Likely for a person who breaks a traffic law, other than drink-driving
 Agree 32% 25
 or speeding, to be stopped by the Police

 Disagree The risk of being caught speeding is small 40% 42

 Disagree The risk of being caught drinking and driving is small 42% 58

 Disagree The risk of being caught not wearing a seat belt is small 32% 80

 Likely that a person who is using a hand-held cell phone or texting
 Agree 17% 94
 while driving will be caught by Police

 Average percentage across all 5 behaviours (not drugs) 33%

 Note: the drugged driving question (Q63, page 76) is not included, because it shows the perceived likelihood of being tested, not “caught”.

 23
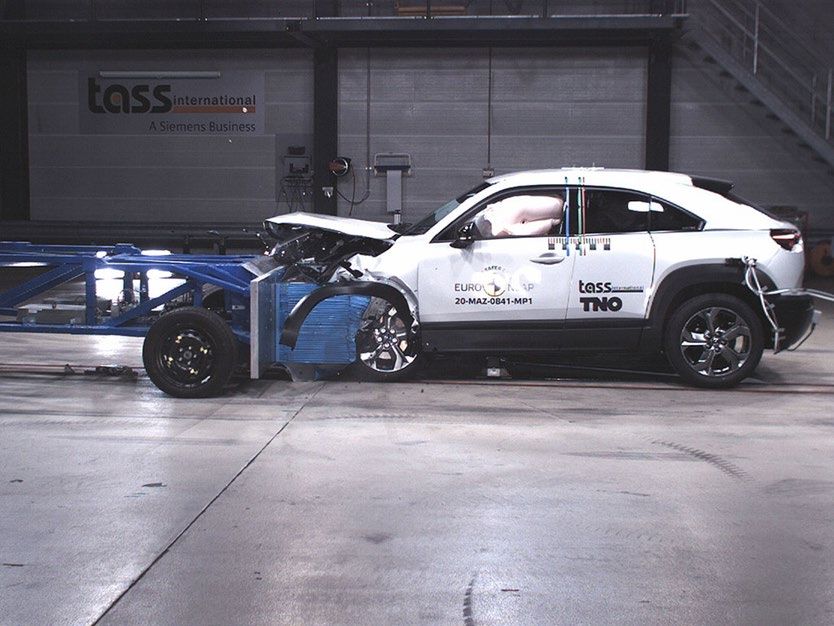
Car safety

 24
Car safety
42% know the star rating of the car they drive, and it is important to 74% that their car has a high star safety rating.

 Star rating of car you usually drive Importance that your car has a high star safety rating

 Don't know Not at all important Not that important
 5 star 19 Neutral Quite important Very important

 4 star 16 9 74

 3 star 5 42% are aware of the
 star rating of their car
 23 5 16 28 45
 2 star 1

 1 star 1

 Don't know 58

 Source (Stream B) : Q71 Do you know if your car has a 1, 2, 3, 4, or 5 star rating? [IF REQUIRED] A star safety rating indicates how well your car is likely to perform in a crash.
 Base: Those with a driver's licence n = 1,560
 25
Fatigue
Approximately one in ten drivers have had trouble staying awake on at least one occasion in the last 12 months while driving
either to or from work or as part of their work.

 Trouble staying awake in the last 12 months – Over time
 (% once or twice / occasionally / often)

 While driving to or from work While driving as part of your work
 100
 90
 80
 70
 60
 50
 40
 30
 20
 10
 0
 2011 2012 2013 2014 2015 2016 2020

 26
Public safety
 The majority of New Zealanders would feel safe around other travellers if using a bus or train.

Feeling of safety around other travellers
(% among Total NZ)

 Don't know / Not applicable Very unsafe Don't know / Not applicable Very unsafe
Using a bus Using a train

 3 92 2 90

 2020 5 12 47 45 2020 9 11 35 54

 5 90 2 89

 2016 5 1 5 53 37 2016 8 12 45 44

 = Significantly higher than 2016 at 95% CL
 = Significantly lower than 2016 at 95% CL

 Source (Stream A): Q74 The following questions are about your feeling of personal safety and security using different types of transport. By this we mean,
 how safe you feel around other travellers such as from attacks or abuse and how safe from the risk of crashing. Would you feel very safe, fairly safe, fairly
 unsafe or very unsafe using each of the following?
 Base: Total New Zealand 2020 n = 1,695 | 2016 n = 1,666 27
28
Road to Zero
More than two in five New Zealanders (44%) think that zero deaths from road crashes are acceptable next year.

 Acceptable number of deaths from road crashes next year
 (% among Total NZ)

 None / zero 44
 Respondents were informed that around 350 people are killed 10 or less 3
 each year on New Zealand roads. 50 or less 5
 They were then asked what they would consider to be an 100 or less 10
 acceptable number of deaths from road crashes next year.
 200 or less 13
 300 or less 9
 350 or less 5
 28%
 More than 350 1
 Don't know 9

 Source (Stream B): Q77 In New Zealand around 350 people are killed each year on our roads. In your opinion, what would you consider an
 acceptable number of deaths from road crashes next year?
 Base: Total New Zealand 2020 n = 1,699
 29
Road to Zero
There is low awareness of the Vision Zero approach to road safety currently at 11%, and more think it’s unlikely (50%) than
likely (24%) that Zero can be achieved by the year 2050.

 Heard or read about the Vision Zero approach to road safety (%) How possible to have Zero road deaths by 2050 (% among Rest of NZ)

 Yes No Can’t remember Likely 50:50 Unlikely

 2

 11 %
 50 24 %

 25
 87

 Source (Stream B): Q79 Have you heard about or read about the Vision Zero approach to road safety? Q80 Vision Zero is a world leading approach to
 road safety in which no loss of life on our roads is acceptable. How possible do you think it would be for New Zealand to have no road deaths by the year
 2050? Do you think it could be very likely, quite likely, quite unlikely, very unlikely or 50:50? Base: Total New Zealand 2020 n = 1,699 30
Road to Zero
More people in the larger cities think it’s likely that Zero can be achieved by the year 2050.

 Percentage who agree It would be possible for New Zealand to have zero road deaths by 2050

 29 27 28 26
 22 23 22
 17 18 19
 15 15
 11 11

 Source (Stream B): Q80 Vision Zero is a world leading approach to road safety in which no loss of life on our roads is acceptable. How possible do you
 think it would be for New Zealand to have no road deaths by the year 2050? Do you think it could be very likely, quite likely, quite unlikely, very unlikely or
 50:50? Base: Total New Zealand 2020 n = 1,699 31
Road to Zero
Percentage of the general public who support possible road safety initiatives

 (% strongly support/support
 Possible initiatives
 among Total NZ)

 Compulsory roadside testing of drivers for drug use, which could take up to 10 minutes 80%

 Much higher fines for using a mobile phone while driving 80%

 Increased installation of wire rope median barriers on rural roads, which prevent vehicles
 69%
 from crossing the centre-line

 Requiring additional safety features or higher star safety ratings in new cars, which could
 61%
 make them more expensive

 30 km/h speed limits in urban centres, which mean collisions with pedestrians and cyclists
 58%
 are usually survivable

 Source (Stream B): Q78 New Zealand's road safety strategy includes a number of initiatives designed to reduce the likelihood of deaths or serious injuries
 in the event of a crash. How much do you support or oppose each of the following initiatives? Please use the scale of strongly support, support, neutral,
 oppose and strongly oppose.
 Base: Total New Zealand 2020 n = 1,699 32
How we will use this research

• KPI reporting
 • Statement of Performance Expectations (SPE)
 • Road to Zero Outcomes Framework
 • Government Policy Statement (GPS)

• Informing road safety policy and activity, including
 • drug impaired driver testing policy
 • road safety advertising campaigns
 • child restraint education programme
 • Police enforcement activity
You can also read