Pulsar Kicks and Proper Motions - Ruobing Dong 10.21.2009
←
→
Page content transcription
If your browser does not render page correctly, please read the page content below
Pulsar Kicks and
 Proper Motions

  Ruobing Dong
   10.21.2009
OUTLINE Evidences of pulsar kick. History of observational measurement of pulsar velocities. Theoretical model to explain pulsar kick
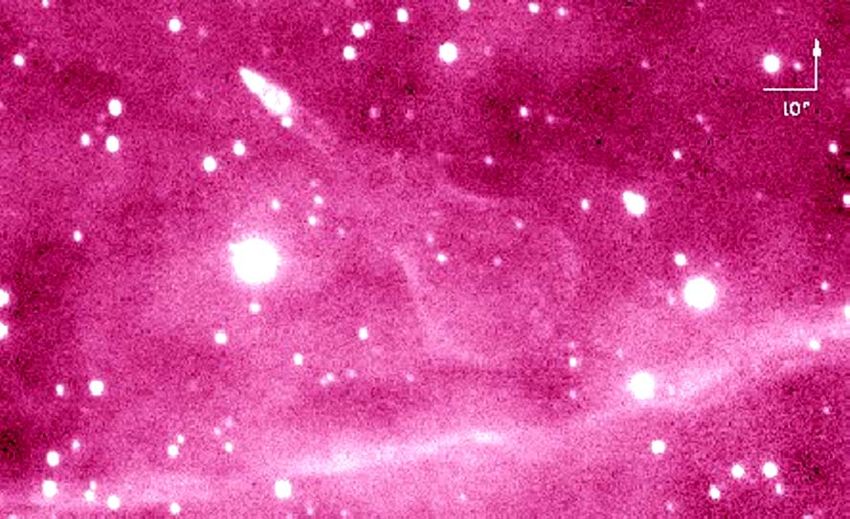
Evidences of Pulsar Kick Guitar nebula: Proper motion ~0.175 arcsec/yr, Distance ~2kpc Transverse speed: ~1600km/s
Evidences of Pulsar Kick (Lyne & Lorimer 1994)
Proper motion
measurements.
Mean Vtran=300 km/s
Monte Carlo simulation
gives birth 3D space
velocity ~450 km/s
Major reasons for a
higher V than previous
results: Selection effect
29 pulsars with age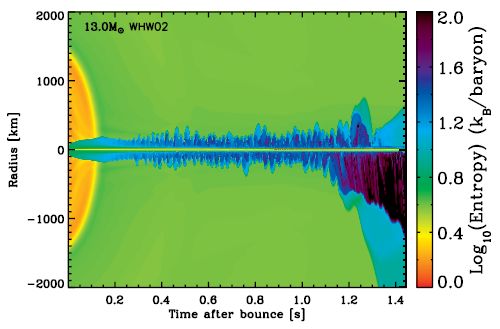
Evidences of Pulsar Kick
Bailes 1989, Dewey & Cordes 1987
~2% known pulsars are
Binary systems contain an old pulsar and a in binary system.
presupernova.
~50% (or higher)
Randomly directed asymmetric supernova progenitors (OB) are in
explosion.
binary system.
All population evolution
models with symmetric
supernovae produce
birth rates some 1 or 2
orders of magnitude
larger than observed
value whereas
simulations which
include kicks of a few
hundred km s~1
produce the correct
birth rates (Spreeuw &
Portegies Zwart 1995; Lipunov et al.
1996).
Generally, Kick V increases, survival probability decreases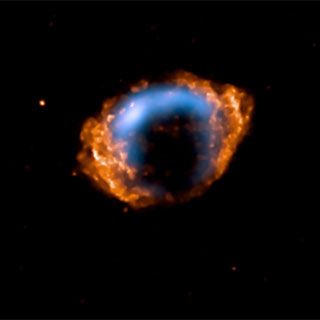
Evidences of Pulsar Kick
Observed orbital e of X-Ray binaries with a NS and a normal companion is always high (0.3-0.9)
Before SN: Large-scale mass accretion from the presupernova onto its companion have tidally
circularized the orbits of the systems, e.g., initially e~0
A symmetric SN explosion can only raise e to ~0.15. Asymmetric kick is required. (van den
Heuvel 1994)
Cir X-1: P: 16.6d; e: 0.94; radial velocity: 470 km/s (Johnston et al. 1999)
A kick velocity of 740 km/s is needed to reproduce the system by simulations (Tauris et al.
1999).Evidences of Pulsar Kick
van den Heuvel & van Paradijs 1997
Nonalignment of Spin and
Orbit in PSR J0045 7319: a
neutron star is in orbit
around a B star.
The large amount of mass
accretion that the B star
received from its companion
before SN explosion must
caused its rotation axis to
have been aligned with the
normal on the orbital plane.
A kick at least 100 km/s is
require to misalign the spin
and the orbitFirst Indication of Birth Velocity
Gunn & Ostriker 1970
The average pulsar may
at birth acquire a rather
large V. The young
pulsars are close to the
plane where they were
born. When their age
increases, their initial
velocity carries them
further and further from
the plane.
|Z|: the distance from the plane of the galaxy
P: the period of the pulsars. (P increases with age)
Four bins with approximately equal populationMeasurement of Velocity
1. Angular proper motion measurements:
μ D
V pm = 4.74 km / s
m as / yr kpc
Accurate, but requires a long series of precise
observations using a high-resolution radio interferometers.
2. Measure the pulsar velocity from the speed of the
interstellar scintillation pattern as it moves across
the Earth. (Lyne & Smith 1982)
Δf D τ −1
V iss = 4.8 × 10 4 ( ) km / s
M H z kpc s
Single telescope, short time measurement, but based on
assumptions of ISMHistory of Pulsar Velocity Measurement
Lyne et al. 1982
Observations of the proper motion of 26 pulsars, based
on radio interferometry.
rms transverse velocity 1/2=170 km/s
Mean transverse velocity =134 km/s
Assuming the velocity distribution is isotropic:
1/2= 1/2=208 km/s
Consider the gravitational acceleration, the birth
velocities will be typically 10-20% greater than the
observed velocities now.
Notice: for Maxwellian distribution: < v t >
2 1/ 2 1/ 2
2 σ
= = 1.13
< vt > (π / 2) σ
1/ 2
The observational value: < vt > = 1.27
2 1/ 2
< vt >
Not Maxwellian (confirmed by later observations)History of Pulsar Velocity Measurement
Cordes 1986
71 pulsars
Solid curve: ISS measurement
Based on interstellar Dashed curve: PM measurement
scintillations.
Average Vtran: ~100 km/s
3D space V: ~160 km/s
The observations
overestimate the number
of low-V objects since
high-V ones spend only a
small fraction of their
radio lifetime at a
detectable distance
Later found to be systematically low by a factor of ~2 (Harrison & Lyne 1993),
due to a concentration of scattering material close to the galactic place.History of Pulsar Velocity Measurement
Harrison & Lyne 1993
Proper motion measurement.
(similar to Lyne et al, 1982.)
3D space velocity: mean ~ 220
km/s rms ~ 300 km/s
Correlation: the younger and
the more distant ones have the
greater velocities.
The reasons that these previous
results are systematic lower than
the later results:
1. Younger sample
3. Selection effect
2. New pulsar distance model
(Taylor & Cordes 1993)History of Pulsar Velocity Measurement
A new model for the
distribution of free
electrons in the Galaxy
(Taylor & Cordes 1993),
largely improves the
distances estimation.
Abandon the previous
assumption of an
axsymmetric Galaxy
model. Instead, take into
account the structure of
arms and other structures.
Previous models
underestimate the pulsar
distance by a factor of 1.5-
2. Î The same for the
pulsar velocity. Free electron density in the galactic planeHistory of Pulsar Velocity Measurement
Caraveo 1993
A sample of 11 pulsar-SNR
associations (based on age,
distance, and spatial
coincidence), 10 of them are
the 10 youngest pulsars!).
Pulsar velocity. (v=D/tage)
4 V ~> 1000 km/s, the highest
one > 1700 km/s
The reliability of the result
depends on the correct
association between pulsars
and SNR.Summary of Observation History
~100 km/s: interpretation of vertical distribution of
pulsars with different ages. (Gunn & Ostriker 1970)
~210 km/s: rms space velocities extracted from
measurement of proper motion. (Lyne et al. 1982)
~160 km/s: rms space velocities from interstellar
scintillations. (Cordes 1986) (systematically low by a
factor of 2: Harrison & Lyne 1993)
~300 km/s: rms space velocities extracted from
measurement of proper motion. (Harrison et al. 1993,
larger V due to more young pulsars.)
~450 km/s: mean pulsar birth V. (Lyne & Lorimer 1994)
~690 km/s: Pulsar-SNR association. 4 out of 11 gives V
>~1000 km/s (Caraveo 1993)Mechanisms to Explain the Observed High Velocity
High Velocity Progenitors
For progenitors with intrinsic
high velocities (runaway
progenitors), a symmetric
explosion will leave the new-
born NS a high velocity (inherit
from its progenitors).
Only 20% O and 2% B (the
progenitors of the pulsars) are
runaway stars (with V>40 km/s),
and vary rare to have V>200
km/s.
Failed to explain the observed
faction of high velocity and the
highest velocities.Mechanisms to Explain the Observed High Velocity
Disruption of Binary Systems
Sufficient and impulsive mass
loss (supernova) of one
component of a binary pairÎ
Disruption of the system Î
Components (nascent NSs)
leave with nearly orbital
velocity. (Gott et al. 1970)
Failed to explain the observed
velocity distribution with the
requisite mean and dispersion
(Iben & Tutukov 1996).Mechanisms to Explain the Observed High Velocity
Radiative Acceleration
Pulsars are accelerated to their
present velocities after they are
born, due to asymmetric radiation
field. (Harrison & Tademaru 1975)
The force due to asymmetric
radiation field can be initially
extremely large, and diminishes
rapidly.
Should have the spin axis aligned
with the velocity vector (Morris et
al. 1976), but not confirmed by
observations (Anderson & Lyne
1983).Mechanisms to Explain the Observed High Velocity
Asymmetric Explosion: Approximate Scale Relations (Burrows et al. 2007)
dM e
Recoil force= (sin α )v
dt
sin α average “anisotropy parameter” (would be 0 for
isotropic explosion).
V: the characteristic wind velocity.
dMe/dt is the wind mass-loss rate.
Recoil (kick) velocity vk is 2 E sin α
vk =
M ns v
Mpn: residue mass. E: explosion energy
Assume the scale of v is set by a sound speed (~30,000-
100,000 km/s)
E
vk = 1000 51 sin α km / s
10 ergsSimulations of Asymmetric Explosion
Burrows & Hayes 1996
Initial conditions: artificially
introduces a density dipole
anisotropy < 0.1%
Entropy distribution at ~50 ms into the
explosion
The explosion erupted preferentially in
the direction of the wedge -- the least Recoil speed (km/s) vs time
resistance direction. The initial Minus in sign indicates the opposite
asymmetry Î Asymmetric explosion direction of the wedge
Conclusion: a small initial asymmetry translates into an appreciable
intrinsic neutron star recoil. Final neutron star (1.2 Mo) velocity ~ 530 km/sSimulations of Asymmetric Explosion
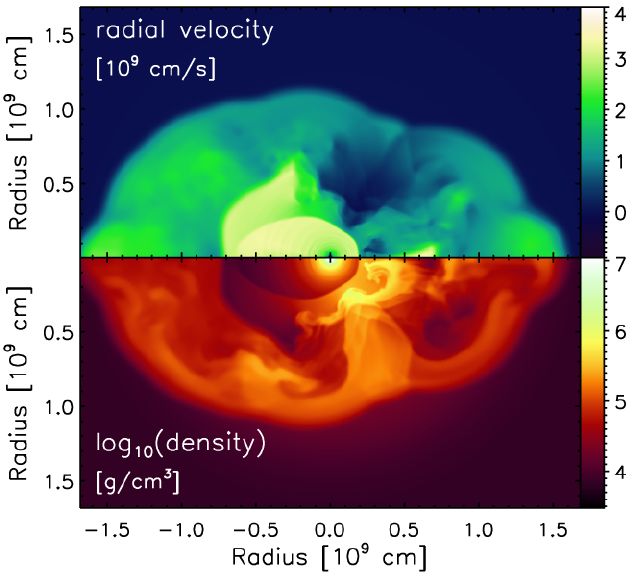
Sheck et al. 2004
Asymmetric explosion due to Anisotropic
neutrino emission from the PNS.
Reasons for anisotropy of neutrino emission:
Hydrodynamical instability due to
convection
Inhomogeneous neutrino opacity
Dependence of neutrino transportation
on magnetic field direction.
Neutrino luminosity
Lib=4.45x1052ergs/s, explosion
energy=1.2x1051ergs, and kick
velocity of the NS=520 km/sSimulations of Asymmetric Explosion
Burrows et al. 2007
Net force (left) and The
accumulated impulse (right) due
to neutrinos.
Entropy profile. Shock position
Negative sign indicates the
neutrinos are emerging
preferentially in the direction of
the exploding matter.REFERENCES Spreeuw, H., & Portegies Zwart, S. 1995, A&A, 312, 670 Dewey, R. J., & Cordes, J. M. 1987, ApJ, 321, 780 Iben, I., Jr, & Tutukov, A. V. 1995, ApJS, 100, 217 Lyne, A. G., & Lorimer, D. R. 1994, Nature, 369, 127 Lipunov, V. M., et al. 1996, MNRAS, van den Heuvel, E. P. J., & Lorimer, D. R. 1996, MNRAS, 283, L37 van den Heuvel, E. P. J.; van Paradijs, J. Woosley, S. E. 1987, IAUS, 125, 255W Harrison, P. A. & Lyne, A.G. 1993, MNRAS, 265, 778 Cordes, J. M., 1986, ApJ, 311, 183 Bailes, Matthew 1989, ApJ, 342, 917 Lyne, A. G.; Smith, F. G. 1982 , Natur.298 , 825 Lyne, A. G.; Anderson, B.; Salter, M. J. 1982 , MNRAS , 201 , 503 Gunn, J. E.; Ostriker, J. P. 1970, ApJ, 160, 979 Caraveo, Patrizia A. 1993, ApJ , 415L , 111 Taylor, J. H.; Cordes, J. M. 1993 , ApJ, 411, 674 Burrows, A.; Livne, E.; Dessart, L.; Ott, C. D.; Murphy, J. 2007 , ApJ , 655 , 416 Burrows, A. & Hayes, J., 1996, PhRvL , 76 , 352 Lai, D. Chernoff, D.F. & Cordes, J.M 2001 , ApJ , 549 , 1111 Tauris, T. M., et al. 1999, MNRAS, 310, 1165
You can also read