FAST FACTS NZ What you need to know about TV Viewing - Published March 2020 - Think TV

Page created by Bill Mitchell
 
CONTINUE READING
FAST FACTS NZ What you need to know about TV Viewing - Published March 2020 - Think TV
FAST FACTS NZ
                       What you need to know about TV Viewing
Published March 2020
FAST FACTS NZ What you need to know about TV Viewing - Published March 2020 - Think TV
ThinkTV’s latest Fast Facts
                                                                   provides all the details about
                                                                   TV viewership in New Zealand,
                                                                   including how many and who’s
                                                                   watching, how long they’re
                                                                   watching for and where.

                                                                   Plus the latest data on number
                                                                   of screens and BVOD
                                                                   (Broadcaster Video On
                                                                   Demand)

Published March 2020 – all data based on January – December 2019
FAST FACTS NZ What you need to know about TV Viewing - Published March 2020 - Think TV
N E W Z EA L A N D T V V I E W I N G – T H E FAC T S

• Every week TV reaches 3.2 million (73% of New Zealanders 5+)

• Every day TV reaches 2.4 million (55% of New Zealanders 5+)

• 95% of New Zealand homes (1,755,000) have a television

• New Zealanders spend 2 hours 16 minutes per day watching TV

• 89% of TV is watched Live

• 1.3 million New Zealanders access BVOD in a typical week

Sources: Nielsen Television Audience Measurement 2019, Nielsen Consumer and Media Insights 2019
FAST FACTS NZ What you need to know about TV Viewing - Published March 2020 - Think TV
N E W Z EA L A N D T V V I E W I N G – K E Y Y EA R O N Y EA R T R E N D S

• Linear TV reaches more Household Shopper with Kids on a typical day
   (Average daily reach 58.9% versus 57.4%)

• Household Shoppers with Kids are spending more time watching Linear TV
   (2 hours 25 minutes versus 2 hours 19 minutes per day)

• 14% more NZ homes have Connected TV’s and there is an increase in the number of
  screens (see Slide 16)

• The percentage of Linear TV watched Live - 89% - has not changed

• The number of New Zealanders watching Linear TV per day remains at 2.4 million, while
  daily viewing of people aged 25-54 remains at over 1 million

Sources: Nielsen Television Audience Measurement 2019 versus 2018, Nielsen Consumer and Media Insights 2019 versus 2018
FAST FACTS NZ What you need to know about TV Viewing - Published March 2020 - Think TV
LINEAR TV
PENETRATION
 AND USAGE
FAST FACTS NZ What you need to know about TV Viewing - Published March 2020 - Think TV
THE NEW ZEALAND LINEAR TV AUDIENCE –
T H E FAC T S

• 25-54 year-olds make up 40% of the average audience
   • Over 1 million (52%) of this core demographic are reached by TV in a typical day
   • They spend 2 hours 8 minutes watching TV per day

• 8 out of 10 Household Shoppers with Children can be reached by TV in a typical week
   • This group watch 2 hours and 25 minutes of TV per day

• Over half a million New Zealanders aged 18-39 watch TV every day

Source: Nielsen Television Audience Measurement January – December 2019
FAST FACTS NZ What you need to know about TV Viewing - Published March 2020 - Think TV
HOW MANY NEW ZEALANDERS WATCH LINEAR TV?
 HOW MANY NEW ZEALANDERS WATCH LINEAR TV?

                                                                                                                                                         2.4 million New Zealanders in a day
                                                                                                                                                         55% of the population

                                                                                                                                                         3.2 million New Zealanders in a week
                                                                                                                                                         73% of the population

                                                                                                                                                         3.7 million New Zealanders in a month
                                                                                                                                                         85% of the population

Source: Nielsen Television Audience Measurement (Base: All People 5+, Consolidated, Jan-Dec 2019, All Day, Average Cumulative Reach (daily/weekly/monthly))
FAST FACTS NZ What you need to know about TV Viewing - Published March 2020 - Think TV
WHO’S WATCHING LINEAR TV?
   Profile of Viewers (% of viewing in each age/gender demographic)

                                                                           5-24      25-39       40-54        55-64   65-74   75+

                                        11.9                                                           10.3                           13.2

                                        17.6                                                           19.1                           16.3

                                        20.1                                                           20.1                           20.1

                                        25.4                                                           24.8                           26

                                        14.4                                                           13.9                           14.9

                                        10.6                                                           11.9                           9.6

                                       TOTAL                                                       MALES                            FEMALES

Source: Nielsen Television Audience Measurement (Base: All People 5+, Sample, Jan-Dec 2019, All Day)
FAST FACTS NZ What you need to know about TV Viewing - Published March 2020 - Think TV
HOW MANY PEOPLE DOES TV REACH IN A DAY?
     Average Daily Reach – Linear TV – By Key Demographics

                                                                                                                                         Main Household
                                                                     All People                           All People                                                    All People
                All Day Audience                                                                                                            Shopper
                                                                          5+                                25-54                                                         18-39
                                                                                                                                            with Kids

    Average Daily Reach                                             2,417,500                            1,004,400                              302,400                 528,100

    Average Daily Reach (%)                                              55.1                                 52.4                                  58.9                  37.8

Source: Nielsen Television Audience Measurement (Base: All People 5+, 25-54, Main HH with child, 18-39, Consolidated, All Day, Jan-Dec 2019, Average Daily Cume Reach
HOW MANY PEOPLE DOES TV REACH IN A WEEK?
     Average Weekly Reach – Linear TV – by Key Demographics

                                                                                                                                          Main Household
                                                                       All People                           All People                                                   All People
                 All Day Audience                                                                                                            Shopper
                                                                            5+                                25-54                                                        18-39
                                                                                                                                             with Kids

    Average Weekly Reach                                              3,218,300                           1,365,000                             411,700                  812,000

    Average Weekly Reach (%)                                               73.3                                 73.7                                80.1                   58.2

Source: Nielsen Television Audience Measurement (Base: All People 5+, 25-54, Main HH with child, 18-39, Consolidated, All Day, Jan-Dec 2019, Average Weekly Cume Reach
HOW LONG DO THEY SPEND WATCHING?
     Time spent per day – Linear TV – by Key Demographics

                                                                                                                                  Main Household
                                                                 All People                         All People                                                          All People
                                                                                                                                     Shopper
                                                                      5+                              25-54                                                               18-39
                                                                                                                                     with Kids

     Time spent viewing
     per day (hh:mm)                                                  2:16                                2:08                                 2:25                       1:15

Source: Nielsen Television Audience Measurement (Base: All People 5+, 25-54, Main HH with child, 18-39, Consolidated, All Day, Jan-Dec 2019, Average Daily Cume Reach
HOW WE WATCH TV
H O W W E WAT C H T V - T H E FA C T S

• 89% of all Linear TV viewing is live

• An average New Zealand home has 7.5 screens; the number of Connected TV’s has increased by 14%
  compared to last year

• New Zealanders spend around 16 ½ hours per week watching Linear TV and just under 7 hours
  watching TV/Video content online

• Of the most popular programmes among 18-54 year-olds in 2019 on Linear TV, rugby dominated the
  top 10 spots. 21% of all New Zealanders watched the All Blacks vs England RWC semi-final

• 1.3 million New Zealanders access a NZ BVOD platform in a typical week

  Sources: Nielsen Television Audience Measurement, Nielsen Consumer and Media Insights
TELEVISION IS PREDOMINANTLY VIEWED LIVE

                                                                                                                            11.0%
                                                                                         89.0%

                                                                            Live                                      Timeshifted

Source: Nielsen Television Audience Measurement (Base: All People 5+, Consolidated, Jan-Dec 2019, All Day, % of Playback viewing)
MANY OPTIONS TO CONSUME TV
An average New Zealand home has more than 7 screens

                         1.7                                            2.5                                   1.1   2.2

                                                       TV        Mobile          Tablet         Desktop/Laptop

Source: Nielsen Consumer and Media Insights, 10+, Year ending Quarter 4 2019. Base = Main Household Shopper
9 5 % O F N Z H O M ES H AV E A T V ( A N Y T Y P E )
  And almost 4 out of 10 have a Connected TV (14% increase YOY)

                                                                                                                                                       95%
                TV (All)
                                                                                                                                                       95%

                                                                                                                                           77%
          Smartphone
                                                                                                                                                 81%

                                                                                                                                          75%          2018
             PC/Laptop
                                                                                                                                          76%          2019

                                                                                                     45%
                 Tablet
                                                                                                       46%

                                                                                   34%
         Connected TV
                                                                                           39%

Source: Nielsen Consumer and Media Insights, 10+, Year ending Quarter 4 2019, Yeah ending Quarter 4 2018. Base = Main Household Shopper
M O ST T I M E S P E N T WATC H I N G L I N EA R T V
     More time is spent watching Linear TV in a typical week (hh:mm)

                                                                     16:24

                                                                                                                                                       06:47

                                               Time spent watching Linear TV on a TV Set                              Time spent watching any TV/Video online on any device*

Source: Nielsen Television Audience Measurement All People 10+, Consolidated, Jan-Dec 2019, All Day
*Source: Nielsen Consumer and Media Insights, 10+, Year ending Quarter 4 2019. Time spent watching TV/video/movies online on: PC/Laptop, Mobile, SmartTV/TV that connects to the internet, Tablet in the last 7 days
CO-VIEWING
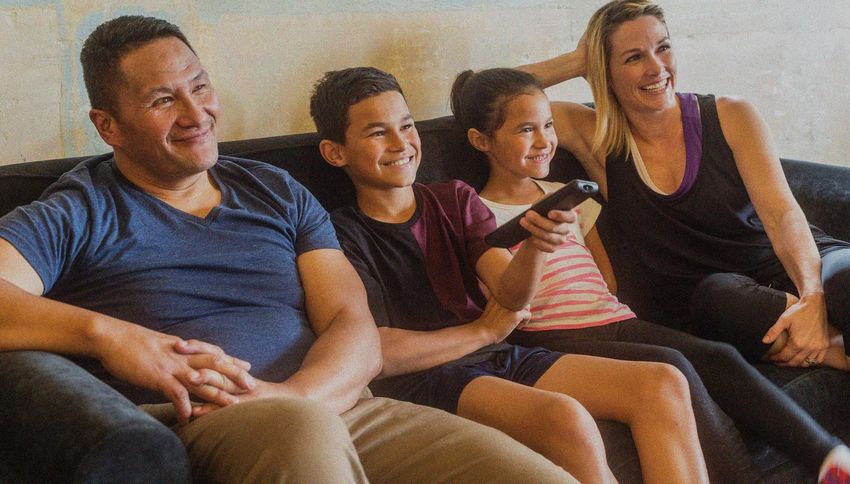
J U ST OV E R H A L F O F P EA K T I M E V I E W I N G I S CO - V I E W I N G
     (Viewing with others)

                                                                Solus viewing   Co-viewing
                                                                          49%    51%

Source Nielsen Television Audience Measurement 2019 Peak time = 1800 - 2230
CO - V I E W I N G I S H I G H EST D U R I N G T H E CO R E E V E N I N G
        FA M I LY V I E W I N G T I M E ( 1 9 3 0 - 2 1 0 0 )

                                                      % of co-viewing by daypart

                    1930-2100                                                              52%

           Peak (1800-2230)                                                               51%

                    1800-2400                                                            50%

                         All Day                                                   42%

Source Nielsen Television Audience Measurement 2019
TOP PROGRAMMES
MOST POPULAR PROGRAMMES IN 2019 – INCLUDING ONE-OFF EVENTS
     Top 20 Programmes including sport and one-off shows – Linear TV – All People 18-54
                    RANK                               PROGRAMME                                           CHANNEL      AUD%    NO. OF EPISODES
                      1                    Rugby World Cup 2019 Semi Final 1                                TVNZ 1*      21.4          1
                      2                        Rugby World Cup 2019 Final                                   TVNZ 1*      12.2          1
                      3                          Patrick Gower: On Weed                                      Three*       9.8          2
                      4                    Rugby World Cup 2019 Semi Final 2                                TVNZ 1*       9.6          1
                      5                      Rugby World Cup 2019 Delayed                                   TVNZ 1*       9.3          4
                      6                Rugby World Cup 2019 Bronze Final Delayed                            TVNZ 1*        9           1
                      7                Rugby World Cup 2019 Quarter Final Delayed                           TVNZ 1*       8.9          2
                      8                     International Rugby Bledisloe Cup                             SKY Sport 1     8.4          1
                      9                            Married At First Sight                                    Three*       8.1          41
                     10                 Rugby World Cup 2019 Opening Ceremony                               TVNZ 1*        8           1
                     11                            Elvis All-Star Tribute                                   TVNZ 1*       7.6          1
                     12                           The Block NZ Firehouse                                     Three*       7.5          48
                     13                           Dancing With The Stars                                     Three*       7.3          19
                     14                                Highway Cops                                         TVNZ 1*       7.2          4
                     15                              My Kitchen Rules                                       TVNZ 2*       7.2          50
                     16                              Shortland Street                                       TVNZ 2*       7.1         235
                     17                             Leaving Neverland                                       TVNZ 1*       7.1          2
                     18                                   1 News                                            TVNZ 1*        7          366
                     19                             Crocodile Dundee                                        TVNZ 2*        7           1
                     20                                Lego Masters                                          Three*       6.8          9

Target: All People 18-54 Average combined episodes - 1 January to 31 December 2019; All Day (2am – 2am)
TVNZ 1* = TVNZ 1 and TVNZ 1 +1; TVNZ 2* = TVNZ 2 and TVNZ 2 + 1; Three* = Three and Three Plus 1
MOST POPULAR PROGRAMMES IN 2019 – EXCLUDING ONE-OFF EVENTS
     Top 20 Programmes – excluding sport and one-off shows – Linear TV – All People 18-54
                    RANK                                  PROGRAMME                                       CHANNEL    AUD%   NO. OF EPISODES
                      1                                Married At First Sight                               Three*    8.1          41
                      2                               The Block NZ Firehouse                                Three*    7.5          48
                      3                               Dancing With The Stars                                Three*    7.3          19
                      4                                   Highway Cops                                     TVNZ 1*    7.2           4
                      5                                 My Kitchen Rules                                   TVNZ 2*    7.2          50
                      6                                  Shortland Street                                  TVNZ 2*    7.1         235
                      7                                       1 News                                       TVNZ 1*     7          366
                      8                                    Lego Masters                                     Three*    6.8           9
                      9                             Hyundai Country Calendar                               TVNZ 1*    6.7          41
                     10                                      Dog Squad                                     TVNZ 1*    6.7           4
                     11                             Celebrity Treasure Island                              TVNZ 2*    6.7          18
                     12                                     Police Ten 7                                   TVNZ 2*    6.1          40
                     13                                     Wentworth                                      TVNZ 2*     6           10
                     14                                    Lost & Found                                     Three*    5.9           8
                     15                              Travel Guides (Australia)                             TVNZ 2*    5.9          11
                     16                                       Big Cats                                     TVNZ 1*    5.9           2
                     17                            Grand Designs New Zealand                                Three*    5.9           8
                     18                                    Border Patrol                                   TVNZ 1*    5.9          10
                     19                              Married At First Sight NZ                              Three*    5.7          17
                     20                                  Motorway Patrol                                   TVNZ 2*    5.7          11

Target: All People 18-54 Average combined episodes - 1 January to 31 December 2019; All Day (2am – 2am)
TVNZ 1* = TVNZ 1 and TVNZ 1 +1; TVNZ 2* = TVNZ 2 and TVNZ 2 + 1; Three* = Three and Three Plus 1
NZ BROADCASTER
VIDEO ON DEMAND
1.3 million
                                         New Zealanders access
                                         a NZ BVOD* platform
                                         every week

Source: Nielsen Consumer and Media Insights, Year ending Q4 2019. *NZ BVOD = TVNZ On Demand; ThreeNow; Bravo TV; Freeview;
SkyGO; Sky Fan Pass; Choice TV On Demand; Maori Television On Demand
NZ BVOD PLATFORMS* REACH HIGH VALUE AUDIENCES
    Accessed NZ BVOD in last 7 days – audience demographics

                                                                          All People                           Household Shopper
                                                                                                                                   Homeowners
                                                                            25-54                                  with Kids

            Accessed last 7 days                                          671,000                                       393,000     774,000

            Accessed last 7 days (%)                                          56%                                          57%       57%

Source: Nielsen CMI Year ending Q4 2019 – Base: Used Online/TV Video service in last 7 days
*NZ BVOD: TVNZ On Demand; ThreeNow; Bravo TV; Freeview; SkyGO; Sky Fan Pass; Choice TV On Demand; Maori Television On Demand
GLOSSARY
KEY TERMS AND DEFINITIONS
 TERM                     DEFINITION                                                                                                                     NOTES
As Live                  Viewing of recorded television broadcast content that occurs within the same research
                         day (2am-2am) but viewed at a later time than the original broadcast time; for example,
                         pausing a program and then continuing to watch it as a recording

Average Daily Reach      The sum of the number of unique viewers who have seen at least one minute of an            An individual or household is only counted
(000’s or %)             event or time band across the day, averaged across a period of time (days).                once per day if they have viewed at least
                                                                                                                    one minute of the event or time band

AUD%                     The average viewing audience for a demographic expressed as a percentage of the            = Audience / Universe Estimate
                         relevant Universe Estimate
                         Also known as TARP (Target Audience Rating Point)
Audience or AUD (000s)   The average number of people (or homes) in a target market who were watching a             = sum of people watching each minute of
                         specific event or time band each minute, expressed in absolute figures for that            the show or time band / sum of minutes
                         demographic
Connected TV             A TV set that is connected to the internet, allowing viewers to not only watch Linear or
                         Broadcast TV but also watch Video on Demand etc
Consolidated Data:       Nielsen’s final ratings incorporating ‘Live’ viewing and viewing of broadcast content      Consolidated 7 = 'Live' + 'As Live' + 'Time
Consolidated 7           that is played back through the television set at normal speed either within seven         Shift to 7'
                         days of original broadcast ('Consolidated 7')
Demographic (group) or   Basic descriptor of individuals or households using classifications such as age, sex,
Target                   occupation group, education level, household size, etc
Linear TV                TV received via aerial, satellite or cable is Linear TV i.e. any TV that is not viewed
                         over the internet. Sometimes referred to as Broadcast TV, it can be watched as
                         Live TV or time-shifted as Playback TV
Live                     Viewing of a television program as it is actually broadcast
Main HH Shopper          Person aged 18 or older who has primary household shopping responsibilities

                                                                                 28
KEY TERMS AND DEFINITIONS
 Term                                   Definition                                                                                          Notes
Overnight Data                         Nielsen ratings delivered each morning for the previous research day, incorporating ‘Live’          ‘Live’ + ‘As Live’ viewing
                                       viewing and viewing of content that was broadcast yesterday, recorded and played back by
                                       2am (‘As Live’ viewing)
Profile%                               Shows the audience composition of an event or time band by calculating the proportion of            = Audience of target group of interest / Total
                                       viewers in the target demographic to the number of viewers in the base target (usually              People Audience
                                       Total People)
Reach OR Reach (1 min) OR Cumulative   The sum of the number of unique viewers who have seen at least one minute of an event or            An individual or household is only counted
(Cume) Reach                           time band across its total duration                                                                 once if they have viewed at least one minute
                                                                                                                                           of the event or time band

Reach%                                 The sum of unique viewers expressed as a percentage of the universe for the target demographic = Reach / Universe Estimate

Research Day                           2am – 2am on any calendar day
Sample Size                            The panel size for any specific demographic
TARP (Target Audience Rating Point)    The average viewing audience for a demographic expressed as a percentage of the relevant            = Audience / Universe Estimate
                                       Universe Estimate
Timeshifted                            Linear TV recorded on a Personal Video Recorder (PVR), VCR or other form of time-shifting
                                       technology and watched after the live broadcast. Also referred to as Playback TV. Can be viewed
                                       up to 7 days from broadcast
Time Spent Viewing / Demo              Of the total number of people in the target market (potential audience), the number of minutes      = (Audience / Universe Estimate) x Event
                                       each person viewed of a specific event. This variable considers the potential of the target, even   Duration
                                       if many individuals in the target audience did not watch the event being analysed
Time Spent Viewing / Viewer            The average number of hours or minutes each individual has seen of the program or time              = (Audience / Reach) x Event Duration
                                       band being analysed compared to the total number of people in the target audience. Each
                                       individual must have watched at least 1 minute of the event to be counted
Total TV                               The Total Audience viewing across all of the TV channels that are broadcasted and measured
                                       by Nielsen – includes Live and Consolidated

                                                                                         29
You can also read