Q1 FY2021 - Investor Relations
←
→
Page content transcription
If your browser does not render page correctly, please read the page content below
Q1 FY2021

VISION

       TRANSFORMATIVE
TO BE THE
PARTNER FOR OUR CUSTOMERS, A
POSITIVE FORCE IN OUR
COMMUNITIES AND EARN
EXCEPTIONAL RETURNS

                               2
NET SALES OF
                     $2.9 BILLION
                     TTM 08/31/20

7,500   4,500   52     6
                                    3
BROAD MANUFACTURING FOOTPRINT
                          52 OPERATING LOCATIONS AS OF 08/31/20

 STEEL PROCESSING
 PRESSURE CYLINDERS
 JOINT VENTURES (50%)

 UPDATED SEPTEMBER 2020

                                                                  4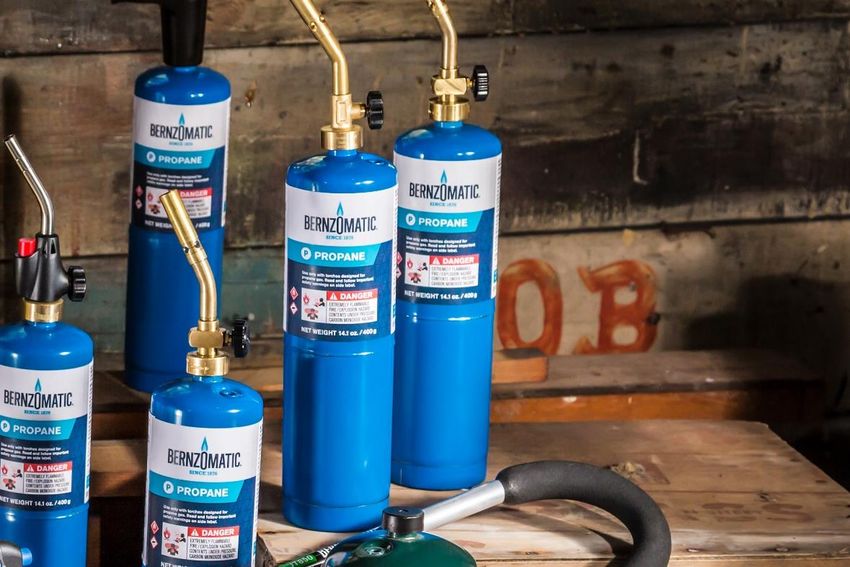
MANUFACTURED

                                   83MM
                               •
                                   CYLINDERS &
                               •
                                   ACCESSORIES
                                   (FY20) SOLD IN 90+ COUNTRIES

                               •

                               •

                               •

                               •

                               •

                               •
LARGEST PURCHASER OF FLAT
ROLL STEEL BEHIND AUTOMAKERS

                                                                  5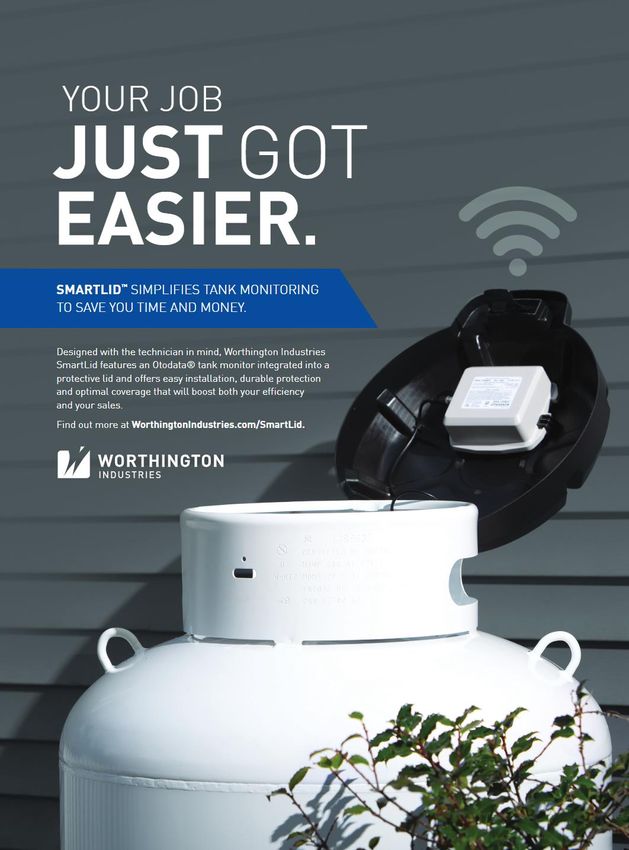
$2.9B TRAILING 12 MONTH NET SALES

      NET SALES BY END-MARKETS                       OPERATING/EQUITY INCOME BY SEGMENT TTM*
                                                     $210.5 MILLION

              18%            17%                                                   34%
                                   4%
                                    3%
        13%                         4%
                                                              26%
                                   9%
                                                                                                 40%

                       32%

 Automotive                   Construction
 Industrial                   Consumer Products           Steel        Cylinders           WAVE / Other / JVs
 Agriculture                  Heavy Truck
 Oil & Gas Equipment          Other               * Excludes restructuring and impairment, $23.1M gain related to the sale of WAVE’s
                                                  foreign assets in Q2 FY20, and $49.5M expense related to NKLA gain in Q1 FY21.
                                                                                                                                       6
$703M Q1 SALES

     NET SALES BY END-MARKETS                  OPERATING/EQUITY INCOME BY SEGMENT QTD*
                                               $54.8 MILLION

               18%
                                                                               34%
                       19%

       11%
                             5%
                                                          28%
                               3%
                              3%
                             4%                                                        38%
                 37%

Automotive              Construction
Industrial              Consumer Products           Steel         Cylinders          WAVE / Other / JVs
Agriculture             Heavy Truck
Oil & Gas Equipment     Other
                                            * Excludes restructuring and impairment and $49.5M expense related to NKLA gain
                                            in Q2 FY21.
                                                                                                                              7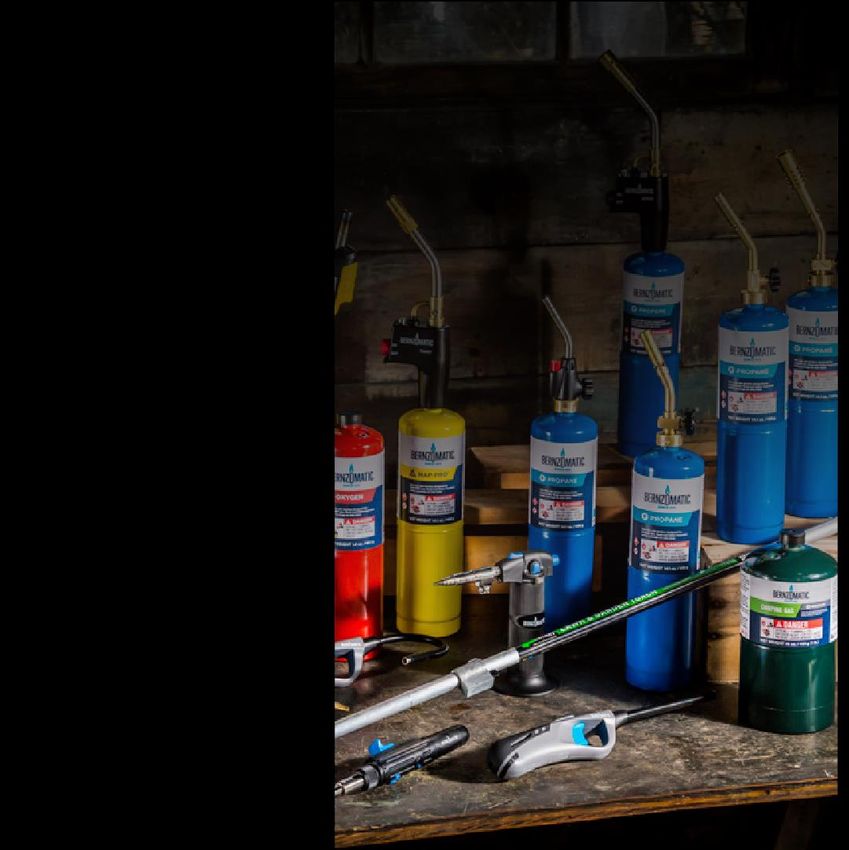
STEEL PROCESSING
PROFILE                                                                          AUTO

                                                                                                     SALES BY END MARKET
                                                                                                                 TTM 8/31/20 $1.8B

                                                        Wholly-Owned
                                                                              AGRICULTURE
                                                        Consolidated JVs
                                                        Unconsolidated JVs
                                                                                                                        Automotive
                                                                                                                           53%
                                                25 FACILITIES
                                                   in North America
                                           (8 wholly owned / 17 JV Owned)

   CORE PRODUCTS                                                                                    Other
                                                                             CONSTRUCTION           15%

  Carbon flat rolled steel processing - Broad range of metal
  products in sheet, coil and strip configurations, as well as a                                                            Construction
  number of processing capabilities from specialty coatings                                                                    20%
  and annealing, to pickling, slitting and blanking.                                        Heavy Truck
  Tailor welded products – Offering tailored products for                                      5%
                                                                                                          Agriculture
  lightweight and safety critical components through 55%                                                      7%
  owned JV (TWB). Capability to process multiple types of
                                                                              HEAVY TRUCK
  materials offering tailored blanks, tailor welded coils,
  aluminum tailor welded blanks, and hot formed tailor welded
  blanks.
                                                                                                                                           8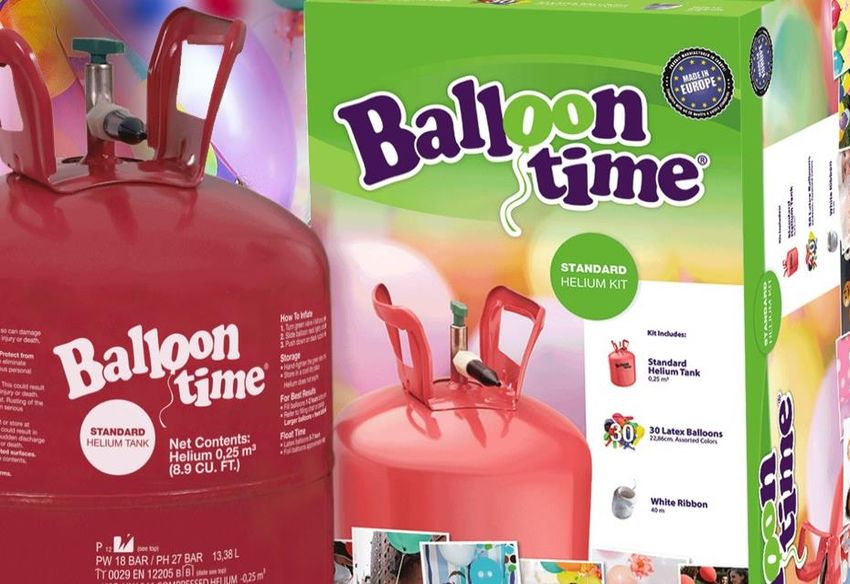
PRESSURE CYLINDERS
PROFILE
                                                                               SALES BY SBU
                                                                                TTM 8/31/20 $1.1B

                                                                                 Industrial Products
                                       16 FACILITIES                                    47%
                                     in North America and Europe

                                                                   Oil & Gas
                                                                   Equipment
                                                                       8%

   CORE PRODUCTS
                                                                                 Consumer Products
                                                                                       45%
  Industrial Products - Broad line of pressure cylinders
  and cryogenic vessels, tanks and trailers for industrial
  gas storage and transportation
  Consumer Products – Market-leading brands with
  products for jobsite, home and outdoor activities
  Oil & Equipment - Custom solutions for energy storage,
  processing and transportation
                                                                                                       9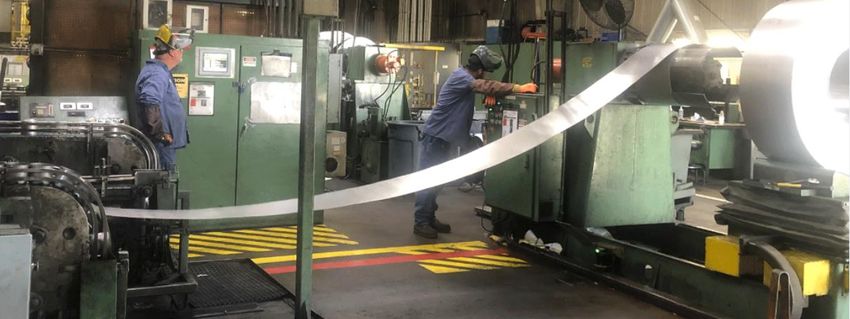
WAVE   (50% JV)
PROFILE                                                                     CONTRIBUTION TO WI EQUITY INCOME ($M)

                                                                                                                                 $78
                                                                                                                  $71

                                                                                                   $54

                                                                                    $33

                                                6 facilities
                                               in North America
                                                                                   FY05           FY10           FY15           FY20

                                                                              * FY20 excludes the $23.1M gain related to the sale of WAVE’s
                                                                              foreign assets
   CORE PRODUCTS                    MARKETS

 Sustainable revenue and EBITDA                                                                      OVER
 growth with creative fabricated
                                            Product               Price
 architectural metal components,
 focusing on superior customer value,
                                                                                             $800M
                                                                                          in dividends paid
 industry leading manufacturing, and
 talent development resulting in low cost   Operations            Service            to Worthington in past 10 years
 construction and enterprise efficiencies                                                since start of FY 2011

                                                                                                                                        1 0
GROWTH
STRATEGY
Working together using technology, analytics
and automation enables us to deliver…
Successful innovation, transformation,
and acquisitions that drive value
for customers and earn exceptional returns for
our shareholders.
All with Our Philosophy at the center.
1 1COMPLEMENTARY VALUE
DRIVERS ARE WELL ESTABLISHED
TRANSFORMATION INNOVATION ACQUISITIONS
Broad based business system Innovation as a discipline: Focus on the core:
focused on:
• New product development • Consolidate higher value add markets
• Data-driven decision making
• Product design & engineering • Build out product offerings with
• Optimizing value streams and adjacencies
eliminating waste • Voice of customer & market research
• Target industries/sectors we know
• Discovering new capabilities through • Incorporating advanced technologies
agile teams • Focus on higher margin / high cash
flow businesses
• One system, driven by everyone, not
just a central tiger team • Strong target evaluation process, due
diligence and integration to achieve
synergies
1 2VALUE DRIVERS IN ACTION: TRANSFORMATION
Data driven LEAN events to improve our businesses
Example of Transformation project at cylinder facility
conducted during pandemic
Issue: Strong demand for Coleman® and Bernzomatic® camping gas
tanks required transformation efforts to increase production in order to
meet customer demand
What we did to drive improvements:
✓ Utilized data analytics from smart factory software to identify
WHAT WE ACHIEVED:
greatest opportunity for production improvements
47%
✓ Identified coil change over time at presses as best opportunity Reduction in average coil
✓ Improved collaboration and implemented standard work across changeover time
all 3 shifts 500K
✓ Employed special safety measures including physical distancing Annual increase in
and virtual participants demonstrating the power of cylinder production
transformation even during the pandemic capacity
4:55 2:37
✓ Instilled transformational culture with local team empowering minutes minutes
them to drive future productivity improvements
Pre-Event Post-Event
1 3VALUE DRIVERS IN ACTION: INNOVATION
Applying innovation to enable our customers to operate more efficiently
SmartLid Monitoring Solution
• Need for real time monitoring of propane fuel levels in tanks identified
• Collaborated with Otodata, industry leader in remote monitoring, to develop and
launch lid with gas level monitor housed underneath a protective system & heating
tank lid
• Enables remote monitoring of propane fuel levels which helps gas marketers to more
efficiently deploy propane filling trucks to optimal locations
• SmartLid provides easy installation, a monitor that’s protected from the elements, and
reliable signal strength, which takes this solution a step beyond what currently exists in
the market
• Drives value for customers by providing reliable connectivity to products that have
traditionally been offline
“[Monitoring] saves us money in the long run,
and really helps with routing customers.”
- WOR customer in the Pacific Northwest Territory
Ad promoting the SmartLid in LPGas Magazine
1 4VALUE DRIVERS IN ACTION: M&A
Pressure Cylinders has experienced meaningful earnings growth over the past 10 years driven by 16 acquisitions
CYLINDERS SALES ($M) CYLINDERS OPERATING INCOME* ($M)
$1,115
$1,001 $71
$58
$468 $30
2010 2015 08/31/20 TTM
2010 2015 08/31/20 TTM
*excludes restructuring and non-recurring charges.
1 5F IN A N CIA L G O A L S
• GROW EBITDA & FREE CASH FLOW EVERY YEAR
• 10%+ RETURN ON CAPITAL
• RAISE MARGINS
• REDUCE EARNINGS VOLATILITY
• BALANCED CAPITAL ALLOCATION
• MODEST LEVERAGE / AMPLE LIQUIDITY
(INVESTMENT GRADE)
• RIGOROUS CAPITAL DISCIPLINE
1 6STRONG CAPITAL STRUCTURE & LIQUIDITY
Strong balance sheet with investment grade credit ratings and significant liquidity available enables financial
flexibility and shareholder returns
600
500
400
$ Millions
300
$500
200
$250
100 $200
$150
$36 $36 $38
0
2020 2021 2022 2023 2024 2025 2026 2027 2028 2029 2030 2031 2032 2033 2034
Revolver*
Debt Maturity
FLOATING
RATE L+1.25%
Private € Private € Private € Private
FIXED Public Bond Public Bond
Placement Placement Placement Placement
RATE 4.55% 4.30%
4.60% 1.56% 1.82% 1.90%
*Revolving Credit facility undrawn as of 08/31/20
1 7BALANCED
CAPITAL ALLOCATION STRATEGY
Strong cash flows and significant liquidity support balanced approach to capital
allocation focused on growth and rewarding shareholders
OVER $3 BILLION OF CAPITAL
DEPLOYED OVER PAST 10 YEARS
✓ Reinvest in the business to create value and support
CAPITAL growth ($ millions)
EXPENDITURES ✓ FY2020 CapEx of $95.5 million $1,015
$924
✓ Focus on core businesses and selectively grow into
new markets $687
ACQUISITIONS
✓ Focus on higher margin / high cash flow businesses
$439
✓ Dividend paid quarterly since becoming a public
DIVIDENDS company in 1968
✓ Ten consecutive years of dividend increases
✓ Opportunistic approach has reduced share count
Capital Acquisitions Dividends Share
SHARE 33% over past 10 years since start of FY 2011 Expenditures Repurchases
REPURCHASES ✓ 6.2 million shares remaining on current authorization
GROWTH REWARDING
SHAREHOLDERS
*Information based on financials from FY 2011 to FY 2020
1 8CONSOLIDATED RESULTS
$ millions, except EPS FY2019 FY2020 3M FY2020 3M FY2021
Sales $3,760 $3,059 $856 $703
Adjusted EBITDA* $330 $300 $78 $75
% of sales 8.8% 9.8% 9.1% 10.7%
Operating Income* $142 $115 $26 $31
% of sales 3.8% 3.8% 3.1% 4.4%
EPS* $2.60 $2.39 $0.62 $0.64
Avg Invested Capital $1,628 $1,532 $1,563 $1,572
ROIC (Adj. EBIT/Avg. Inv. Cap.) 14.4% 13.6% 13.8% 13.5%
Inventory Holding Gains / (Losses)
($4) ($20) ($8) ($7)
Impact
EPS Impact ($0.06) ($0.27) ($0.11) ($0.09)
*Adjusted for restructuring and non-recurring items. See supplemental data schedules in appendix for reconciliation of adjustments.
1 9KEY INVESTMENT HIGHLIGHTS
Worthington offers an attractive investment opportunity
• Growth strategy focused on value drivers of innovation,
transformation and acquisition to enhance margins
• Solid free cash flow and ample liquidity to execute on
strategy
• Rigorous capital discipline focused on high cash flow
investments
• Balanced approach to capital allocation focused on
investing for growth and rewarding shareholders
• Positioned to emerge from COVID-19 well capitalized and
as a stronger company
2 0SUPPLEMENTAL DATA
2 1SUPPLEMENTAL DATA
CONSOLIDATED ADJUSTED EBITDA / FREE CASH FLOW
FY19 FY20 FY20 FY21
Annual Annual 3M 3M
Net Income $ 153.5 $ 78.8 $ (4.8) $ 612.6
Interest Expense 38.1 31.6 9.5 7.6
Taxes 43.2 26.3 (0.2) 163.3
EBIT $ 234.7 $ 136.8 $ 4.5 $ 783.5
D&A 95.6 92.7 24.2 22.2
EBITDA $ 330.3 $ 229.4 $ 28.7 $ 805.8
Restructuring and non recurring* (0.8) 70.8 49.3 (730.5)
EBITDA Adjusted $ 329.5 $ 300.3 $ 78.0 $ 75.3
Stock based compensation 11.7 11.9 4.0 4.9
Undistributed JV earnings 7.3 8.1 5.1 (6.8)
Interest Expense (38.1) (31.6) (9.5) (7.6)
Income taxes (25.7) (27.7) (3.3) (92.3)
Net (gain) loss on sale of assets (7.1) (5.1) 0.6 0.4
Minority interest 9.8 5.6 2.3 2.1
Change in working capital (98.9) 58.7 (8.4) 176.4
Other 9.3 16.5 (4.5) (35.0)
Cash Flow from Operations $ 197.9 $ 336.7 $ 64.4 $ 117.4
Capital spending (84.5) (95.5) (22.2) (32.9)
Free Cash Flow $ 113.4 $ 241.2 $ 42.2 $ 84.5
*FY21 3M adjusted for net gain of $747M related to NKLA and restructuring charges of $12M 2 2SUPPLEMENTAL DATA CONSOLIDATED ADJUSTED OPERATING INCOME / EPS
$ millions, except EPS FY2019 FY2020 3M FY2020 3M FY2021
Operating Income $145 $22 ($15) ($35)
Restructuring and non recurring* (3) 93 $41 $66
Operating Income Adjusted $142 $115 $26 $31
EPS $2.61 $1.41 ($0.08) $11.22
Restructuring and non recurring* (0.01) 0.98 0.70 (10.58)
EPS Adjusted $2.60 $2.39 $0.62 $0.64
FY2019 reflects a pre-tax restructuring gain of $3 million ($0.01/share). FY2020 adjusted EPS reflects $93M ($1.29/share) in pre-tax restructuring and non-recurring charges as well
as a $23M gain ($0.31/share) from the sale of WAVE’s foreign assets. 3M FY20 reflects pre-tax restructuring and non-recurring of $49.3 million ($0.70/share). 3M FY2021 reflects
$735M ($10.58/share) in pre-tax restructuring and non-recurring income, which consists of a $796M gain related to our Nikola shares, partially offset by $12M in restructuring and
$49M in expenses related to gains on NKLA.
2 3S T E E L P R O C E S S I N G
FINANCIALS
$ millions
FY2019 FY2020 3M FY2020 3M FY2021
Sales $2,436 $1,860 $523 $431
Adj. EBITDA* $122 $79 $14 $23
% of sales* 5.0% 4.3% 2.6% 5.4%
Operating Income* $93 $46 $6 $15
excl. Restructuring
% of sales 3.8% 2.5% 1.2% 3.5%
Capital Expenditures $39 $41 $8 $15
Avg Invested Capital $550 $512 $538 $535
ROIC* (Adj. EBIT/Avg. Inv. Cap.) 14.8% 7.5% 0.7% 2.4%
Volume (000s tons) 3,715 3,831 891 928
Steel Price (HRC/ton), period average $783 $547 $564 $475
Inventory Holding Gains / (Losses)
($4) ($20) ($8) ($7)
Impact
*excludes restructuring and non-recurring charges
2 4P R E S S U R E C Y L I N D E R S
FINANCIALS
$ millions FY2019 FY2020 3M FY2020 3M FY2021
Sales $1,208 $1,148 $304 $271
Adj. EBITDA* $105 $124 $41 $29
% of sales* 8.7% 10.8% 13.4% 10.5%
Operating Income*
$63 $81 $30 $19
excl. Restructuring
% of sales 5.3% 7.1% 9.7% 7.0%
Capital Expenditures $38 $41 $7 $11
Avg Invested Capital $879 $869 $876 $824
ROIC (Adj. EBIT*/Avg. Inv. Cap.) 7.2% 9.4% 3.4% 2.3%
Volume (000s units) 83,787 82,520 20,184 21,743
*excludes restructuring and non-recurring charges.
Note: FY2019 results were negatively impacted by a $13 million charge related to a tank replacement program in Q3 which is included in the numbers above.
FY2020 results were positively impacted by $13M by $13 million in Q1 due to the early cancellation of a customer take-or-pay contract which is included in the numbers above.
2 5SUCCESSFUL
JOINT VENTURES
Serving automotive and construction end markets
OVER • Successful JV portfolio built with trusted partners who help make a
$1.0B
business better versus the alternative of going solo
• JVs managed to produce regular cash dividends that closely
approximate earnings
in dividends Business
Architectural and acoustical grid
Ownership Created
received WAVE
ceilings
50% 1992
Serviacero Steel processing in Mexico 50% 2007
from JVs in past 10 years since ArtiFlex Automotive tooling and stamping 50% 2011
start of FY 2011 Metal framing for commercial
ClarkDietrich 25% 2011
construction
2 6MEANINGFUL JV EARNINGS
Unconsolidated JVs managed to produce regular cash dividends that closely approximate earnings
DIVIDEND to WII
(CASH FLOW)
$ MILLIONS $160
EQUITY EARNINGS*
$140 *Excludes
Restructuring and
$120 $110 $113 Impairment Charges
$103 $101
$100 $96
$102 $101
$80 $90
$60
$40 $30
$24
$20 $29
$17
$0
2017 2018 2019 2020 3M FY20 3M FY21
Equity Earnings $ MILLIONS
WAVE (50%) $78.3 $77.5 $82.3 $78.0 $23.9 $17.7
ClarkDietrich (25%) $17.3 $9.8 $8.6 $17.2 $4.1 $4.9
Servicero (50%) $7.2 $8.8 $8.1 $1.3 $0.8 $1.3
Artiflex (50%) $7.0 $4.9 $2.0 $2.7 $0.2 ($0.1)
Other $0.2 $2.1 $0.1 ($3.2) $0.1 ($0.1)
Total Equity Earnings $110.0 $103.1 $101.1 $96.0 $29.1 $23.6
Note: FY19 dividends shown above exclude $60M received from WAVE related to a special dividend and cash proceeds from the sale of international operations. FY20 excludes $10M received from WAVE international proceeds.
FY19 Equity Earnings excludes a $4.0M impairment for CR Steel China JV and FY20 excludes a $4.3M impairment for CR Steel China JV and a $23.1M gain for the sale of WAVE’s foreign assets.
2 7CORPORATE CITIZENSHIP & SUSTAINABILITY
Long history of keeping employees safe, practicing good citizenship and protecting the environment
Fiscal Year 2020 Highlights
For more information on our Corporate Citizenship & Sustainability efforts, please see our first annual Corporate
Citizenship & Sustainability Report located on the “Governance” page of our Investor Relations website at
ir.WorthingtonIndustries.com
2 8CONTACT
SAFE HARBOR STATEMENT
Worthington Industries wishes to take advantage of the Safe
Harbor provisions included in the Private Securities Litigation
Reform Act of 1995 (the “Act"). Statements by the Company which
are not historical information constitute "forward looking
statements" within the meaning of the Act. All forward-looking
614.840.4663 statements are subject to risks and uncertainties which could
Marcus.Rogier@WorthingtonIndustries.com cause actual results to differ from those projected. Factors that
could cause actual results to differ materially include risks,
uncertainties and impacts described from time to time in the
Company's filings with the Securities and Exchange Commission,
including those related to COVID-19 and the various actions taken
in connection therewith, which could also heighten other risks.
2 9You can also read