Quickstep Holdings Limited - Investor Presentation 23 February 2021
←
→
Page content transcription
If your browser does not render page correctly, please read the page content below
Quickstep Holdings Limited

Investor Presentation

23 February 2021
DISCLAIMER
          This Presentation is provided by Quickstep Holdings        This presentation contains certain forward-looking           Financial Data
          Limited (“Quickstep” or the “Company”) as a                statements which have not been based solely on
          summary of the Company and its operations and for          historical facts but, rather, on Quickstep’s current         Investors should be aware that certain financial
          general information purposes only.                         expectations about future events and on a number of          measures included in this presentation are ‘non-IFRS
          This presentation is not a disclosure document and         assumptions which are subject to significant                 financial information’ under ASIC Regulatory Guide
          should not be considered as investment advice or an        uncertainties and contingencies, many of which are           230: ‘Disclosing non-IFRS financial information’
          offer or invitation to subscribe for or purchase any       outside the control of Quickstep and its directors,          published by ASIC and also ‘non-GAAP financial
          securities in Quickstep, or an inducement to make an       officers and advisors. Many factors could cause actual       measures’ within the meaning of Regulation G under
          offer or invitation with respect to such securities.       results, performance or achievements of the Company          the U.S. Securities Exchange Act of 1934, as
                                                                     to be materially different from these forward looking        amended, and are not recognised under AAS and
          This presentation does not purport to cover all relevant   statements including, amongst other things, changes in       International Financial Reporting Standards (IFRS).
          information about any potential investment in              general economic and business conditions, regulatory         The non-IFRS financial information / non-GAAP
          Quickstep. Accordingly, potential investors are            environment, exchange rates, results of advertising and      financial measures include EBITDA and EBIT. The
          advised to seek appropriate independent advice, if         sales activities, competition, and the availability of       Company believes the non-IFRS financial information
          necessary, to determine the suitability of any             resources and materials. Quickstep undertakes no             / non-GAAP measures provide useful information to
          investment. This presentation must not be relied on to     obligation to update these forward-looking statements        users in measuring the financial performance and
          make an investment or other financial decision and         for events or circumstances that occur subsequent to         conditions of the Company. The non-IFRS financial
          recipients should conduct their own investigations,        such statements or to keep current any of the                information / non-GAAP financial measures do not
          enquiries and analysis and place no reliance on this       information provided. Any estimates or projections as to     have a standardised meaning prescribed by AAS or
          presentation in evaluating any potential investment.       events that may occur in the future (including               IFRS. Therefore, the non-IFRS financial information is
                                                                     projections of revenue, expense, net income and              not a measure of financial performance, liquidity or
          To the maximum extent permitted by applicable laws,        performance) are based upon the best judgement of            value under the IFRS and may not be comparable to
          none of Quickstep or its related entities or their         Quickstep and there is no guarantee that any of these        similarly titled measures presented by other entities,
          employees, officers or advisers makes any                  estimates or projections will be achieved. Actual results    and should not be construed as an alternative to
          representation and none of them gives any                  will vary from the projections and such variations may       other financial measures determined in accordance
          assurance, guarantee or warranty, express or implied,      be material. Quickstep has no obligation to tell             with AAS or IFRS. Investors are cautioned, therefore,
          as to, and none of them takes any responsibility or        recipients if it becomes aware of any inaccuracy in or       not to place undue reliance on any non-IFRS
          assumes liability (including in negligence) for the        omission from the information in this presentation.          financial information / non-GAAP financial measures
          authenticity, validity, accuracy, suitability or                                                                        included in this presentation.
          completeness of, or any errors in or omissions from, any   Other than for the pictures of the Quickstep facilities
          information, statement or opinion contained in this        and machinery, the assets featured in the pictures in this
          presentation.                                              presentation are not assets of the Company.

                                                                     By accepting this presentation, you acknowledge and
                                                                     agree to be bound by each of the foregoing
                                                                     statements.
                                                                                                                                                                                2
Slide 2
YOUR PRESENTERS

                      MARK BURGESS                              ALAN TILLEY
                      CEO & Managing Director                   Chief Financial Officer

                      Joined Quickstep in May 2017              Joined Quickstep in June 2018
                      Global aerospace and defence              Previously with Brambles, NRMA and
                      experience                                Murray Goulburn (interim)
                      Previously with Honeywell & BAE Systems   Multi-sector experience spanning
                      Extensive experience in Europe, USA,      manufacturing, B2B services and
                      Middle East and Asia Pacific              FMCG in Australia and Europe
                                                                Broad experience spanning P&L
                                                                responsibility, Finance, Treasury,
                                                                Technology and Risk

                                                                                                3
Slide 3
OUR FOCUS

     Aerospace Composites

          Defence Aerospace   Commercial Aerospace   Aftermarket Services   Other Advanced Sectors

Slide 4
CUSTOMER & PLATFORM

    Portfolio

                          5
Slide 5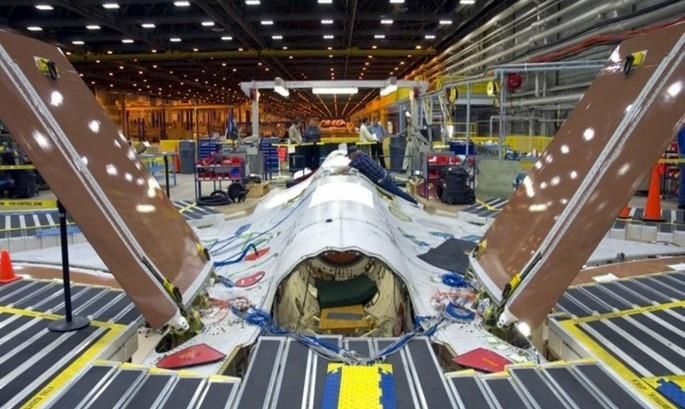
HALF YEAR IN REVIEW

                         6
Slide 6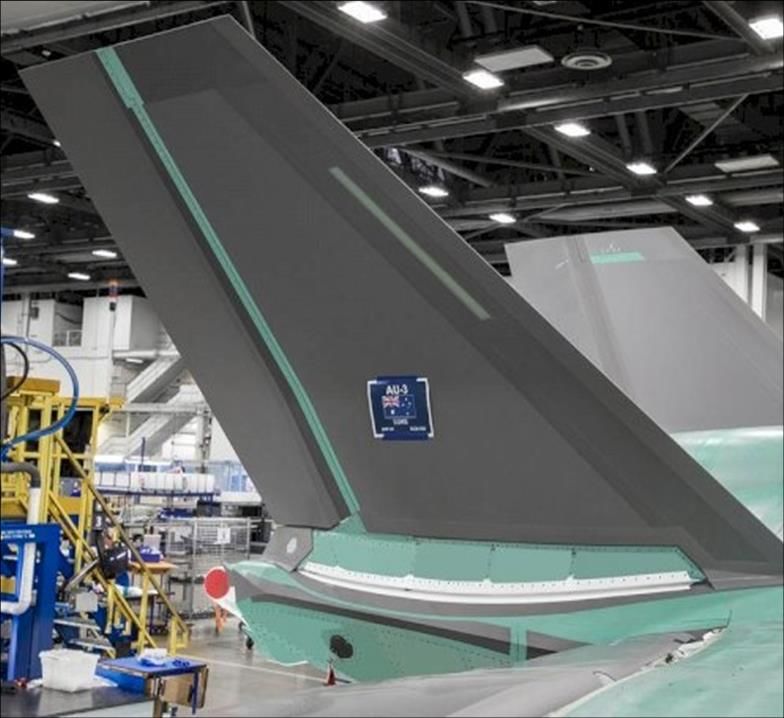
∕ Sales 8% VS pcp
H1 IN REVIEW ∕ Underlying PBT 57% vs pcp
∕ Operating cash flow $5.8 million vs pcp
∕ Net bank debt down >40% from June 2020
∕ Boeing Acquisition Complete
∕ Key technology partnerships
∕ AeroQure Progress
Slide 7
7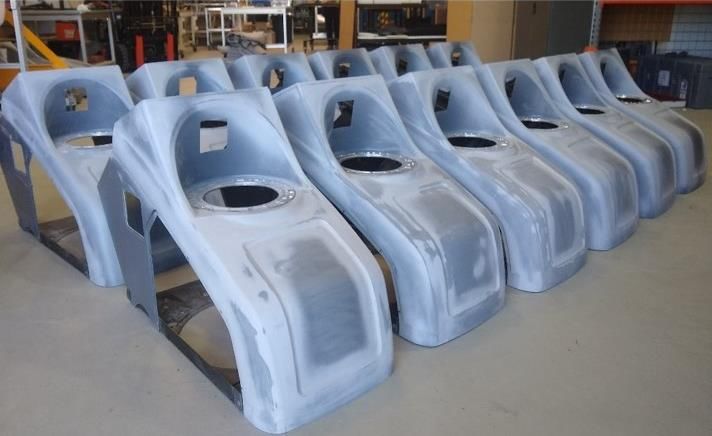
Forecast Composites Use in Aerospace (US$BN)

                                                                                                          $30

    COMPOSITES GROWTH
                                                                                                          $25

    Aerospace Global Market
                                                                                                          $20

              FORECAST
              ∕   ~7.5% CAGR (post C-19)                                                                  $15

                                                                                               US$BN
              ∕   ~US$30Bn market by 2025
              ∕   Growth in all markets                                                                   $10

                    o Defence
                    o Commercial                                                                          $5

                    o AAM

                                                                                                          $0
                                                                                                                           2020                    2021           2022                2023      2024                  2025

                                                                                                                                         Defence                         Commercial           Advanced Air Mobility

Data sources: Markets and Markets - Aerospace Composites Market Report - July 2020, Fortune Business Insights - Composites Market Size Forecast - June 2020
Global Markets Insights - Composites Market Report - April 2020 and management estimates
                                                                                                                                                                                                                        8
Slide 8
GOOD POSITIONS IN
   GREAT MARKETS

    Growth Horizons
          ∕   Horizon 1
              ∕   Core sales up 8%
              ∕   Aerospace Services (QAS) launch
          ∕   Horizon 2
              ∕   Commercial aerospace (AeroQure)
              ∕   Volansi strategic relationship
          ∕   Horizon 3
              ∕   Vaulta strategic relationship
              ∕   Space

                                                    9
Slide 9
QUICKSTEP AEROSPACE SERVICES

          ∕   Highly complementary to core business
          ∕   High growth potential
          ∕   Acquisition complete
                  ∕   Challenging short-term outlook
                  ∕   Expected to be EPS accretive by year 2
                  ∕   Defence – strong opportunity pipeline
                  ∕   Commercial – single aisle, early stage recovery
                  ∕   Commercial – twin aisle, 2-3 year recovery
      ∕       Growth plan
              ∕       Defence sustainment
              ∕       Single aisle airlines/charters
              ∕       Expansion – International defence/APAC airlines and twin aisle

                                                                                       10
Slide 10
OUTLOOK
∕ FY21 revenue growth expected year on year assuming no change to
the current AUD v USD exchange rate
∕ Integrate & grow Quickstep Aerospace Services
∕ Defence pipeline conversion
∕ Uncertain near-term outlook for MRO market
11
Slide 11PROFIT AND LOSS
Commentary AUD millions H1 FY21 FY20 H2 FY20 H1 FY20 H1 FY21 vs
Underlying underlying Underlying H1 FY20
Revenue up 8% on pcp primarily due
to growth in JSF volumes
Gross margin below pcp due to Revenue 41.5 82.3 43.8 38.4 3.1
unfavourable movement AUD vs
Gross margin 7.4 17.8 9.4 8.4 -1
USD, payroll tax concession ending
Dec ’19, modest price down on C- Gross margin % 17.8% 21.6% 21.5% 21.9% -4.0%
130.
EBITDA 3.8 8.8 4.6 4.2 -0.4
EBITDA margin explanation per gross EBITDA margin % 9.2% 10.7% 10.5% 10.9% -1.8%
margin plus impact of increased
EBIT 1.9 5.1 2.7 2.3 -0.4
R&D spend offset by Corporate cost
savings. Profit before tax 1.1 2.2 1.5 0.7 0.4
Tax benefit 0 2.2 1.4 0.8 -0.8
PBT vs pcp up 57% with small FX gain
in FY21 vs $0.6m loss in pcp NPAT 1.1 4.4 2.9 1.5 -0.4
Note : underlying profit metrics exclude FY20 $0.5m restructure costs and FY21 $0.3m acquisition costsAUD Millions H1 FY21 H2 FY20 H1 FY20 H1 FY20 vs
underlying H2 FY20
CASH FLOW Operating cash flow 5.1 1.7 -1.5 3.4
Commentary
Gross capex -1.5 -2.2 -3.8 0.7
Operating cash flow $5.1m
boosted by improved working Grant funding 0.3 0.1 0.4 0.2
capital management
including a $4.1m reduction in Net capex -1.2 -2.1 -3.4 0.9
inventory and contract
revenue asset.
Proceeds from borrowings 0.5 6.2 3.2 -5.7
Capex $1.2m net of $0.3m
flares grant is broadly Repayment of borrowings -2.9 -6.1 -2.6 3.2
representative of recurring
spend to fund capacity and Payment of borrowing costs 0 -0.2 0 0.2
efficiency improvements.
Repayment of lease liabilities -0.5 -0.5 -0.4 0.0
Borrowings repaid includes
$1.7m long term loan and Net financing cash flow -2.9 -0.6 0.2 -2.3
$0.8m working capital facility
repayments.
Net cash flow 1.0 -1.0 -4.7 2.0
Note : FY21 underlying metrics exclude $0.5m restructure costs and $0.3m acquisition costsAUD millions Dec 20 June 20 Variance
reported Reported
Trade & other receivables 7.2 7.7 -0.5
Prepayment & other assets 0.6 0.8 -0.2
BALANCE SHEET Inventories 9.1 10.1 -1.0
Contract revenue assets 6.5 9.5 -3.1
Commentary
Trade & other payables -9.5 -12.2 2.7
Inventory and contract revenue
Other provisions -3.2 -3.6 0.4
asset reduction $4.1m from tighter
management of raw materials and Employee benefit obligations -2.2 -2.4 0.2
better management of WIP
acknowledging supply chains risks Total working capital 8.5 9.9 -1.4
(COVID-19).
Property, plant and equipment 32.2 33.0 -0.8
Trade and other payables reduced
by $2.7m helped by improved
inventory management. Cash and term deposits 2.6 2.4 0.2
Lease liability -17.4 -18.0 0.6
Net bank debt decreased by
$2.7m to $3.7m due to strong Borrowings -6.3 -8.8 2.5
operating cash flow.
Net debt -21.1 -24.4 3.3
Derivative financial asset $0.4m
represents unrealised gains on FX
Deferred tax asset 3.2 3.2 0
hedge contracts.
Derivative financial instruments 0.4 0.0 0.4
Net assets 23.2 21.7 1.5THANK YOU
Authorised by:
MARK BURGESS
Managing Director and CEO
+6l 2 9774 0300
mburgess@quickstep.com.au
Quickstep Bankstown Quickstep Geelong Quickstep Aerospace Services Quickstep USA Inc.
361 Milperra Road Building LA, 75 Pigdons Road 29 Jets Court 10777 Westheimer Rd Suite 1100
Bankstown Airport NSW 2200 Waurn Ponds VIC 3216 Melbourne Airport VIC 3045 Houston TX 77042 USA
15You can also read