Radar-Based Rainfall Estimation of Landfalling Tropical Storm "PABUK" 2019 over Southern Thailand
←
→
Page content transcription
If your browser does not render page correctly, please read the page content below
Hindawi
Mathematical Problems in Engineering
Volume 2022, Article ID 9968329, 11 pages
https://doi.org/10.1155/2022/9968329

Research Article
Radar-Based Rainfall Estimation of Landfalling Tropical Storm
“PABUK” 2019 over Southern Thailand

 Pakdee Chantraket ,1,2 Sukrit Kirtsaeng ,3 Chakrit Chaotamonsak,4,5
 Somporn Chantara ,4 Supachai Nakapan,4 and Thammarat Panityakul 6

 1
 Department of Royal Rainmaking and Agricultural Aviation, Bangkok 10900, Thailand
 2
 PhD Degree Program in Environmental Science, Environmental Science Research Center, Faculty of Science,
 Chiang Mai University, Chiang Mai 50200, Thailand
 3
 Thai Meteorological Department, Bangkok 10260, Thailand
 4
 Regional Centers for Climate and Environmental Studies (RCCES), Chiang Mai University, Chiang Mai 50200, Thailand
 5
 Department of Geography, Faculty of Social Sciences, Chiang Mai University, Chiang Mai 50200, Thailand
 6
 Division of Computational Science, Faculty of Science, Prince of Songkla University, Songkhla 90110, Thailand

 Correspondence should be addressed to Pakdee Chantraket; pakdee2@gmail.com

 Received 9 March 2021; Revised 3 November 2021; Accepted 15 November 2021; Published 2 February 2022

 Academic Editor: Harish Garg

 Copyright © 2022 Pakdee Chantraket et al. This is an open access article distributed under the Creative Commons Attribution
 License, which permits unrestricted use, distribution, and reproduction in any medium, provided the original work is
 properly cited.
 Tropical storm PABUK developed from tropical depression first defined on 31 December 2018 in the lower South China Sea. It
 made landfall in Pak Phanang, Nakhon Si Thammarat province, southern Thailand. PABUK caused heavy rain and flash floods
 from 3 to 5 January 2019 (D1, D2, and D3) where the total rainfall reached 150–300 mm across 14 provinces of southern Thailand.
 This paper is aimed to investigate rainstorm properties and rainfall estimation of tropical storm PABUK with weather radar in
 southern Thailand. The radar data analysis in this study was to extract the radar reflectivity to study rainstorm properties of
 PABUK over 3 days along southern Thailand derived from the Thunderstorm Identification and Tracking Analysis and
 Nowcasting (TITAN) algorithm including 5 variables of duration, area, cloud-based height, maximum reflectivity, and speed in
 the data set. Based on the properties and frequency distribution of 2,557 rainstorms in D1, D2, and D3, rainstorms in D2 and D3
 when PABUK made landfall over southern Thailand show a longer lifetime, higher reflectivity, and larger rain-cells as well as it was
 found efficient in terms of rainfall amount than in D1. In addition, the estimated rainfall using weather radar provides important
 information of the rainfall distribution for the analysis of the rainstorm as well. These analyses provide a context for interpreting
 the feasible rainfall estimates based on Z-R relationship during tropical storm PABUK that produced extreme floods in southern
 Thailand. A Z-R relationship in the form Z � 104R1.5 provided acceptable statistical indicators, making it appropriate for radar
 estimated rainfall in case studies presented of tropical storm PABUK in southern Thailand. However, the result of this study
 should be improved to estimate precipitation in case of extremely heavy rainfall in tropical storm occurrence by using radar of
 southern Thailand and applied for applications of early warning systems.

1. Introduction existence of long radar data sets, these data could be also
 applied for climatological applications. In addition, weather
A large number of studies on rainstorm analysis obtained radar is also tool that combines meteorology and hydrology
from capability for spatial and temporal storm profiles [4–6]; the meteorological information measured by radar are
measurement of weather radar are widely used to detect the used for hydrological analysis as referred to Peng et al. [7],
convective storms and study of convective storm structure and they explained that the advantage of using radar for
[1–3] and also the process of the rainfall system itself by precipitation measurement is the coverage of a large area in
providing real-time regional information, and with the real-time, and radars also experience difficulty in achieving
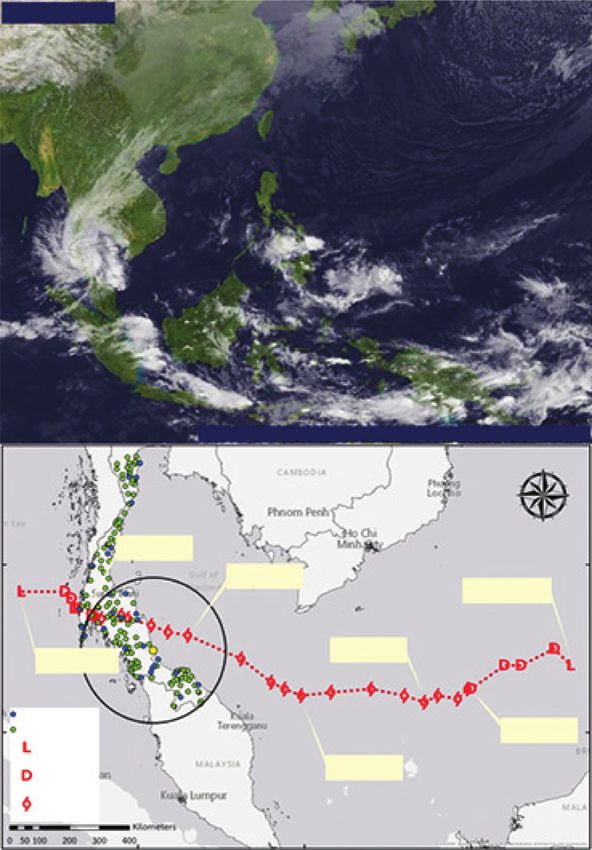
2 Mathematical Problems in Engineering

an accurate estimation for hydrological applications. The landfall on 4 January 2019 over Phanang, Nakhon Si
single-polarization [3] and dual-polarization [8, 9] weather Thammarat province, at latitude of 8.2°N and longitude of
radar was used to study the relationship between radar 100.2°E. Maximum sustained wind is 75 kmhr−1, and the
reflectivity and rainfall rate which is developed for rainfall storm was moving northwest at a speed of 18 kmhr−1.
measurement by using the Z-R relationship. The uncertainty PABUK became the first tropical storm to make landfall over
of radar rainfall estimation by using Z-R relationship was southern Thailand since Linda in 1997. This affected the
proposed by Chen et al. [10] and Gou et al. [11]. The de- South with widespread heavy rainfalls, and torrential
veloped Z-R relationships are needed in Thailand to provide downpours are possible in much of southern area of
a more systematic and comprehensive approach to achieve Thailand from 3 to 5 January 2019 as follows:
water management.
 (1) On 3 January 2019 (hereafter referred as D1) at 11.00
 Applications of weather radar in Thailand are still
 UTC, tropical storm “PABUK” was located 500 km
limited mostly for meteorology and monitoring the weather
 southeast of Nakhon Si Thammarat province at the
routines. Not much work has been done in the field of
 latitude of 6.5°N and longitude of 104.2°E with
hydrological and heavy rainfall cases. Finding rainfall in-
 maximum sustained winds of 65 kmhr−1. The storm
tensity is one of the essential applications for weather radar
 was accelerated west-northwestward and entered the
in the process of hydrology, flood management, and early
 Gulf of Thailand which affected the lower part of
winning system in case of severe weather situation. For the
 southern Thailand with heavy rainfalls and some
purpose in radar rainfall estimation, the relationship be-
 torrential downpours in Phatthalung, Songkhla,
tween radar reflectivity and rainfall rate is developed for
 Pattani, Yala, and Narathiwat.
rainfall measurement by using the Z-R relationship. The Z-R
relationship is highly dependent on the precipitation types (2) On 4 January 2019 (hereafter as D2), the storm
and wind conditions such as convective, stratiform or mixed moved westward into the lower Gulf of Thailand, and
types, and deep convection [12–15]. Event type is one of the it made landfall at 05 : 45 UTC over Phanang,
major influences of Z-R relationship that must be studied Nakhon Si Thammarat province, at latitude of 8.2°N
accordingly. Moreover, the location of areas and seasonal and longitude of 100.2°E with the maximum sus-
also plays an important factor in applying Z-R relationships tained wind of 75 kmhr−1, and the storm was moving
to radar rainfall measurements [1, 16]. Most weather radars northwest at a speed of 18 kmhr−1. It affected the east
in Thailand are not calibrated for the Z-R relationship. As side of South with widespread heavy rainfall, strong
the results, the developed radar rainfall estimation in case of winds, and severe conditions that cause forest run-
severe weather situation from tropical storm is needed in offs and flash floods in Phetchaburi, Prachuap Khiri
Thailand providing a more systematic and comprehensive Khan, Chumphon, Surat Thani, Nakhon Si Tham-
approach to achieve in water management and also addi- marat, Phatthalung, Ranong, Phangnga, Phuket,
tionally to implement in flood warning purposes. Because Krabi, Trang, and Satun.
the southern part of Thailand is a major economic tree
plantation zone, especially fruits, oil palm, and rubber tree, it (3) On 5 January 2019 (hereafter as D3) at 17.00 UTC,
is almost in transition from water richness to water scarcity tropical storm “PABUK” was due 5 km west of Takua
because of the increasing demands on this limited resource Pa, Phangnga, with the latitude of 8.7°N and longitude
as well as there is no universal Z-R relationship that can be of 104.2°E with the maximum sustained wind of
applied to all cases of rainfall events. Therefore, the focus of 55 kmhr−1; the storm was moving west-northwest
this paper will be on the optimization of Z-R relationships slowly with the outbreaks of torrential downpours
during tropical storm and heavy precipitation which were much of southern provinces including Phetchaburi,
tuned to fit the rain gauge measurements that turn into Prachuap Khiri Khan, Chumphon, Surat Thani,
inaccuracies over the central region of Thailand. Nakhon Si Thammarat, Ranong, Phangnga, Phuket,
 This article is structured as follows. The data and and Krabi. PABUK then moved down to the Anda-
methodology section presents the overview of PABUK man Sea and weakened into a low-pressure cell during
tropical cyclone, the technical characteristics of the radar the same day and covered the Andaman Sea.
used, radar data analyses, and the statistics for the analysis. The influence of tropical storm PABUK caused strong
This is followed with presenting the results of rainstorm wind shear, heavy rain, and flash floods from D1 to D3 where
properties and radar rainfall estimation during PABUK the accumulated rainfall reached 150–300 mm a day across
event, and the article closes with is a brief discussion about 14 provinces of southern Thailand, especially in Nakhon Si
the conclusion reached. Thammarat, Surat Thani, Chumphon, Ranong, Phatthalung,
 Songkhla, Pattani, Yala, and Narathiwat, the maximum
2. Data and Methodology rainfall in 24 hours reached 309.3 mm, and maximum wind
2.1. Overview of PABUK Tropical Cyclone. Tropical storm speed was 89 kmhr−1 at Nakhon Si Thammarat province on
PABUK, which has originated from the low-pressure zone in D2. In addition, PABUK also results in rising sea levels and
the South China Sea, developed from tropical depression blowing into the shore as storm surge in the coastal region of
first defined on 31 December 2018. This storm moved upper southern region; the images of the damage caused by a
westward into the lower Gulf of Thailand, and it made tropical storm PABUK are as shown in Figure 1.
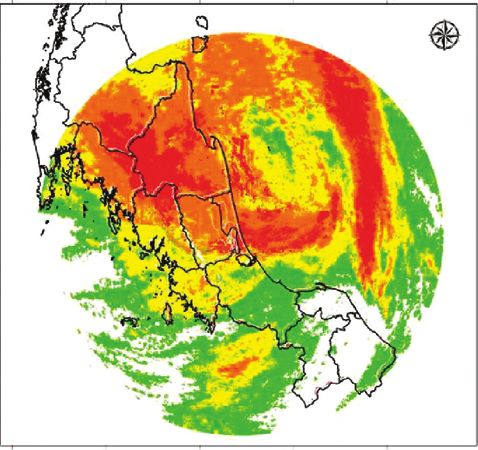
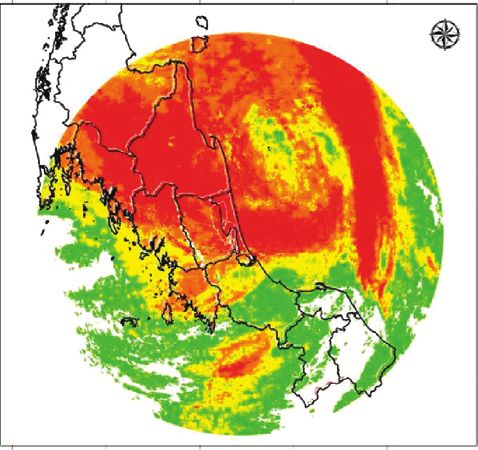
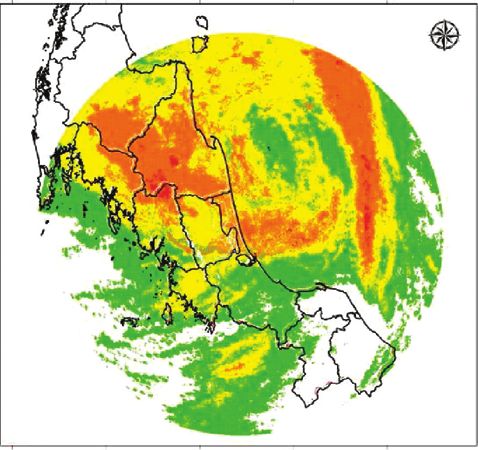
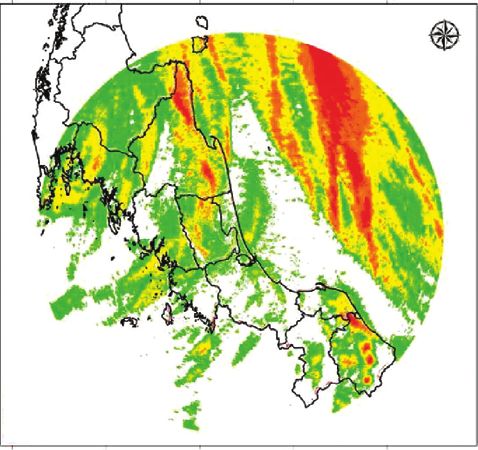
Mathematical Problems in Engineering 3

Figure 1: Strong wind shear and flooding caused by tropical Storm PABUK at first hit over Phanang, Nakhon Si) ammarat province,
southern) ailand on D2 (image: REUTERS and https://news.mthai.com/).

2.2. Radar Data Analyses. The study area has been southern where a and b are the relationship parameters, Z is the radar
Thailand, characterized by a complex topography and di- reflectivity in mm6m−3, and R is the intensity of precipitation
rectly influenced by the South China Sea and Indian Ocean mmh−1.
(Figure 2). The C-Band Doppler Radar, which represents a The rainfall events were used to obtain the appropriated
good compromise between range and reflectivity that can Z-R relationship for tropical storm in southern Thailand as
provide rain detection up to a range of 240 km, from Thai well as to test an accuracy of the proposed radar rainfall
Meteorological Department (TMD) was used in this study. estimation based on different Z-R relationships as referred to
The reflectivity data from Songkhla’s radar located in the Kirtsaeng and Chantraket [16] of Songkhla’s radar of
eastern coastline near the landfall of PABUK tropical storm Z � 104R1.5, Z � 162R1.5, and Z � 184R1.5 and the operational
were appropriately used to investigate the rainstorm Z-R relationships of TMD Z � 300R1.4 as referred for all rain
properties and estimated radar rainfall that affected the types especially for deep convective [21, 22]. In order to
southern region of Thailand. Radar is installed at Sathingpra evaluate the suitable Z-R relationship for tropical storm of
District, Songkhla, at the elevation of 33 m MSL in southern PABUK, their measurement wascompared with the pre-
Thailand as shown in Figure 2. The radar with EDGE
software collected the reflectivity data as volume scan to the
 ™ cipitation recorded by the rain gauges from automatic
 meteorological stations of Hydro Informatics Institute (HII)
highest altitude up to 5 km provided in the universal flies and TMD. The study was performed by using 24-hour ac-
(UF) format [17]. The files were obtained every 15 minutes cumulations of 156 rain gauges in and around southern
up to the effective range of 240 km to the highest altitude up regions in the coverage of radar effective range (see Figure 2)
to 5 km provided in the volume format files for 4 elevation having been scrutinized during D1 to D3. These data were
angles: 0.5°, 1.5°, 2.4°, and 3.4°, and a Doppler filter is applied procured from the (i) 129 stations of HII and (ii) 27 stations
to remove ground clutter and fixed echoes. of TMD. After procurement of 24-hour accumulations from
 In order to characterize rainstorm properties, radar different sources, these were subjected to extensive quality
reflectivity data in horizontal polarization were run through control tests to remove gross errors, archival errors, and
TITAN and used the 30 dBZ reflectivity threshold to identify reformatting problem; however, the suspected data were
a convective storm cell before tracking their movement as checked for validation from different reliable sources. The
referred to Dixon and Wiener [18]; Johnson et al. [19], and study was carried out using 24-hour accumulations, com-
Potts et al. [20]. All of rainstorms were selected and analyzed paring with estimated rain accumulation from Z-R rela-
by the dataset from the criteria as suggestion by Chantraket tionship that occupied the position of rain gauges. Rain
et al., [1] including their 5 properties as exhibited in Table 1. gauge measurement and radar estimate of 24-hour accu-
However, it may be mentioned that in this study, only those mulations greater than 1.0 mm and less than 300 mm were
rainstorms are considered whose rain centers are located in considered to be valid. Daily rainfall distribution in southern
the effective range of 240 km of Songkhla’s radar. The event Thailand caused by tropical storm PABUK during D1, D2,
numbers differed in each day; these data were then analyzed and D3 is shown in Figure 4.
to express properties of individual rainstorms. The total of The statistical indexes used to evaluate the different of
2,557 rainstorm events were chosen from D1 (1,014 rain- estimated rain accumulation from Z-R relationship related
storms), D2 (962 rainstorms), and D3 (581 rainstorms), with the rain gauges as recommended by [23] are as follows.
respectively, during occurred PABUK tropical cyclone. The Root mean square error (RMSE) is as follows:
example case of rainstorm events from TITAN analysis is �������������

presented in Figure 3, and the preliminary of statistical 1 N 2
analysis of all properties is illustrated as Table 2. RMSE � R − Gi . (2)
 N i�1 i
 In order to estimate radar rainfall, the relationship be-
tween radar reflectivity and rainfall rate which is developed
for rainfall measurement was used as explained in the fol- Mean error (ME) is as follows:
lowing equation: 1 N
 ME � R − Gi . (3)
 Z � aR ,b
 (1) n i�1 i
4 Mathematical Problems in Engineering

 19010406GMT

 Weather Home, Kochi Univ. / Himawari-8 IR1, JMA / Blue Marble, NASA

 N

 W E

 S
 1/5/2019 0:00
 10°N 10° N
 1/4/2019 0:00
 12/31/2018 0:00

 1/2/2019 0:00
 1/5/2019 13:00

 TMD Stations

 5°N HII Stations 1/1/2019 0:00 5° N
 Low Pressure Area
 1/3/2019 0:00
 Tropical Depression

 Tropical Storm

 100° E 105° E 110° E
Figure 2: Tropical storm PABUK developed from a tropical depression and being placed at 6 h intervals and as observed during D3 at 0600
UTC time by Japan’s Himawari-8 satellite. Image credit: JMA (Japan meteorological agency).

 Table 1: Radar-obtained storm characteristics from TITAN and their units.
Rainstorm properties Variables Units
(1) Mean storm duration SDUR Hours
(2) Mean storm-based SBAS km MSL
(3) Maximum envelope area SARE km2
(4) Maximum reflectivity SREF dBZ
(5) Mean speed SVEL kmhr−1
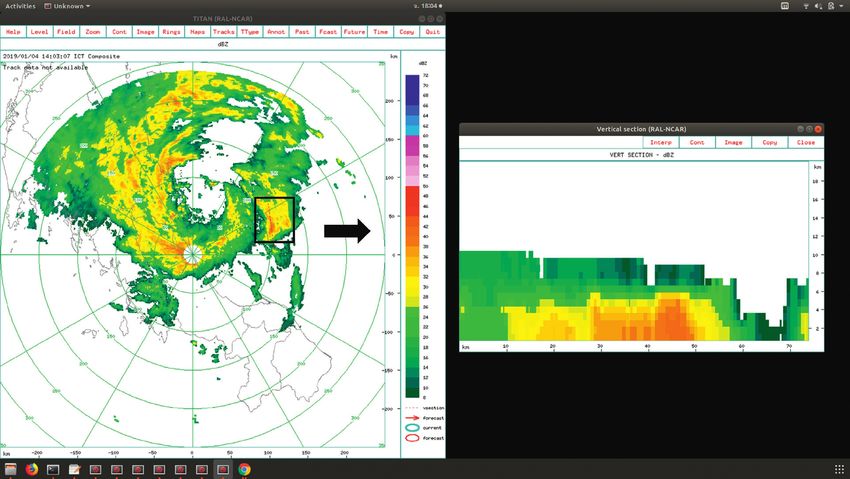
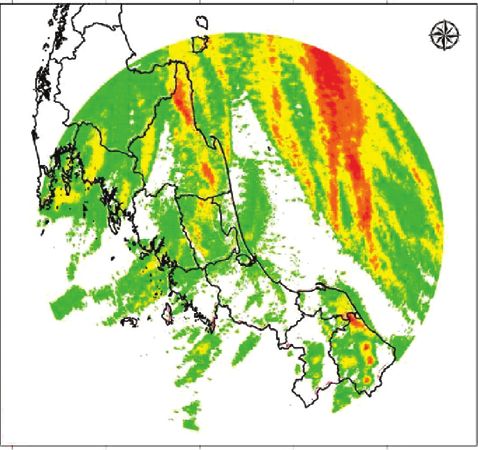
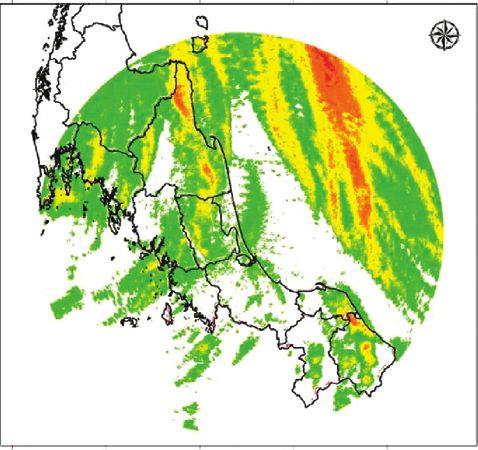
Mathematical Problems in Engineering 5

 (a) (b)
Figure 3: Some case of rainstorm events obtained from TITAN analysis of Songkhla’s radar on D2 at 14 : 03 UTC: (a) TITAN analysis image
and (b) cross section of selected rainstorm.

 Table 2: The storm properties during D1, D2, and D3 of PABUK event in southern Thailand.
 SDUR SBAS SREF SARE SVEL
 2
 Hours km MSL dBZ km kmhr−1
 D1 D2 D3 D1-D3 D1 D2 D3 D1-D3 D1 D2 D3 D1-D3 D1 D2 D3 D1-D3 D1 D2 D3 D1-D3
Mean 0.9 0.9 1.0 0.9 2.0 1.8 1.9 1.9 35.0 38.6 43.5 38.3 52.0 55.8 46.4 52.2 23.1 22.5 18.2 21.8
SD 0.4 0.5 0.7 0.5 0.9 0.9 0.9 0.9 5.2 6.9 8.3 7.4 112.9 138.7 68.1 115.5 13.4 13.5 11.5 13.2
Min 0.5 0.5 0.5 0.5 0.6 0.6 0.6 0.6 30.0 30.0 30.0 30.0 3.4 4.5 4.5 3.4 0.0 0.0 0.0 0.0
Max 2.8 4.7 4.8 4.8 3.6 3.6 3.6 3.6 61.0 62.0 67.5 67.5 2666.3 3359.3 737.4 3359.3 62.3 114.5 56.0 114.5
D1: N � 1014 events, D2: N � 962 events, and D3: N � 581 events.

 D1 Accumulated Rainfall D2 Accumulated Rainfall D3 Accumulated Rainfall 3-day Accumulated Rainfall
 (mm) (mm) (mm) (mm)
 Station JAN 3, 2019 Station JAN 4, 2019 Station JAN 5, 2019 Station JAN 3-5, 2019
 98°0'E 99°0'E 100°0'E 101°0'E 102°0'E 98°0'E 99°0'E 100°0'E 101°0'E 102°0'E 98°0'E 99°0'E 100°0'E 101°0'E 102°0'E 98°0'E 99°0'E 100°0'E 101°0'E 102°0'E
 N N N N
 W E W E W W E
 S S S S

 98°0'E 99°0'E 100°0'E 101°0'E 102°0'E 98°0'E 99°0'E 100°0'E 101°0'E 102°0'E 98°0'E 99°0'E 100°0'E 101°0'E 102°0'E 98°0'E 99°0'E 100°0'E 101°0'E 102°0'E

 Rainfall (mm.) Rainfall (mm.) Rainfall (mm.) Rainfall (mm.)
 90
 35 35 35 35

 (a) (b) (c) (d)

Figure 4: Rainfall distribution of 24-hour accumulations in southern Thailand caused by tropical storm PABUK through (a) D1, (b) D2,
and, (c) D3 and (d) 3-day accumulated rainfall during D1 to D3.
6 Mathematical Problems in Engineering

 6.0 50.0
 D1: N=1014 D2: N=962 D3: N=581
 5.0 40.0

 Frequency (SDUR)
 4.0
 SDUR (hours)

 30.0
 3.0
 20.0
 2.0
 10.0
 1.0

 0.0 0.0
 0 200 400 600 800 1000 1200 1400 1600 1800 2000 2200 2400 2600 0.0 0.5 1.0 1.5 2 and More
 Amount of rainstorms SDUR (hours)

 D1
 D2
 D3

 (a) (b)

 Figure 5: The rainstorm duration (a) and frequency distribution (b) during D1, D2, and D3.

 10.0 50.0
 D1 D2 D3
 8.0 40.0

 Frequency (SBAS)
 30.0
 SBAS (km)

 6.0

 4.0 20.0

 2.0 10.0

 0.0 0.0
 0 200 400 600 800 1000 1200 1400 1600 1800 2000 2200 2400 2600 0.75 1.5 2.5 3.5 and More
 Amount of rainstorms SBAS (km)

 D1
 D2
 D3

 (a) (b)

 Figure 6: The rainstorm bases (a) and frequency distribution (b) during D1, D2, and D3.

 Mean absolute error (MAE) is as follows: 3. Result and Discussion
 N
 1
 3.1. Rainstorm Properties of Tropical Storm PABUK from D1,
 MAE � Ri − Gi . (4)
 n i�1 D2, and D3
 Bias is as follows: 3.1.1. Rainstorm Duration (SDUR). SDUR is the time
 N elapsed from the first radar reflectivity of 30 dBZ until the
 i�1 Gi
 B� , (5) disappearance of precipitation. This study revealed that the
 N
 i�1 Ri average individual SDUR during D1 to D3 was around 0.9 to
where G is 24-hour accumulations of rain gauges at station i 1 hour, and almost all SDURs in D1 were less than 2 hours as
in mm, R is 24-hour accumulations of radar rainfall com- in D2 and D3 tended to be longer duration than D1 as 1 to 3
puted using Z-R relationship at the point with coincided to hours. It is implied that the longer SDUR in D2 and D3
rain gauge station i in mm, and N is the number of pre- would extend the potential of rainfall intensity near the
cipitation records. center of tropical storm PABUK in accordance with ex-
 Several Z-R relationships would be specified by the tremely heavy rainfall in D2 and D3 of rain gauge mea-
calculation of equations (2) to (5). Whichever relation surement when the rainstorm made landfall over southern
provides the minimum of the four statistical measures will be Thailand. The time series and frequency distribution of
selected as the most suitable relations for the study. SDUR on D1 to D3 are illustrated in Figure 5.
Mathematical Problems in Engineering 7

 70.0 100.0
 D1 D2 D3
 80.0
 60.0

 Frequency (SREF)
 SREF (dBz)

 60.0
 50.0
 40.0
 40.0
 20.0

 30.0 0.0
 0 200 400 600 800 1000 1200 1400 1600 1800 2000 2200 2400 2600 30.0 40.0 50.0 60 and More
 Amount of rainstorms SREF (dBz)

 D1
 D2
 D3

 (a) (b)

 Figure 7: The rainstorm reflectivity (a) and frequency distribution (b) during D1, D2, and D3.

 10000.0 50.0

 Frequency (SARE_Max)
 40.0
 SARE_MAX (km^2)

 1000.0

 D1 D2 D3 30.0
 100.0
 20.0
 10.0
 10.0

 1.0 0.0
 0 200 400 600 800 1000 1200 1400 1600 1800 2000 2200 2400 2600 10.0 25.0 50.0 100 and More
 Amount of rainstorms SARE (km^2)

 D1
 D2
 D3

 (a) (b)

 Figure 8: The rainstorm area (a) and frequency distribution (b) during D1, D2, and D3.

 140.0 50.0
 D1 D2 D3
 120.0
 40.0
 100.0
 Frequency (SVEL)
 SVEL (km/hr)

 80.0 30.0

 60.0 20.0
 40.0
 10.0
 20.0
 0.0 0.0
 0 200 400 600 800 1000 1200 1400 1600 1800 2000 2200 2400 2600 10.0 20.0 30.0 40.0 50.0 60 and
 More
 Amount of rainstorms
 SVEL (km/hr)

 D1
 D2
 D3

 (a) (b)

 Figure 9: The rainstorm speed (a) and frequency distribution (b) during D1, D2, and D3.
8 Mathematical Problems in Engineering

 Date D1 D2 D3
 Station JAN 3, 2019 Station JAN 4, 2019 Station JAN 5, 2019
 98°0'E 99°0'E 100°0'E 101°0'E 102°0'E 98°0'E 99°0'E 100°0'E 101°0'E 102°0'E 98°0'E 99°0'E 100°0'E 101°0'E 102°0'E
 N N N
 W E W E W E

 S S S

 24-hrs Gauge rainfall (mm)

 Rainfall (mm.) Rainfall (mm.) Rainfall (mm.)
 90
 98°0'E 99°0'E 100°0'E 101°0'E 102°0'E 98°0'E 99°0'E 100°0'E 101°0'E 102°0'E 98°0'E 99°0'E 100°0'E 101°0'E 102°0'E
 24-hrs Radar Rainfall (mm) Z=104R1.5 104R1.5, JAN 3, 2019 104R1.5, JAN 4, 2019 104R1.5, JAN 5, 2019
 300 98°0'E 99°0'E 100°0'E 101°0'E 102°0'E 98°0'E 99°0'E 100°0'E 101°0'E 102°0'E 98°0'E 99°0'E 100°0'E 101°0'E 102°0'E
 N N N
 W E W E W E

 250 y = 1.06x S S S
 R2 = 0.71

 200
 Radar Rainfall (mm)

 150

 100

 50 Rainfall (mm.) Rainfall (mm.) Rainfall (mm.)
 90
 0 50 100 150 200 250 300 98°0'E 99°0'E 100°0'E 101°0'E 102°0'E 98°0'E 99°0'E 100°0'E 101°0'E 102°0'E 98°0'E 99°0'E 100°0'E 101°0'E 102°0'E
 Rainfall (mm)
 162R1.5 JAN 3 , 2019 162R1.5 JAN 4 , 2019 162R1.5 JAN 5 , 2019
 300
 104, 1.5 Z=162R1.5 98°0'E 99°0'E 100°0'E 101°0'E 102°0'E 98°0'E 99°0'E 100°0'E 101°0'E 102°0'E 98°0'E 99°0'E 100°0'E 101°0'E 102°0'E
 N N N
 W E W E W E

 250 y = 1.75x S S S
 R2 = 0.53

 200
 Radar Rainfall (mm)

 150

 100

 Rainfall (mm.) Rainfall (mm.) Rainfall (mm.)
 50 90
 0 50 100 150 200 250 300 98°0'E 99°0'E 100°0'E 101°0'E 102°0'E 98°0'E 99°0'E 100°0'E 101°0'E 102°0'E 98°0'E 99°0'E 100°0'E 101°0'E 102°0'E
 Rainfall (mm)
 162, 1.5 184R1.5 JAN 3 , 2019 184R1.5 JAN 4 , 2019 184R1.5 JAN 5 , 2019
 1.5
 Z=184R 98°0'E 99°0'E 100°0'E 101°0'E 102°0'E 98°0'E 99°0'E 100°0'E 101°0'E 102°0'E 98°0'E 99°0'E 100°0'E 101°0'E 102°0'E
 300
 N N N
 W E W E W E
 S S S
 250
 y = 1.09x
 R2 = 0.14
 200
 Radar Rainfall (mm)

 150

 100

 Rainfall (mm.) Rainfall (mm.) Rainfall (mm.)
 50 90
 0 50 100 150 200 250 300 98°0'E 99°0'E 100°0'E 101°0'E 102°0'E 98°0'E 99°0'E 100°0'E 101°0'E 102°0'E 98°0'E 99°0'E 100°0'E 101°0'E 102°0'E
 Rainfall (mm)
 300R1.5 JAN 3 , 2019 300R1.5 JAN 4 , 2019 300R1.5 JAN 5 , 2019
 184, 1.5
 Z=300R1.4 98°0'E 99°0'E 100°0'E 101°0'E 102°0'E 98°0'E 99°0'E 100°0'E 101°0'E 102°0'E 98°0'E 99°0'E 100°0'E 101°0'E 102°0'E
 300 N N N
 W E W E W E
 S S S
 250

 200
 Radar Raifall (mm)

 y = 0.58x
 R2 = 0.62
 150

 100

 Rainfall (mm.) Rainfall (mm.) Rainfall (mm.)
 50 90
 0
 0 50 100 150 200 250 300 98°0'E 99°0'E 100°0'E 101°0'E 102°0'E 98°0'E 99°0'E 100°0'E 101°0'E 102°0'E 98°0'E 99°0'E 100°0'E 101°0'E 102°0'E
 Rainfall (mm)
 300, 1.4

 (a) (b)

Figure 10: (a) Scatter plot between measured and estimated rainfall rate based on the different Z-R relationship of Z � 184R1.5, Z � 104R1.5,
Z � 162R1.5, and Z � 300R1.4 and (b) time series plot of gauge rainfall and radar rainfall during D1, D2, and D3 by using the different Z-R
relationship of Z � 184R1.5, Z � 104R1.5, Z � 162R1.5, and Z � 300R1.4.

3.1.2. Rainstorm Bases (SBAS). The SBAS show the mini- respectively. The results of this study showed that an average
mum height of radar reflectivity, as the minimum reflectivity of SBAS is quite similar in D1, D2, and D3; between 1.8 and
threshold and altitude are determined as 30 dBZ and 0.6 km, 2.0 km MSL, all events of occurred rainstorms are lower than
Mathematical Problems in Engineering 9

Table 3: Comparisons of the statistical measures gained from the different Z-R relationships of Z � 184R1.5, Z � 104R1.5, Z � 162R1.5, and
Z � 300R1.4.
Z-R relationships ME (mm) RMSE (mm) MAE (mm) BIAS (G/R)
Z � 104R1.5(NEM) −4.00 21.27 12.46 0.87
Z � 162R1.5(BULK) −26.33 53.40 30.10 0.48
Z � 184R1.5(SWM) −12.06 54.77 30.48 0.67
Z � 300R1.4(WSR) 9.34 24.38 12.94 1.52

4 km during PABUK occurrence. The time series and fre- Z � 300R1.4 is compared. The comparison of the 24 hr ac-
quency distribution of SBAS on D1 to D3 are illustrated in cumulated radar rainfall and the 24 hr accumulated gauge
Figure 6. rainfall using the four trials of Z-R relationship is presented
 in Figure 10, and the statistical measures comparing these
 two sets of data are also calculated and summarized in
3.1.3. Rainstorm Reflectivity (SREF). The result from this Table 3.
study shows that on average maximum value, storm’s Figure 10 shows the images of estimated daily radar
reflectivity peaks that occurred during PABUK are distin- rainfall attained from four Z-R relationships in D1, D2, and
guished among three days and tend to be higher SREF from D3 and the scatter plot of the 24 hr accumulation of esti-
D1, D2, and D3 as 35.0 dBZ, 38.6 dBZ, and 43.5 dBZ, re- mated radar rainfall attained from the different Z-R rela-
spectively. Furthermore, the maximum SREF was found as a tionships and 24 hr accumulated gauge rainfall during D1 to
stronger reflectivity more than 60 dBz which corresponds to D3. The estimated daily radar rainfall using the four trails of
the precipitation intensity and the development of PABUK relation in D1, D2, and D3 was plotted as shown in the left
tropical cyclone during D1 to D3 as well. The variation of side of radar images. From the scatter plot, it can be noted
SREF along three days in PABUK period is presented in that the estimated radar rainfall accumulation is mostly
Figure 7. higher than accumulated rain gauges except for Z � 300R1.4
 and also shows that Z � 104R1.5 can provide the closest
3.1.4. Rainstorm Area (SARE). The average SARE during compared with the scatter plot of the other relations.
PABUK period shows difference among D1, D2, and D3. The An agreement between estimated radar and gauge
largest SARE from individual rainstorm is shown in D2 that rainfall was examined using the statistical measures resulting
is approximately 55.8 km2. It is seen that the area of indi- from the four trials of Z-R relationships. The results show
vidual rainstorms of D2 when PABUK made landfall over that the Z � 104R1.5 is acceptable for overall statistical
Nakhon Si Thammarat province was found to be more measures, with minimum of the four statistical measures,
potential rainstorms than D1 and D3 according to the ex- RMSE, ME, MAE, and BIAS, between the estimated radar
tremely heavy rainfall in D2 occurred near the landfall point and calculated rain gauge rainfall for the data sets in D1, D2,
and inland of southern part. The D2 rainstorm composes of and D3. The calibrated Z-R relationship of Z � 104R1.5 is
several large cells as well as they can also lead to larger areas therefore appropriate to be used for an estimation of ac-
of precipitation. The variation of these properties along three cumulated radar rainfall in the tropical storm of PABUK.
days in PABUK period is presented in Figure 8.

 4. Conclusions
3.1.5. Rainstorm Speed (SVEL). The TITAN algorithm can
provide the information of storm tracking and its move- The study presented the physical properties of rainstorm and
ment. The results obtained from this study show that the radar-based rainfall estimation during tropical storm
average SVEL of D1, D2, and D3 was 23.1 kmhr−1, PABUK moving into the lower Gulf of Thailand and making
22.5 kmhr−1, and 18.2 kmhr−1, respectively. Most of SVEL landfall over southern Thailand which affected the southern
has tend to be at lower speed when landfalling and passing regions with widespread heavy rainfall and flash floods.
through the land of southern Thailand. Investigating the Derived from the data set of radar reflectivity and rain
maximum speed in D1, D2, and D3 as illustrated in Table 2, gauges during three days of PABUK, all storm properties
it is found that maximum SVEL of individual rainstorms was were analyzed with TITAN, and estimated radar rainfall
observed in D2 consistently with the report of maximum specified the appropriated Z-R relationship by the selected
sustained wind during PABUK occurred period as well. The statistical measures. The results are shown as follows:
time series and frequency distribution of SVEL on D1 to D3 (1) Three days (D1, D2, and D3) during the tropical
are illustrated in Figure 9. storm of PABUK in order to investigate rainstorm of
 southern Thailand obtained the 5 properties of
3.2. Radar Rainfall Estimation. The radar estimated rainfall rainstorms by using TITAN, which provided the
during PABUK landfall period was analyzed by the step as important analysis tool to identify rainstorms and
explained in the previous section. The result of estimated their movement in this study. It is revealed that
rainfall accumulation using Z-R relationship in four trials of rainstorms were found to be the most effective
(1) Z � 184R1.5, (2) Z � 104R1.5, (3) Z � 162R1.5, and (4) clouds over southern region. In accordance with the
10 Mathematical Problems in Engineering

 characteristics of rainstorms, it can be seen that [3] P. Chantraket, P. Intarachareon, and S. Kirtsaeng, “Analysis of
 rainstorms in D2 and D3 when PABUK made rainstroms charateristics in eastern regions of Thailand,”
 landfall over Nakhon Si Thammarat province, International Journal of Applied Sciences and Innovations,
 southern Thailand, show a longer lifetime, higher vol. 2016, no. 1, pp. 58–75, 2016.
 reflectivity, and larger rain-cells as well as it was [4] H. Sauvgeot, “Rainfall measurement by radar: a review,”
 found efficient in terms of rainfall amount than in D1 Atmospheric Research, vol. 35, pp. 27–54, 1994.
 [5] J. Joss and A. Waldvogel, Precipitation Measurement and
 consistently with the records of high precipitation
 Hydrology, American Meteorological Society, Boston, MA,
 depth in southern in that periods.
 USA, 1990.
 (2) The appropriated Z-R relationship acceptable for [6] P. Smith, Precipitation Measurement and Hydrology: Panel
 estimated radar rainfall during the tropical storm of Report, A. D. Meteorology, Ed., American Meteorological
 PABUK in southern Thailand is Z � 104R1.5, which Society, Boston, MA, USA, 1990.
 provided the minimum of the four statistical [7] L. Peng, S. Xingyuan, and T. Wenwen, “A study on quanti-
 measures (RMSE, ME, MAE, and BIAS) so far as the tative radar rainfall measurements by the method of set-air
 southern basin is concerned. The results should be analysis,” Global Congress on Intelligent Systems, 2009.
 especially useful in urban design problems as well as [8] Y. Ma and V. Chandrasekar, “A hierarchical bayesian ap-
 in hydrologic design problems during unusual cases proach for bias correction of NEXRAD dual-polarization
 such as extremely heavy rainfall from tropical storm rainfall estimates: case study on hurricane irma in Florida,”
 on the southern basin. IEEE Geoscience and Remote Sensing Letters, vol. 18, 2020.
 [9] K. Aydin and V. Giridhar, “C-band dual-polarization radar
 (3) These results are provided to assess the planning of observables in rain,” Journal of Atmospheric and Oceanic
 water resources on a probability in a particular re- Technology, vol. 9, no. 4, pp. 383–390, 1992.
 gion or a basin and made to provide improvement of [10] H. Chen, R. Cifelli, V. Chandrasekar, and Y. Ma, “A flexible
 hydrometeorological relations that are pertinent to bayesian approach to bias correction of radar-derived pre-
 hydrological applications in the southern region and cipitation estimates over complex terrain: model design and
 also capable of adapting to the other parts of initial verification,” Journal of Hydrometeorology, vol. 20,
 Thailand. Relationships presented are subject to no. 12, pp. 2367–2382, 2019.
 modification as additional data are collected in the [11] Y. Gou, Y. Ma, H. Chen, and J. Yin, “Utilization of a C-band
 heavy windy rainstorms, and further research is polarimetric radar for severe rainfall event analysis in complex
 conducted. terrain over eastern China,” Remote Sensing, vol. 11, no. 1,
 p. 22, 2019.
 [12] W. Woodley and A. Herndon, “A raingage evaluation of the
Data Availability miami reflectivity-rainfall rate relation,” Journal of Applied
 Meteorology, vol. 9, no. 2, pp. 258–264, 1970.
All data used in the study are included in the manuscript. [13] R. Suzana and T. Wardah, “Radar hydrology: new Z/R re-
 lationships for Klang river basin, Malaysia,”vol. 8, pp. 248–
Conflicts of Interest 251, in Proceedings of the Radar Hydrology: New Z 2011
 International Conference on Environment Science and Engi-
The authors declare that they have no conflicts of interest. neering IPCBEE, vol. 8, pp. 248–251, IACSIT Press, Singapore,
 March 2011.
 [14] A. M. Hashem Albar and A. K. AL-Khalaf, “Radar rainfall
Acknowledgments estimation of a severe thunderstorm over jeddah,” Atmo-
 spheric and Climate Sciences, vol. 5, pp. 302–316, 2015.
The authors gratefully acknowledge the Department of Royal
 [15] Y. Ma, Y. Zhang, D. Yang, and S. B. Farhan, “Precipitation
Rainmaking and Agricultural Aviation (DRRAA), Bangkok, bias variability versus various gauges under different climatic
Thailand, TMD, and HII for supporting the radar data sets conditions over the Third Pole Environment (TPE) region,”
and rain gauges through this research. The authors also International Journal of Climatology, vol. 35, no. 7,
appreciate the Royal-Rainmaking Atmospheric Observation pp. 1201–1211, 2015.
Group for much helpfulness and providing the radar data [16] S. Kirtsaeng and P. Chantraket, “Investigation of Z-R rela-
sets and weather observation data used in this study. tionships for monsoon seasons over southern Thailand,”
 Applied Mechanics and Materials, vol. 855, pp. 159–164, 2017.
 [17] S. L. Barnes, “Report on a meeting to establish a common
References
 doppler radar data exchange format,” Bulletin American
 [1] P. Chantraket, C. Detyothin, and A. Suknarin, “Radar Meteorological Society, vol. 61, pp. 1401–1404, 1980.
 reflectivity derived rain-storm characteristics over northern [18] M. Dixon and G. Wiener, “TITAN: thunderstorm identifi-
 Thailand,” EnvironmentAsia, vol. 6, pp. 24–33, 2013. cation, tracking, analysis, and nowcasting—a radar-based
 [2] P. Chantraket, S. Kirtsaeng, C. Detyothin, A. Nakburee, and methodology,” Journal of Atmospheric and Oceanic Tech-
 K. Mongkala, “Characteristics of hailstorm over northern nology, vol. 10, no. 6, pp. 785–979, 1993.
 Thailand during summer season,” EnvironmentAsia, vol. 8, [19] J. T. Johnson, P. L. MacKeen, A. Witt et al., “The storm cell
 pp. 101–114, 2015. identification and tracking algorithm: an enhanced WSR-88D
Mathematical Problems in Engineering 11

 algorithm,” Weather and Forecasting, vol. 13, no. 2,
 pp. 263–276, 1998.
[20] R. J. Potts, T. D. Keenan, and P. T. May, “Radar characteristics
 of storms in the sydney area,” Monthly Weather Review,
 vol. 128, no. 9, pp. 3308–3319, 2000.
[21] R. A. Fulton, J. P. Breidenbach, D. J. Seo, D. A. Miller, and
 T. O’Brannon, “The WSD-88D rainfall algorithm,” Weather
 Forecasting, vol. 13, pp. 377–395, 1988.
[22] C. W. Ulbrich and L. G. Lee, “Rainfall measurement error by
 WSR-88D radars due to variations in Z-R law parameters and
 radar constant,” Journal of Atmospheric and Oceanic Tech-
 nology, vol. 16, pp. 258–264, 1999.
[23] A. Seed, L. Sirivardena, X. Sun, P. Jordan, and J. Elliot, “On the
 calibration of Australian weather radars,” Technical Report
 02/7, Cooperative Research Centre for Catchment Hydrology,
 Melbourne, Australia, 2002.
You can also read