Radically Reducing Plastic Pollution in Indonesia: A Multistakeholder Action Plan National Plastic Action Partnership - Insight Report - Global ...
←
→
Page content transcription
If your browser does not render page correctly, please read the page content below
Insight Report

Radically Reducing Plastic
Pollution in Indonesia:
A Multistakeholder Action Plan
National Plastic Action
Partnership
April 2020
Global Plastic Action Partnership in
collaboration with the Indonesia National
Plastic Action Partnership

World Economic Forum
91-93 route de la Capite
CH-1223 Cologny/Geneva
Switzerland
Tel.: +41 (0)22 869 1212
Fax: +41 (0)22 786 2744
Email: contact@weforum.org
www.weforum.org

© 2020 World Economic Forum. All rights
reserved. No part of this publication may be
reproduced or transmitted in any form or by any
means, including photocopying and recording, or
by any information storage and retrieval system.
Content

Foreword                                                 4

Executive Summary                                        5

Chapter 1                                                8
From concern to crisis – plastics in Indonesia now and
in the future

Chapter 2                                                17
Waking up to the challenge – case studies and
examples of emergent action in Indonesia

Chapter 3                                                19
Fast and purposeful – a System Change Scenario

Chapter 4                                                30
Five action points – a comprehensive policy and
industry action roadmap for Indonesia

Appendix                                                 34
Key analytical assumptions and limitations

Acknowledgements                                         37

Endnotes                                                 39

                                                              3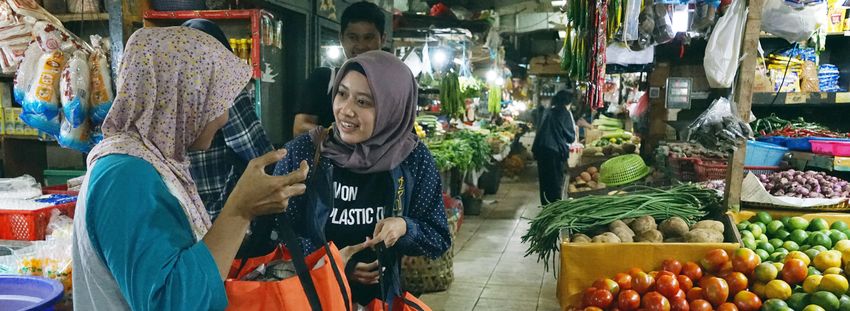
Foreword

                   How Indonesia plans to tackle its plastic
                   pollution challenge1

                   What will it take to end plastic pollution within a generation? For Indonesia, it all began with a radical vision.

                   Our beautiful nation is grappling with a serious plastic pollution challenge. We are home to the world’s
Luhut Binsar       largest archipelago – more than 17,000 islands, 81,000 kilometres of coastlines and a rich abundance
Pandjaitan,        of biodiverse marine ecosystems. Our pristine natural environment is a gift that we have treasured for
Coordinating       thousands of years and one that we must pass down to future generations.
Minister for
Maritime Affairs   At the same time, the amount of plastic waste generated in Indonesia each year is growing at
and Investment,    unsustainable levels. In our cities, our waterways and our coastlines, the accumulation of toxic plastic
Republic of        waste is harming our food systems and the health of our people. Our booming fishing industry, the
Indonesia          second largest in the world, is under threat from rising levels of marine plastic debris. By 2025, the
                   plastic waste leaking into our oceans could increase to 780,000 tonnes per year – if no action is taken.

                   I’m proud to announce that Indonesia will be choosing not what is easy, but what is right. Rather than
                   staying with a “business as usual” approach, we will be embracing a sweeping, full-system-change
                   approach to combatting plastic waste and pollution, one that we hope will spark greater collaboration
                   and commitment from others on the global stage.

                   At the World Economic Forum’s Annual Meeting in Davos earlier this year, we presented to the world a
                   first look at Indonesia’s new plan for tackling plastic pollution, which aims to cut marine plastic leakage
                   by 70% within the next five years. This report, developed for the National Plastic Action Partnership,
                   forms the basis of that plan.

                   The vision goes even further: by 2040, we aim to achieve a plastic pollution-free Indonesia – one that
                   embodies the principle of the circular economy, in which plastics will no longer end up in our oceans,
                   waterways and landfills, but will go on to have a new life.

                   Indonesia’s unprecedented national effort to take on plastic pollution is crossing a new frontier in what is
                   possible. Working from the basis of a radical idea, we have created a platform – the Indonesia National
                   Plastic Action Partnership – to mobilize willpower from all sectors and identify a clear path towards our
                   goal to show that plastic pollution is not too complex or too enormous a challenge to overcome.

                   As we move from incubation to implementation in the months to come, I invite all to join us on this
                   journey. As Indonesia puts this plan into action, we look forward to sharing our knowledge and to
                   learning from others on bringing solutions and successes to scale. Together, we will demonstrate how
                   we can work together to end plastic pollution and build a healthier, more sustainable future for our
                   children and grandchildren.
        4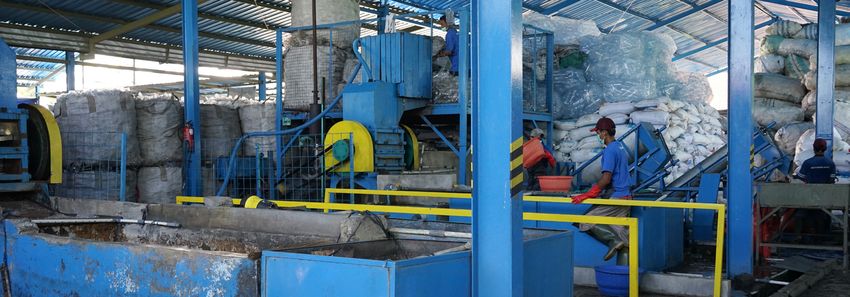
Executive Summary

Indonesia faces a mounting plastic pollution crisis.    The actions presented are deeply rooted in
Plastics are valued materials with a key role in the    Indonesia’s first comprehensive and fully costed
economy, and the nation generates around 6.8            analysis of the topic. This analysis is adapted
million tonnes of plastic waste per year, a figure      from global research by the Pew Charitable Trusts
that is growing by 5% annually. Despite major           and SYSTEMIQ4 and was carried out with the
commitments from government, industry and civil         NPAP Indonesia Expert Panel, NPAP Indonesia
society, the flow of plastic waste into the country’s   Steering Board, Indonesian Government and
water bodies is projected to grow by 30%                other stakeholders.
between 2017 and 2025, from 620,000 tonnes
per year to an estimated 780,000 tonnes per year.2      Key insights

National Plastic Action Partnership                     Urgent action is needed to turn the tide of
                                                        plastic waste and pollution in Indonesia
Recognizing the urgent need to take bold,
unprecedented action on plastic pollution,              Seventy percent of Indonesia’s plastic waste,
the Government of Indonesia collaborated                an estimated 4.8 million tonnes per year, is
with the Global Plastic Action Partnership – a          considered mismanaged in ways such as being
multistakeholder initiative set up by the World         openly burned (48%), dumped on land or in
Economic Forum – to launch the Indonesia                poorly managed official dumpsites (13%), or
National Plastic Action Partnership (NPAP) in early     leaking into waterways and the ocean (9%, or
2019. This initiative complements many actions          620,000 tonnes of plastic waste).
and initiatives currently underway in Indonesia to
reduce plastic pollution, led by national and sub-      Despite a sharp growth in foreign waste imports
national governments, businesses, academia,             in 2018, more than 95% of plastic pollution
non-governmental organizations, community and           comes from waste generated within Indonesia.5
religious groups – outlined further in Chapter 2.       Mismanaged plastic waste pollutes the
The NPAP supports Indonesia’s National Action           ecosystems and harms tourism and fisheries.6
Plan on Marine Debris, the Indonesian National          Open burning of plastic waste releases harmful
Waste Management Policy and Strategy (Jakstranas        substances to the air. It is even in the food we
and its subnational equivalent Jakstrada) and other     eat: plastic debris was found in 55% of sampled
efforts towards achieving a 70% reduction in the        fish species in the market of the city of Makassar.7
nation’s marine plastic debris by 2025.3
                                                        The situation is expected to worsen in the next years.
Near-zero plastic pollution by 2040

This report presents an ambitious set of actions
for Indonesia to deliver on this ambitious goal and     This report includes a business-as-usual scenario
ultimately achieve near-zero plastic pollution by       that estimates plastic pollution will increase by one-
2040. It envisions a sweeping System Change             third to 6.1 million tonnes in 2025 and will more than
Scenario that encompasses priority actions              double in 2040 – even if plastic waste collection rates
needed across the plastics ecosystem, including         keep pace with growing waste generation.
reduction in avoidable plastic use, materials
innovation, waste recovery, recycling and disposal.
                                                                                                             5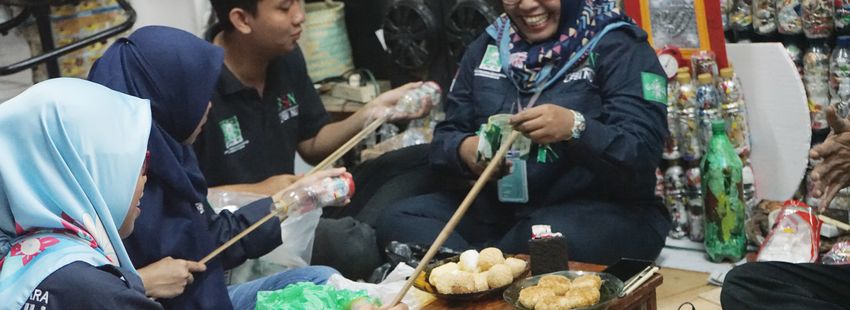
Solutions must be differentiated by geography          – Double current recycling capacity by
and type of plastic                                      building or expanding plastic sorting and
                                                         recycling facilities to process an additional
Around 72% of plastic pollution originates
                                                         975,000 tonnes per year of plastics by
in rural regions and small- to medium-sized
                                                         2025. To achieve this, large-scale recycling
cities. The mismanagement of plastic waste
                                                         hubs need to be strengthened in Java and
is a domestic challenge – one that requires
                                                         developed in urban centres outside Java.
substantial action and policy change from the
local level to fuel momentum nationally. There is
                                                       – Build or expand controlled waste-disposal
also a notable difference among different types
                                                         facilities to safely manage an additional
of plastic. Rigid plastics, such as polyethylene
                                                         3.3 million tonnes of plastic waste per year
terephthalate (PET) bottles, have a higher value
                                                         by 20259 for the disposal of non-recyclable
for recyclers and cause less pollution, particularly
                                                         plastics, and plastic waste generated in
in more urban areas. However, some flexible
                                                         locations without recycling facilities. A step up
plastics, particularly those made of multiple
                                                         in enforcement of illegal waste burning and
layers of different materials, cannot be recycled
                                                         dumping is required to limit pollution in areas
economically; they form about three-quarters of
                                                         that have collection.
the plastic waste leaking into nature.

                                                       Delivering this 70% ocean leakage reduction
Action and investments are needed across
                                                       scenario from 2017 to 2025 requires a total
the entire plastic system
                                                       capital investment of $5.1 billion and an
The System Change Scenario (SCS) combines              operational funding budget of $1.1 billion/year
five system changes that would together reduce         in 2025, in order to run an effective waste-
ocean leakage in Indonesia by 70% by 2025.             management and recycling system.10

– Reduce or substitute plastic usage to                A circular and pollution-free plastics system
  prevent the consumption of more than a               by 2040 can lower waste-system costs and
  million tonnes of plastics per year by 2025 by       maximize environmental and social benefits
  switching to reuse and new delivery models,
                                                       For 2017 to 2025, the SCS includes a projected
  changing behaviours and replacing plastics
                                                       acceleration of recycling, more than doubling
  with alternative materials that yield improved
                                                       current capacity. In this scenario, collection rates
  environmental outcomes.
                                                       grow even faster than recycling and there is a
                                                       large growth in controlled disposal of plastic
– Redesign plastic products and packaging
                                                       waste, a so-called “linear economy” solution.
  for reuse or high-value recycling with the
  ultimate goal of making all plastic waste a
                                                       The 2025 to 2040 period sees the acceleration
  valuable commodity for reuse or recycling.
                                                       of a second ambitious programme of action
                                                       – achieving “near-zero” pollution of plastics
– Double plastic waste collection from 39%
                                                       into nature and transitioning from a linear to
  to more than 80% by 2025 by boosting
                                                       a circular economy. This transformation will
  state-funded and informal or private sector
                                                       decouple economic growth from plastic use
  collection systems. This implies expanding
                                                       through reduction and substitution and spur a
  plastic waste collection to four million new
                                                       radical increase in plastic-recycling rates through
  households each year until 2025.8 Give priority
                                                       better product design and system changes (from
  to medium and small cities as these represent
                                                       around a 10% recycling rate today to more than
  three quarters of plastic pollution.
                                                       40% in 2040, measured as the share of plastics
                                                       actually recycled into new materials).

6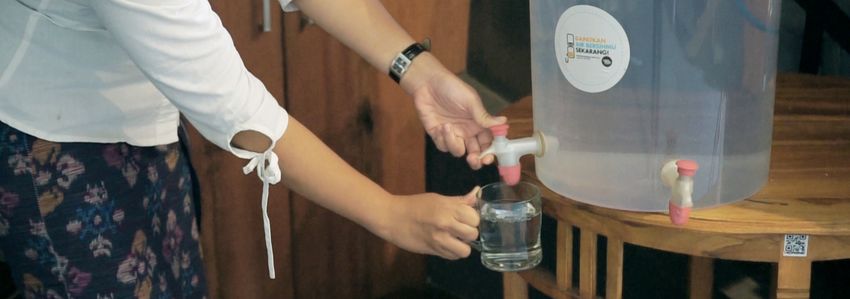
In addition to preventing an additional           Delivering this scenario that eliminates ocean
16 million tonnes of plastic leakage into         leakage within a generation requires a total
waterways and the ocean by 2040, the SCS          capital investment of $13.3 billion between 2025
presented in this report is also expected         and 2040 and an operational funding budget
to accelerate progress towards a number           reaching $1.8 billion/year in 2040.
of targets set out in the UN Sustainable
Development Goals (SDGs), including:              Critical system changes can be unlocked
                                                  and enabled through a combination of policy
– Curbing 20 million tonnes of greenhouse-        changes, financial investments, industry
  gas emissions per year (27% less than 2017      leadership and public engagement
  emissions) through reduced waste burning
                                                  Indonesia is increasingly recognized globally for
  and increased recycling
                                                  its leadership in addressing plastic pollution.
– Creating more than 150,000 direct jobs
                                                  Chapter 4 provides a ten-point action plan for the
– Improving public health outcomes by
                                                  ambitious and coordinated multistakeholder effort
  reducing air pollution, improving solid waste
                                                  that is urgently needed to enable system change,
  management and mitigating the risk of
                                                  end plastic pollution and establish a best-in-class
  flooding due to blocked drains
                                                  model for other countries to follow.
– Advancing gender equality and social justice
  for women, migrants and poor communities
  who are at higher risk for harm and
  exploitation
– Yielding economic benefits for local
  communities that derive livelihoods from
  fisheries or tourism

                                                                                                     7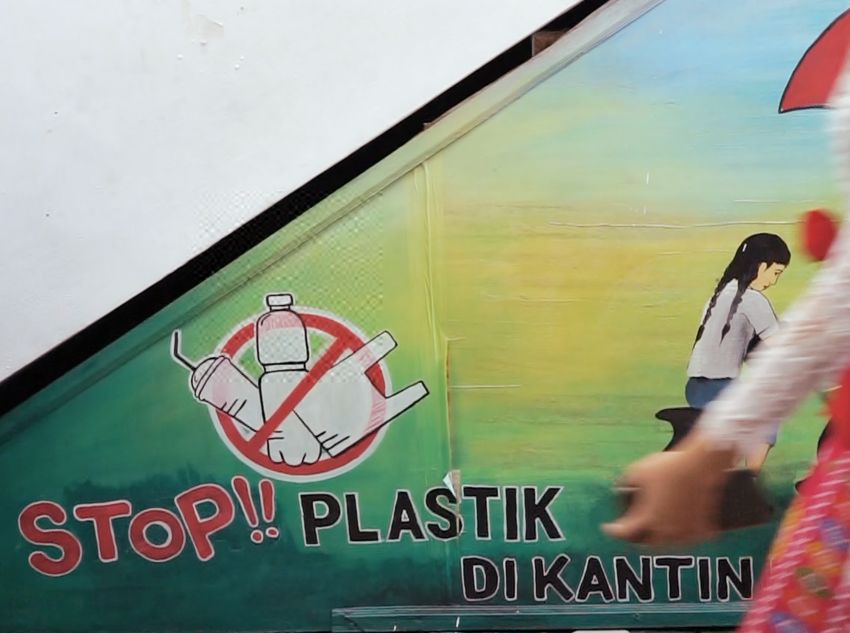
Chapter 1
From concern to crisis – plastics
in Indonesia now and in the future

This report covers plastics found in municipal         Not included in the above definitions is plastic
solid waste (MSW), which represents around 50-         waste generated at sea, such as discarded
70% of total plastics consumption in Indonesia.11      fishing nets and waste from ships. Maritime
Plastic packaging, carrier bags, cigarette butts,      sources of waste contribute significantly to ocean
diapers, toys and durable household goods              plastics (estimated at 10-30% worldwide).17
are examples of products containing plastics           Due to data limitations, the NPAP was not able
that become MSW after use.12 Plastic MSW               to model maritime waste for Indonesia. This
makes up the bulk of plastic waste generation          was also the case for plastic particles that are
and is over-represented in plastic pollution. The      generated by abrasion of tyres, washing of
remaining 30-50% of plastics has a longer use          synthetic textiles or discharge of micro-beads
period and consists of plastics used in cars and       in personal care products (known as primary
motorcycles, tyres, electronic appliances, textiles,   microplastics). When this report addresses
industrial processes, agriculture, fishing and         these topics, it does so based on research done
aquaculture and construction. For convenience of       elsewhere.
communication, we will refer to plastic MSW as
“plastic waste” from now on.                           What is the baseline situation for plastic
                                                       pollution in Indonesia?
Around 6.8 million tonnes of plastics became
plastic waste (MSW) in 2017. The NPAP has              The NPAP system model estimates that 620,000
calculated this using a so-called system model,        tonnes of plastic entered Indonesia’s waters
an analytical tool that estimates all the plastic      in 2017.18 Most plastics are not collected
flows in Indonesia, mostly using mass estimates        into a managed waste system after use (4.2
based on measurements in the waste system,             million tonnes, or 61% of plastic waste). This
reported by local governments.13 In contrast, the      leaves households and small businesses with
plastics industry reports a figure of 5.8 million      no other option than to dispose of them in an
tonnes of plastics as produced or imported             environmentally harmful way: 78% of uncollected
into Indonesia.14 Unfortunately, statistical           plastic waste is burned by households, often
discrepancies are still common and can only be         close to homes, 12% of it is discarded into
solved by improving reporting and monitoring           bodies of water and 10% is dumped on land or
waste statistics.                                      buried and can then end up in bodies of water
                                                       through rainwater runoffs. Much larger volumes
Plastic consumption grew by 5% per year                are burned by households, often close to homes
between 2012-2016, at a rate similar to                (about 78% of uncollected plastic waste).
Indonesia’s gross domestic product (GDP)
growth.15 Since 2018, Indonesia has also
become a net importer of plastic waste, which
adds some 220,000 tonnes from abroad (3%) to
plastic waste.16

8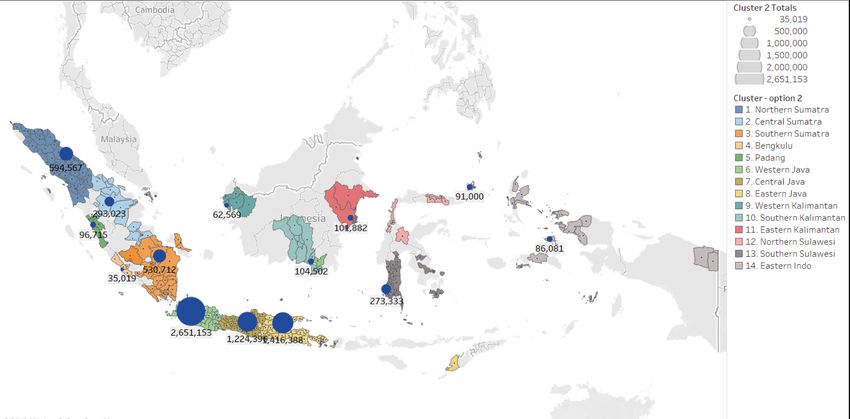
Figure 1: Where Indonesia’s plastic waste ends up today (percentage of total plastic waste generated)

                                                 6.8Mt                    6.8Mt
             recovery

                         Informal collection      7%
              Informal

                                                                           10%        Recycling
                           Landfill recovery      8%
collection

                                                                           20%        Managed disposal
 Formal

                          Formal collection      24%

                                                                           9%         Dumpsites
                                                                                                                  Managed waste             2.0 million tonnes

                                                                                                                  Other plastic pollution   4.2 million tonnes
                                                                           47%        Open burning
                              No collection      61%
                                                                                                                  Leakage into sea, lakes
                                                                                                                                             620,000 tonnes
                                                                                                                  and rivers

                                                                           5%         Dumping on land
                                                                                      Leakage into
                                                                           9%         sea, lakes and rivers
                                               Collection               Destination

Source: NPAP analysis

                     Of the plastic waste that is collected, most                           The huge contribution of the informal sector
                     is handled by local governments (2.1 million                           to preventing plastic pollution has largely
                     tonnes, or 32% of total plastic waste). Nearly all                     gone unrecognized and waste pickers often
                     of this waste is combined with other household                         work for low pay in unsafe conditions.
                     waste streams and goes directly to landfills or
                     official dumpsites19 without sorting of waste                          Of the 1 million tonnes of plastic waste that the
                     at households or in the collection system. We                          informal sector collects for recycling, around
                     estimate that government-run sorting centres                           700,000 tonnes are transformed into recycled
                     (TPS3R) process around 1% of waste collected.                          plastic; the remaining 300,000 tonnes are
                     Approximately 8% of plastic waste that is                              eventually disposed of due to yield losses in
                     collected by local governments is brought to                           the sorting and recycling process, such as after
                     uncontrolled official dumpsites from where it can                      contamination with organic material.
                     leak into the environment, including into water
                     bodies. As of early 2020, Indonesia does not                           This puts Indonesia’s plastic recycling rate
                     have commercial-scale incineration or waste-to-                        at around 10% of the total 6.8 million tonnes
                     energy facilities, but several are planned.                            of plastic waste generated (measured as a
                                                                                            percentage of plastic waste that is actually
                     The informal sector (including waste pickers, junk                     recycled into new plastic). Of recycled plastics,
                     shops and aggregators) plays a critical role in                        around 85% are processed in a way that makes it
                     collection. This sector collects around 500,000                        difficult to recycle the product again. An example
                     tonnes of plastic waste (7% of total plastic waste)                    of this are PET bottles recycled into textiles, or
                     directly from residential areas and 560,000                            mixed plastics.
                     tonnes of plastics (8% of the total) from collected
                     waste that is in transit to landfill and from landfills
                     themselves.20 Nearly all waste collected by the
                     informal sector ends up at a recycling facility.

                                                                                                                                                  9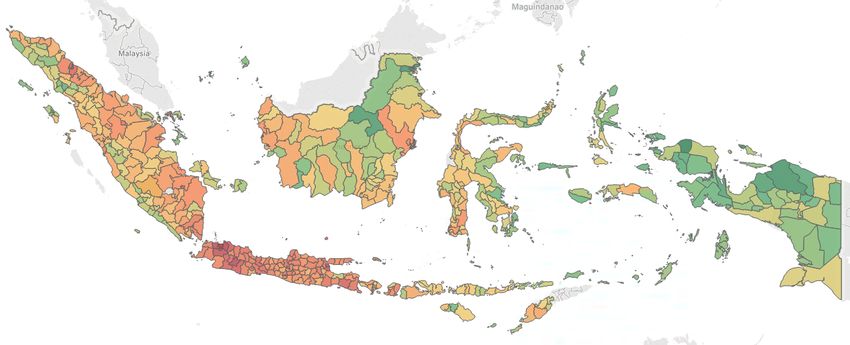
Box A: Regional diversity and analysis of sources of mismanaged waste in Indonesia

With 17,000 islands spread over more than 5,000km, Indonesia’s regional diversity is among the highest in the world.
To capture some of this diversity, the NPAP system model splits Indonesia’s regencies and cities into four groups or
archetypes and runs all analyses separately for each archetype.

Figure 2: Geographic archetypes used in the NPAP system model and System Change Scenario

                                                          Archetypes
                                                                        >1m inhabitants, population density >2,500
                                                            1: Mega     Potential to grow into recycling hubs
                                                                        Population density >1,500 cap/km2
                                                            2: Medium   Ideal to aggregate larger waste volumes from neighbouring cities
                                                                        Adjacent to archetype 1 and 2
                                                            3: Rural    Close enough to be economically shipped to neighbouring hubs
                                                                        Not properly connected to larger cities
                                                            4: Remote   Too small/far to be economically shipped to aggregating hubs

Source: NPAP analysis

The archetypes have large differences among them. We highlight three main differences:

1. Waste-generation volumes per person are highest in wealthier archetypes, particularly Mega-cities such as Jakarta,
   where consumption is 1.5 times higher than in Rural and Remote areas.21
2. Average plastic waste-collection rates are dramatically higher in Mega-cities: 74% compared to 20% and 16% in
   Rural and Remote areas respectively.
3. Informal sector workers (waste pickers and aggregators) are most active in and around large cities, as this is where
   recycling plants are concentrated and population density is highest. In contrast, in Remote areas of Indonesia, they
   play a very limited role in waste management.
4. Overall, this combination of factors means that an estimated 72% of mismanaged plastic waste comes from
   Medium and Rural archetypes in Indonesia (Figure 3). 64% of mismanaged plastic waste comes from Java, which is
   the most populous island (56% of Indonesians live in Java).

       10
Figure 3: The fate of all Indonesia’s plastic waste, in each archetype (million tonnes per year, 2017)
Medium & Rural:
~72% of
24% 26% 37% 13% mismanaged waste
1.6Mt 1.8Mt 2.5Mt 0.9Mt 6.8Mt
0%
5% 10% Recycling
12% 15%
20%
14%
20% Managed disposal
29%
9% Official dumpsites
3%
51% 64%
61%
48% Open burning
45%
3%
21% 8% 8%
5% Dumping on land
3%
12% 13% Leakage into sea, lakes and rivers
1% 7% 9%
4%
Mega Medium Rural Remote All Indonesia
Source: NPAP analysis
Figure 4: Total plastic waste generation in each City or Regency of Indonesia22
Highest
Lowest
Source: NPAP Indonesia analysis
The System Change Scenario (SCS) that is presented in Chapter 3 models different plastic flows for each of the four
archetypes. One insight is that improving waste management only in the two urban archetypes, Mega and Medium, is
not enough to achieve the targeted 70% reduction in ocean plastic leakage by 2025. Solutions must also be extended
to Rural and Remote parts of Indonesia.
11What are the effects of mismanaged Waste burning releases harmful substances
plastic waste on Indonesia’s people into the atmosphere. Around 5,600 tonnes of
and environment? particulates were emitted from burning plastics
in 201732 and are often emitted close to where
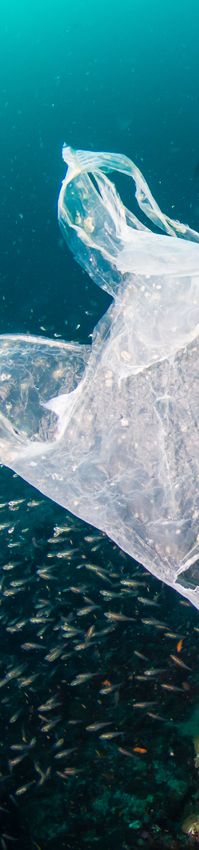
Ocean leakage affects more than 800 animal people live. Plastic burning also emits several
species in marine ecosystems around the tonnes of heavy metals (like lead, nickel,
world.23 A study in Makassar, the largest chromium and zinc) each year from the inks and
city in Eastern Indonesia, found that 55% of additives. These substances are carcinogenic
fish species in the market are contaminated and prolonged exposure increases the risk of
with microplastics.24 Through ingestion or cardiovascular diseases.33
entanglement, macroplastics can cause
mortality,25 injury and sub-lethal impacts26 Burning of polyvinylchloride (PVC) in particular is
and degrade into microplastics that are easily problematic because it releases dioxin emissions,
ingested by species throughout the food to which long-term exposure increases the risk
chain. At high concentrations (above current of hormonal disruptions, reproductive issues
environmental levels), microplastics can cause and immunotoxicity.34 Open burning of plastic
negative impacts on growth, health, fertility, waste is a source of greenhouse emissions that
survival and feeding in a range of invertebrate generated around 9.4 million tonnes of CO2-
and fish species.27 equivalent emissions in 2017 – the same as 2
million cars driven over a period of one year.35
Marine plastic pollution has a direct negative
impact on the 3.7 million Indonesians who
depend on wild fisheries for their livelihoods,
as well as more than a hundred million who
depend on them for protein.28 Plastics in coastal
waters and on beaches are a major concern for
the tourism industry, which employs 13 million
Indonesians.29 On land, poor management of
plastic waste exacerbates flooding in big cities
by clogging drainage systems30 and may have
contributed to major floods that struck the capital
Jakarta in January 2020.31
12Box B: Plastics, gender and marginalized groups
A gender perspective is critical for understanding the plastic pollution
challenge in Indonesia, and for designing effective solutions. Indonesian
women play a greater role in making household purchasing decisions
and in day-to-day management of waste in most households.36 They
are also more exposed to the negative effects of plastic pollution,
such as through direct exposure to emissions from waste burning or
dumping. Safe exposure levels to chemicals are often lower, since
women have a higher proportion of body fat, which provides a greater
reservoir for materials that can accumulate in the body.37
Jobs in government-run waste management are predominantly held by
men, even though waste sorting is often handled by women workers.38
Female workers in the informal sector waste system are exposed to
health and safety risks, workplace violence and discrimination.39
The critical role of women in designing and implementing solutions
is increasingly being recognized by society. Women are playing a
larger role as volunteers in community waste banks, and mobilization
campaigns activated through women’s associations and networks serve
as examples for effective community engagement. Women also self-
report adhering more frequently to proper disposal behaviour, whereas
men confess to littering more.40
Gender perspectives on solid waste management and informal-sector
waste systems are the subject of numerous studies and initiatives, for
example:
– Ocean Conservancy and GA Circular (2019), The Role of Gender
in Waste Management: Gender Perspectives on Waste in India,
Indonesia, The Philippines and Vietnam
– WIEGO Gender and Waste Toolkit41
– USAID Women’s Economic Empowerment and Equality (WE3)
Technical Assistance Project42
Marginalized groups are more exposed to plastic pollution
The negative impact of plastic pollution also falls disproportionately on
the shoulders of marginalized communities. For example, Indonesians
living without an official land title are less likely to be served by
government-run collection and thus more exposed to the effects of
waste burning. They are also more likely to suffer from flooding caused
by waste blocking drains. In 2018, an average year, floods affected over
1.5 million Indonesians.43
___________________________________________
Source: Kartini International and the sources referenced
13What are the root causes of plastic – Decentralized and fragmented governance
pollution in Indonesia? and accountability for waste management
across multiple levels of local government.
Plastic pollution in Indonesia has three In some areas, accountability is delegated to
interconnected root causes: the village level or even lower, with challenges
of sub-scale economics and a shortage of
1. Underdeveloped and underfunded solid technical knowledge and implementation
waste-management systems with low capacity.
waste-collection rates, resulting in open
burning or dumping of plastic waste. Where – Low investment from local government, due
plastic waste is collected, waste systems to multiple competing demands on annual
very rarely have segregation of recyclables. budgets (e.g. road construction, education,
This leads to high contamination rates, lower healthcare and irrigation infrastructure). This
value for recycling and higher chance of is compounded by the absence of a common
post-collection leakage. system that would enable households to
efficiently and consistently pay for waste-
2. Avoidable and problematic uses of management services, such as through
plastics, such as the use of excess plastics their electricity bills, a practice that has been
in packaging of goods or unnecessary use implemented in several other countries.
of problematic materials that yield negative
environmental impacts. – Institutional and technical capacity
gaps and under-developed monitoring
3. Low or no after-use value for many types and information systems, which make it
of waste plastics relative to other recyclable challenging to enforce policy and incentivise
materials, such as aluminium cans, and good practices.
relative to the time taken for collection of
many plastic waste items, which limits the – Shortage of suitable land for waste facilities.
amount of plastic waste that the informal/
private sector is able to economically collect – Limited options to valorize organic waste
and recycle. in the Indonesian context, where chemical
fertilisers are subsidized. Organic waste
1. Under-developed and under-funded solid represents more than 60% of total weight in
waste-management systems the municipal waste stream and is a major
driver of the costs of running a full waste-
Only 39% percent of waste is collected in
management system.
Indonesia. This is equivalent to 160 million
Indonesians,44 about the population of
Bangladesh, having no or only partial access to
plastic-waste collection in their communities.
They often have no choice but to dispose of their
plastic waste in an environmentally harmful way.
Translating national policies for solid waste
management into improved practices at the city
level is challenging due to several interconnected
factors, including:
142. Avoidable and problematic uses of waste but disintegrate quickly into microplastic
plastics particles and are considered to have a worse
impact on ecosystems and recycling systems
Plastics are lightweight, affordable, easy-to-use,
than standard plastics.45
strong and flexible materials with many valuable
applications. Plastics play an important role in
3. Low or no after-use value
keeping food safe, medical equipment sterile and
fuel consumption low, due to their light weight High value packaging materials such as
compared to alternative materials. However, aluminium cans (around $800 per tonne in East
some of the current uses of plastics are avoidable Java in 2019) are rarely found polluting the
or problematic, leading to unnecessary waste environment even when there is not an effective
and pollution. solid waste-management system in place; they
are viewed as too valuable for disposal.
Avoidable plastics can be illustrated by
overpackaging in e-commerce electronic However, many forms of plastic waste have low
products whose primary packaging is designed or zero value in the recycling market and are time-
for transport, that are repackaged with a consuming to collect. For example, small sachets
secondary layer of packaging with the same or wrappers made from multilayer plastics have
function. Other examples of avoidable plastics very low market price for recyclers (less than
use include the practice of selling drinks in plastic $50 per tonne in the few locations where there
cups even when durable mugs are available, as is demand (East Java, 2019)), and it takes many
well as serving guests individual polypropylene days to collect 1 tonne. As a consequence,
(PP) cups of water, even when the same water is the informal/private collection system and the
available from a refill tank. recycling industry focus on the highest-value
materials in the most high-density areas (e.g.
Problematic plastics include those that impose clean plastic waste from commercial and
proven negative effects on human health when industrial sources, and post-consumer bottles
burned, such as PVC in packaging. It also and containers made from PET and rigid HDPE),
includes so-called oxo-degradable plastics that and other plastics seen as less valuable are more
have been marketed as a solution for plastic likely to leak into the environment (Figure 5).
Figure 5: Mismanaged plastic waste by plastic type: flexibles represent ~76% of plastic pollution
(million tonnes per year in 2017)
Flexibles:
~76% of pollution
Mega 0,1 0,2 0,1 0,5
Medium 0,3 0,5 0,2 1,1
Rural 0,7 1,1 0,6 2,4
Remote 0,3 0,4 0,2 0,9
30% Flexible multilayer
46% Flexible monolayer
24% Rigid
Source: NPAP analysis
15After-use value starts with the design process. This increase is driven by two factors:
International eco-design guidelines have been
developed to improve the after-use value of plastic – Population growth, from 260 million people in
products and packaging. To give one example, 2019 to 310 million people in 2040
colour pigments used in plastic packaging – Economic growth, which is projected to
contaminate the recycling process and lead to a increase waste per person by 38% in 2040
lower value output, compared to clear or natural- versus today as well as the proportion of
coloured packaging. Overall, it has been estimated plastics compared to other types of waste
that packaging design improvements could such as organics, because consumers tend
increase average after-use value by $90-140 per to buy more goods packaged in plastic when
tonne of mixed plastics collected for recycling.46 their income increases
Limited access to plastic recycling facilities also
limits after-use value in many parts of Indonesia. Figure 6: Handling of plastic waste if collection
Today, recycling hubs are concentrated in only a rates stay at 39% (million tonnes)
limited number of geographies and one-third of
plastic waste is generated in so-called “recycling 14
deserts”, areas in which no recycling plant is Collection and Recycling
12
available within a reasonable commercial range47
Collection and Disposal
(Box C). 10
Collection and Official Dumpsite
What future scenario is projected for 8
plastic waste in Indonesia, without 6
ambitious action on solutions? Open burning
4
Plastic waste generation is projected to Dumping on land
2
grow from 6.8 million tonnes in 2017 to 8.7 Leakage to
body of water
million tonnes in 2025. If current rates of 0
2017 2025 2040
plastic waste collection and treatment are
simply maintained in line with increasing
waste generation, leakage of plastics into
Indonesia’s water bodies is projected to Figure 7: Business-as-usual projection vs.
increase from 620,000 to 780,000 tonnes per System Change Scenario
year from 2017 to 2025 (+30%) and more than
double to 1.2 million tonnes per year 1.4
by 2040.48 1.2
Business-as-usual
scenario
1.0
+100%
0.8
+30%
0.6
0.4 -70% Government target
-100%
0.2
System Change Scenario
0.0
2020 2025 2030 2035 2040
16Chapter 2
Waking up to the challenge – case studies and
examples of emergent action in Indonesia
Single-use plastic reduction New business model Material Innovation Innovation & informal sector integration
1 Banjarmasin is the first city in Indonesia to successfully restrict plastic bags, following an 5 ! MUUSE in Bali operates a deposit-based platform 8 ! Evoware, has developed edible seaweed-based food 11! Gringgo, founded in 2015 in Bali, developed a digital platform
extensive communication period to gain buy-in from businesses and the community. where restaurants and consumers can rent reusable wrapping to connect waste workers with households using route
Government promotes the use of a locally produced traditional basket food containers and cups for take-away orders analysis to increase collection efficiency
2 MAP Group, a leading retail company with more than 2,000 outlets across the country (e.g. 6 Bulk stores are emerging across Indonesia, 12 Waste4Change and EcoBali privatize waste collection and
Starbucks, Burger King) commits single-use to replace plastics cups and cutlery, and charge a especially in cities such as Jakarta, Bandung, Redesign for recycling employ former waste pickers as collection and sorting
workers in an improved working environment. Monthly reports
fee for plastic bags Yogyakarta, and Denpasar, offering packaging free
shopping to support zero-waste lifestyle 9 ! Nestlé switches to paper straws for its drinks cartons are provided to increase customer awareness
3 BlueBird Group, a company that operates 25,000+ taxis, works together with WWF to eliminate
the cups and bottles used daily by its drivers by providing tumblers and refill stations in taxi 7 Starting in 2015, Kecipir.com operates an online In 2019, Aqua launched Indonesia’s first plastic bottle 13 Smash, MallSampah, Obabas, and other start-ups are helping
10 digitize waste bank operations and connect them with the
pools platform in Jakarta that connects farmers and made of 100% recycled material in Bali and Jakarta.
3 By eliminating pigments and replacing labels by community
Nazava, the provider of a technology to filter rainwater and surface water into drinking water consumers, allowing sales and delivery of in-season
4 embossed text, the bottles are fully recyclable
organic vegetables with minimal packaging 14 Plastic Bank pays a premium price for collected plastics using
have sold over 150,000 products thus reducing the consumption of single-use water bottles, a “plastic offset” scheme funded by corporate clients
Nazava was originally founded to solve water shortage in Aceh post-tsunami
15 In September 2018, SecondMuse launched an incubator
network in Surabaya to accelerate solutions to ocean plastics
Nation-wide initiatives: 4
2 6 8 9 13 15 31 32 33 34 35 36 38
20
Jakarta:
3 7 10 16 17
Enabling activity and research
Waste management & recycling
32! The Coordinating Ministry for Maritime Affairs and Investment,
16! In 2016, Jakarta increased the salary of its waste World Bank, and GA Circular are developing best practices
1 and strategies into effective behaviour-change campaigns
workers, known as the orange army, resulting in
increased performance. The government monitors the Surabaya: 21 33 Nahdlatul Ulama, one of the largest religious organisations in
system by requiring each worker to send a daily report the world, has issued a detailed 76-page Islamic guidance on
via mobile phone pictures 18 27 28 29 25 proper plastic waste management
22 30
17 The Jakarta Environmental Agency in collaboration with 34 Indonesia Waste Platform, founded in 2015, connects over
19 22 1000 organizations and individuals to coordinate solutions for
Waste4Change, GBCI, and MVB Indonesia launched Bali: 26 waste management challenges
waste reduction initiatives for buildings and restaurants
in which best practices will receive awards 5 10 11 12 14 24 37
35 IPI, a waste picker association established in 1991, advocates
18 The Surabaya city government has improved the city better livelihood for waste pickers through access to national
waste management strategy by building sorting healthcare (BPJS). They introduced waste recycling zones
facilities, expanding waste banks, and implementing the Community and city level partnership Recycling technology (KPPS) in Greater Jakarta to better integrate the formal and
first plastic-for-bus tickets initiative. In early 2019, the informal sectors.
city was awarded Adipura Kencana, the highest clean 22! Project STOP in Muncar has implemented a zero-leakage collection system that covers ~50,000 28! Unilever CreaSolv® facility close to Surabaya 36 IP2WM, PRAISE, ADUPI are associations of plastics
city award residents for the the first time. STOP has expanded to Pasuruan, East Java and Jembrana, Bali recycles flexible and multi-material plastics manufacturers, consumer packaged goods, and recycling
29 Greater Surabaya will also be home to a industry with growing concern on plastic pollution that have
19 TPST Bakti Bumi in Sidoarjo has been equipped with a 23 In 2018, Bandung adopted The Zero Waste Cities programme, community-based waste management
bottle-to-bottle recycling facility built by been promoting and developing recycling technologies
sorting conveyor and plastic crusher to meet the 14% aiming to divert more waste from landfill through community engagement
waste reduction target set by the local government Danone in partnership with Veolia 37 Bali Partnership has carried out extensive research to build a
24 In Bali, Merah Putih Hijau is implementing a community partnership to improve solid waste management.
PRAISE and McKinsey.org recently launched the Desa Kedas programme to upgrade waste sorting 30 Plastic Energy™ has signed an MoU to build baseline data of plastic waste in Bali
20 A waste reduction strategy is scheduled to be piloted in
Lake Toba, North Sumatera, following partnership built facilities and stimulate household waste segregation five plants in West Java targeting to convert 38 LIPI and universities, such as ITB, Udayana, ITS, UI, Unhas,
between Indonesia and IGES-Japan 100,000 tons of plastic into fuel annually are pioneering research on plastic pollution data
25 Masaro, implemented in e.g. Cilegon, Banten, aims to create zero waste communities
21 Makassar has received the Adipura award three times with waste segregation and waste processing into compost and plastic-to-fuel products 31 Plastic-to-roads is being trialled in several
for its improvement in managing waste throughout the places, in a Chandra Asri and PUPR
26 Koperasi Serba Usaha, a local cooperative in Labuan Bajo, employs a trash bank model to attract people
17
city. It is driven by the community with support from the collaboration in Bali, Banten, and other areas
to participate in the system
government
27 Common Seas and PC Muslimat Surabaya, a women’s charity, have agreed to collaborate to tackle
diaper waste by piloting re-usable diaper and introduce new waste management service in the Brantas
riverThe social enterprise Nazava builds affordable filters for
drinking water, providing a reusable alternative to plastic
water bottles.
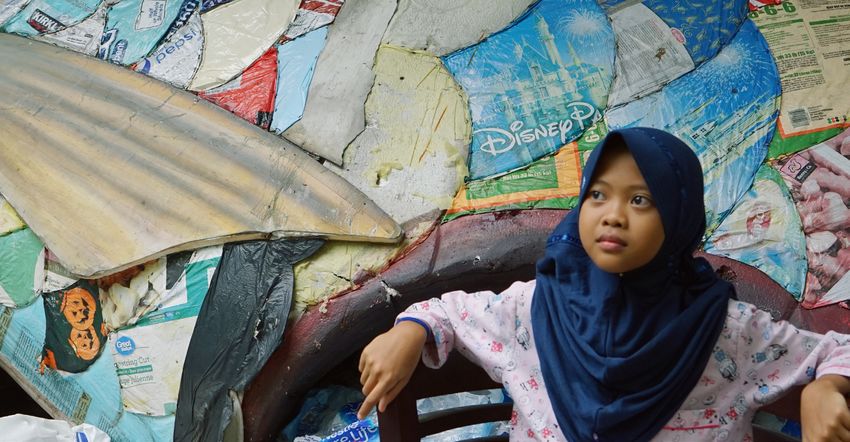
At the Jakarta headquarters of Nahdlatul Ulama, the largest
Islamic organization in Indonesia, workers turn plastic waste
into art and household products, such as stools.
A young campaigner with the NGO Indonesia Diet Kantong
Plastik (Plastic Bag Diet) persuades a shopper at Tebet
Market in Jakarta to exchange her plastic shopping bag for a
reusable one.
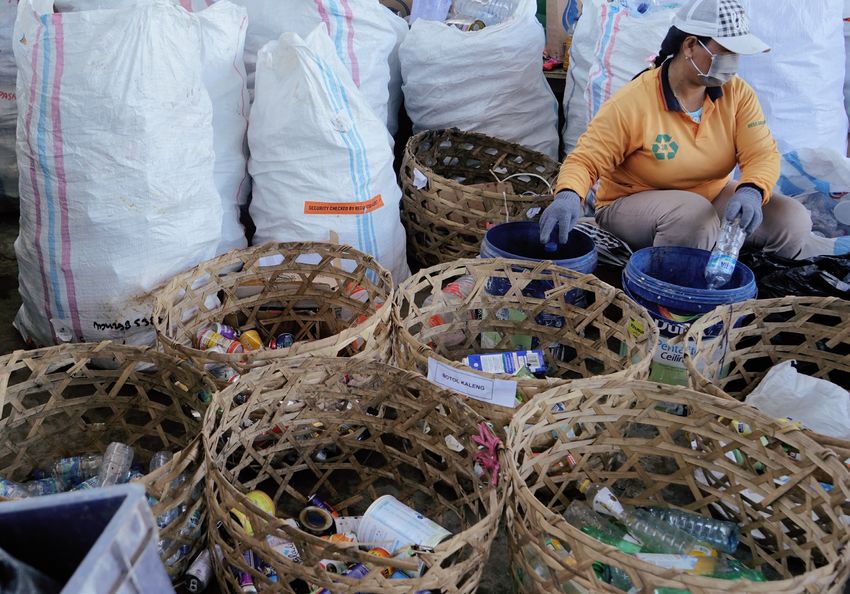
Workers prepare collected plastic waste for recycling at a
flaking and washing plant in Denpasar, Bali, supported by
Danone-AQUA.
18Chapter 3
Fast and purposeful – a System
Change Scenario
2020-2025: Reducing marine plastic 3. Double plastic waste collection from 39%
leakage by 70% through short-term to 84% by 2025 by boosting state-funded
interventions and informal or private-sector collection
systems.
In this chapter we present a “System Change
Scenario” (SCS) with a costed package of system 4. Double current recycling capacity to
changes that could collectively reduce ocean process an additional 975,000 tonnes per
plastic leakage in Indonesia by 70% from 2017 year of recycled plastic by 2025.
to 25. This scenario is based on an economic
model for plastic flows in Indonesia under 5. Build or expand controlled waste disposal
different scenarios, adapted from global research facilities to manage an additional 3.3 million
by the Pew Charitable Trusts and SYSTEMIQ.49 tonnes of plastic waste per year by 2025.50
The scenario was developed based on three The order of the system changes outlined above
key criteria: the impact and relative cost of reflects the “waste hierarchy” used by global
different system changes; the risk of unwanted policy-makers and investors such as the World
consequences for people and the environment; Bank (Figure 8).51
and expert opinions on the feasibility, technology
readiness and speed of implementation of
Figure 8: Alignment of System Change Scenario
different solutions.
with the Waste Hierarchy
The analysis indicates how a combination of
World Bank Waste Hierarchy System Change
system changes could achieve the 70% target Scenario
Most preferred option
but does not judge the overall feasibility of Reduce Reduce or substitute
plastic usage
delivering the scenario in the allotted time period. Reuse (includes reuse)
Recycle
The SCS consists of five system changes: Recover
Recycle
(digestion, composting)
Landfill
1. Reduce or substitute plastic usage to
Dispose
prevent the consumption of more than a Incineration (with energy recovery)
million tonnes of plastics per year by 2025. Controlled Dump
Least preferred option
2. Redesign plastic products and packaging
Source: World Bank
for reuse or high-value recycling.
19Figure 9: Fate of MSW plastic waste in “business as usual” scenario and SCS (million tonnes per year)
Plastic waste generation, million ton/year, Indonesia
Business-as-usual if collection rates stay constant at 39% System Change Scenario
9 9
Collection and Recycling Reduced
8 8
Substituted
7 Collection and Disposal 7
Collection and Recycling
6 Collection and 6
Official Dumpsite
5 5
4 4
Collection and Disposal
Open burning
3 3
Collection and Official Dumpsite
2 2 Open Burning
Dumping on land Dumping on land
1 1 Leakage to
Leakage to
body of water body of water
0 0
2017 2025 2017 2025
39% 39% 39% 86%
Collection rate Collection rate
Source: NPAP Analysis based on >50 public, private and academic publications, nearly all Indonesian (e.g. Jakstrada, BPS, PUPR)
1. Reduce or substitute more than a million 1. Evidence of R&S potential
tonnes per year of avoidable plastic use 2. Risk of unintended consequences for
by 2025 performance, health and food safety,
convenience or affordability
The SCS quantifies how much reduction and 3. Implementation time
substitution (R&S) is possible by 2025 through an
analysis of 15 types of plastic applications. Four Using this methodology, the SCS estimates that
R&S options are considered: 1.1 million tonnes per year of plastic consumption
(13% of projected plastic waste generation in
– Avoidance of use, such as plastic straws, 2025) can be reduced or substituted by 2025
stirrers, fresh fruit trays and tubs without compromising on performance, health
– Reuse, such as water bottles, shopping bags, and food safety, convenience or affordability.
and durable cutlery
– New delivery models, such as packaging-free 1.1 Reduction potential: 740,000 tonnes of
deliveries, refill from dispensers, and take- plastic use avoided in 2025
back services
Out of 15 screened product applications, five
– Substitution with non-plastic materials that
represent around 80% of the estimated reduction
have a better environmental impact, such as
potential:
internationally certified compostable materials
or paper-based materials used for certain
1. Carrier bags (8% of plastic waste) that are
applications
not used just for groceries, but often also for
direct food-contact applications in traditional
The SCS estimates the R&S potential based on
markets. The SCS points towards savings
three factors (see details in the methodological
of up to 40-50% (320,000 tonnes per year)
appendix):
of plastic bag waste by further encouraging
reusable and durable bags in the place of
unnecessary single-use bags.
202. Sachets and multi-material flexible Paper and coated paper are only considered
packaging (16% of plastic waste), which acceptable under strict conditions for land
is often used in small format goods (e.g. use and energy use. Metal and glass were not
shampoo, seasoning packs) to provide considered as substitute materials because of
a single-dose product for lower-income concerns about the life-cycle climate impact
consumers. The SCS estimates that new of these materials compared to plastics. The
delivery models that replace sachets and multi- SCS estimates that 370,000 tonnes per year
material flexible packaging with re-fills and of plastic consumption (4% of projected
packaging reuse systems can avoid 140,000 plastic-waste generation) can be avoided in
tonnes of plastic waste per year by 2025 2025 without compromising on performance,
(around a 10% reduction from 2017 volumes). health and food safety, environmental impact,
convenience or affordability.
3. Business-to-Business packaging (rigid and
flexible, 9% of plastic waste) is typically large- 2. Redesign plastic products and packaging
format packaging designed for bulk delivery
Plastics with low or zero value for recycling are
(e.g. shrink wrap and cooking oil containers
less likely to be picked up by waste pickers and
for restaurants). Businesses can reconfigure
more likely to pollute the environment. Design-
operating and business models to encourage
for-recycling (D4R) specifically takes the after-
reuse and build a collective returnable
use value of plastic products and packaging into
packaging network to prevent an estimated
account in the design process.
120,000 tonnes per year (around 10-20%) of
this type of waste.
To simulate the effect of design for recycling in
the NPAP Indonesia system model, the SCS
4. Bottles (food and non-food, around 8% of
assumes that 20% of non-recyclable (multi-
plastic waste). Using reusable water bottles
material) plastics are switched to recyclable
coupled with refill models and concentrated
formats by 2025. Doing so increases the volume
non-food goods point towards prevention
of recyclable materials by 470,000 tonnes per
of around 70,000 tonnes per year of bottle
year and is estimated to reduce loss rates in
waste (a reduction of 10 to 20%).
the recycling industry. The combination of these
measures leads to an improvement in recycling
1.2 Substitution potential: 370,000 tonnes of
rates and reduced plastic pollution.
plastic use avoided in 2025
Three substitutes for plastic are modelled to the 3. More than double the plastic-waste
gauge substitution potential: paper, coated paper collection rate from 39% to over 80%
and compostable materials. Specifically, this (2.7 to 6.2 million tonnes per year) by 2025
means:
A rapid increase in the plastic-waste collection
– Paper or cardboard materials, generally as a rate is central to the SCS. After all, households
replacement for plastic films without waste-collection services have no choice
– “Coated paper” with a coating that meets but to burn, bury or dump their plastic waste.
the criteria for technical recyclability52
– Internationally certified compostable The SCS projects that plastic-waste collection
materials used in locations that have suitable rates would need to more than double to 84%
after-use systems, such as certified home- to achieve the 70% ocean-leakage reduction
compostable materials where food-waste target by 2025. This could be achieved through
collection or home composting is supported an accelerated rollout of government-run waste-
and materials could be segregated from management systems (70% of the new collection
mechanical recycling in the SCS) and through incentives for the
recovery of more plastic waste by private/informal
collectors (30% of the new collection in the SCS).
21This incentive programme is incorporated in The SCS assumes that all recycling will take
the SCS because it could integrate informal- place in the form of mechanical recycling until
sector workers and enable a faster rollout of 2025 (cleaning and remoulding of plastics into
plastic-waste recovery, compared to reliance new products). Advanced (chemical) recycling
on local government agencies. An incentive technologies could play a bigger role after 2025,
programme of this nature would rely on proactive assuming that technological readiness, safety
approaches to improve working conditions in the and speed of deployment progress is managed.
informal sector, support legal and environmental These advanced recycling technologies could
compliance and enable mutually beneficial include pyrolysis, gasification, purification or
cooperation or integration between private/ depolymerization of plastic waste back into
informal and government-run waste systems. feedstocks that can be used to manufacture
recycled plastics. Plastic-to-fuel solutions are
Lessons from existing schemes in South Asia, classified in the NPAP Indonesia model as
Africa and Latin America can be referenced for “disposal” options.
good practices in this field.53
4. Double recycling rate by 2025
Increased waste collection and improved design
of plastic products and packaging would provide
more suitable feedstock for the recycling industry.
Construction or expansion of recycling facilities
will be needed to process these materials and to
provide the incentives for collection of plastic waste.
The SCS incorporates a doubling of recycling rate
from 10% to 22%, adding 975,000 tonnes so that
1.7 million tonnes are recycled in 2025.
Box C: Analysis of recycling catchments in Indonesia
Today, between 80% and 90% of recycling companies are concentrated on the island of Java,54 with a much smaller
concentration in Northern Sumatra. This leaves most of Indonesia’s land area (though not its population) too far from a
recycling plant to supply recyclable material under commercial conditions.
To understand the geographic challenges for plastic recycling in Indonesia, we defined 12-14 potential “recycling
catchments” in Indonesia centred on a major city, each able to cover a hinterland of around 400 km in distance without
obvious topographic barriers, from where we assume waste can be economically shipped to the hub.55
Viable economics for recycling depend on economics of scale and consistent feedstock supply. 300,000 tonnes
per year of total plastic-waste generation in a catchment was estimated as a minimum size for a viable plastic-waste
recycling hub, since a 50% recovery rate for recyclable plastics (one third of the total plastic waste) would generate
approximately 50,000 tonnes of recyclable plastics per year – suitable for one mid-sized recycling plant processing PET
and one plant processing polyolefin plastics (PE/PP).
This calculation could change if advanced recycling technologies are proven to accept a wider range of plastics, such as
flexible polyolefin plastics.
22Figure 10: Potential recycling catchments analysed (BAU plastic-waste generation, tonnes in 2025)
The recycling catchments clearly divide into three groups based on plastic-waste generation and logistics costs:
1. Catchments in Western, Central and Eastern Java, Northern and Southern Sumatra have volumes of over 500,000
tonnes of waste generation per recycling catchment (74% of national plastic waste by volume).
2. Marginal catchments in Central Sumatra and South Sulawesi56 have volumes of around 300,000 tonnes, which is
borderline for an economically viable recycling hub (7% of national plastic waste by volume).
3. Catchments in the rest of Indonesia have volumes of less than 220,000 tonnes (20% of national plastic waste by volume).
This analysis suggests that catchments in Western, Central and Eastern Java, Northern and Southern Sumatra are
commercially viable recycling hubs if the right enabling conditions are met. Central Sumatra and South Sulawesi would
require more support. Catchments in other parts of Indonesia are not likely to support commercially viable recycling
hubs and will require a different strategy for plastic-waste management, for example by supporting pre-processing and
shipping of plastic waste for recycling in other parts of Indonesia or elsewhere in the region. A prototype for this model
could be Labuan Bajo in East Nusa Tenggara, where this approach is being piloted by the government of Indonesia and
local government authorities together with industry and NGO partners.
5. Build or expand controlled waste disposal We define controlled disposal as any option for
facilities post-collection management of plastic waste that
does not recycle the material into a new material
Despite the ambitious projection for growth
or product, and operates within internationally
in recycling in the SCS, a substantial increase
accepted limits for health, environmental and
in controlled disposal capacity is needed to
social impacts. The word “controlled” is not
accommodate the extra volumes of additional
intended to mean that these options are harmless
plastic collected. To handle this, controlled
to people or the environment. Landfills are the
disposal capacity must be expanded to
only disposal option that operates at scale in
accommodate 3.3 million additional tonnes of
Indonesia today. For that reason, sanitary landfills
plastic waste per year in 2025.57
23are assumed as the controlled disposal option Figure 11: Comparison of circular vs linear
and used to estimate disposal costs in the SCS scenarios to reach near-zero leakage from
(for new landfill construction and operation). 2025 to 2040
It should be noted that most landfills currently
in operation in Indonesia require a substantial $2.3 billion 66 Mt
$23,8 135.3 Mt
improvement in sanitary practices; however,
$21,5
retrofitting of existing landfill facilities to meet
international standards is not included in the SCS
cost analysis.58 69.4 Mt
2025 to 2040: Transition from a mostly
linear “disposable” economy to a circular
plastics economy
Linear system System Change Linear system System Change
scenario Scenario scenario Scenario
From 2017 to 2025, the SCS includes an Collection, sorting and disposal Landfill burden
ambitious scaling up of recycling capacity in operating cost
Indonesia: more than doubling the amount
of plastics that are currently recycled. Yet as Source: NPAP analysis
collection rates need to grow even faster to bring
down plastic pollution, the SCS only meets the
70% ocean-leakage reduction target if it relies on The 2025 to 2040 SCS includes the following
so-called “linear-economy” solutions – plastic- system changes, summarized in Figure 12:
waste collection and disposal – to meet the 70%
ocean-leakage reduction target. 1. Reduce or substitute (R&S) around 6.5 million
tonnes per year of avoidable plastic use by
The 2025 to 2040 SCS sees the acceleration of a 2040:
second programme of action: achieving a “near-
zero” level of leakage of plastics into nature, and Reduction
transitioning the nation from a linear to a circular The consumption of 4.3 million tonnes per
economy. This transformation will decouple year of plastics could be avoided in 2040,
economic growth from plastic use through compared to projected growth in plastic-
reduction and substitution, as well as lead to a waste generation (31% of projected plastic-
radical increase in plastic recycling rates through waste generation in 2040). This could be
better product design and system changes. achieved through avoidance of use or reuse,
without compromising on performance,
environmental impact, health and food
safety, convenience or affordability.
The SCS projects that 2.8 million tonnes of plastic
recycling could be recycled in 2040, compared to an Substitution
estimated 680,000 tonnes in 2017. 2.2 million tonnes per year of plastics could
be substituted with known alternatives in
2040, compared to projected growth in
Compared to reliance on “linear economy” plastic-waste generation (16% of projected
solutions to reach near-zero leakage, this circular plastic-waste generation in 2040). This
economy scenario saves $2.3 billion in waste- could be achieved through substitution
management costs and avoids the disposal of 66 from plastics to internationally-certified
million tonnes of plastic into over-burdened landfill compostable materials or materials based on
facilities from 2025 to 2040 (see Figure 11). paper or cardboard, without compromising
on performance, health and food safety,
convenience or affordability.
24You can also read