Raman in the nuclear field Software advances for 4D-Proteomics Gold IS special: and needs special sampling - Informing European spectroscopists ...
←
→
Page content transcription
If your browser does not render page correctly, please read the page content below
Vol. 32 No. 6 December/January 2020

Informing European spectroscopists for over 40 years

Raman in the nuclear field
Software advances for 4D-Proteomics
Gold IS special: and needs special sampling
New from Wiley
Nanoparticle Analysis using
the Sensitivity of ICP-MS
This essential knowledge briefing provides an introduction to the use
of ICP-MS for nanoparticle analysis and how the technique works for
nanoparticles. The briefing advantages, as well as highlighting practical
applications. The briefing goes on to outline the parameters that affect
performance and how to get the best results and looks at some of the
challenges of working with ICP-MS and how to address them.

Download for free today
                                                                            19 - 534705

at www.essentialknowledgebriefings.com
VOL. 32 NO. 6 (2020)

                                                                                            EDITORIAL
Important developments: please read                                         to e-mail katie@impopen.com who will sort you out. Naturally,
From 2021, Spectroscopy Europe will increase the frequency of               any further communication with you will be via e-mail, so it is
publication to eight issues a year and each issue will contain              vital that we have your correct details.
more material. However, we will not be producing any more                      There is one further change, but one that should not affect
printed issues. Increases in international distribution costs, in           readers. For the past 28 years, Spectroscopy Europe has been
particular, have made print copies unviable. I have also felt               published as a joint venture between Wiley and IM Publications.

                     SPECTRO EXPO
increasingly uncomfortable about the environmental impact of
producing tons of printed paper and mailing it wrapped in plastic
film. It seems that this view is shared by an increasing number
                                 S c i e n c e & T e
                                                                            From 2021, IM Publications will be the sole publisher. If you are
                                                                            a company or organisation looking to advertise in Spectroscopy
                                                                            Europe, please contact me (ian@impopen.com) in future.
                                                                             cI am
                                                                                 h very excited about continuing the journey I started in
of readers as well, who have already switched to digital-only
subscriptions.                   A p p l i c a t i o                         n swhen I took on the role of Editor of European Spectroscopy
                                                                            1982
   I am excited about Spectroscopy Europe’s future as a digital-            News (ESN). That ground-breaking publication has evolved
only publication and to bringing you a greater range of articles            through different titles and publishers to become the digital
and news. I have two requests.                                              Spectroscopy Europe of 2021. That must be over 225 issues

                   SPECTRO EXPO
   First, we need to find out how best to deliver the new digital           that I have produced; I’m looking forward to many more!
Spectroscopy Europe to you, and to find out what you like and,
just as importantly, don’t like about what we publish. I would be
most grateful if you would spend a couple of minutes complet-
ing the onlineScience.Technology.Applications
                survey at spectroscopyeurope.com/2021-survey.
   Second, whilst you are online, please log in and go to your
profile and check it: particularly that your e-mail address is
up to date. There is a password reminder option if you need
that, but if you are unable to log in or have difficulties, feel free

                   SPECTRO                              EXPO
                   S c i e n c e . Te c h n o l o g y. A p p l i c a t i o n s

                        14–16 January 2021 / Amsterdam, The Netherlands

       If you are dealing with :
     •      spectroscopy
     •      imaging spectroscopy
     •      hyperspectral sensing
     the Spectro Expo is made for you !

     The event will feature:
     •   3 scientific conferences
     •   tutorials
     •   a commercial expo

     Come and present your products, meet your future clients
     or future partners, learn about the latest developments
     in spectral sensing, from sensors design to advanced
     processing algorithms, for a variety of applications.

     When:     14–16 January 2021,
     Where:    Amsterdam, The Netherlands

               www.SpectroExpo.com - contact/info : adrianna.leroy@spectroexpo.com

www.spectroscopyeurope.com                                                                                      SPECTROSCOPYEUROPE 3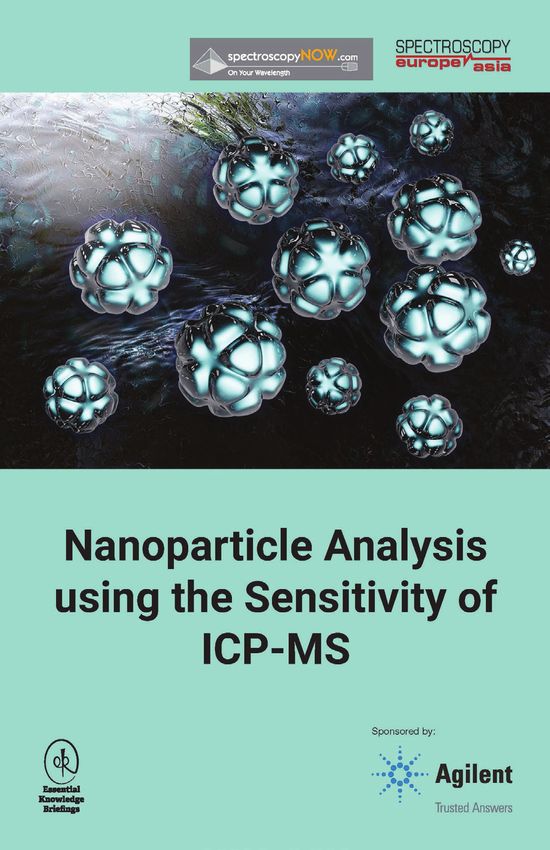
Vol. 32 No. 6 December/January 2020 ISSN 0966-0941
Informing European spectroscopists for over 40 years
Raman in the nuclear field
Software advances for 4D-Proteomics
Gold IS special: and needs special sampling
CONTENTS
3 Editorial
6 News
Non-invasive breath test for COVID-19 using GC-IMS; Photoluminescence
spectroscopy of semiconducting crystals; Fluorescence spectroscopy knows its
wines; Osteoarthritis biomarker found with MS imaging; Smaller imaging spec-
trometer
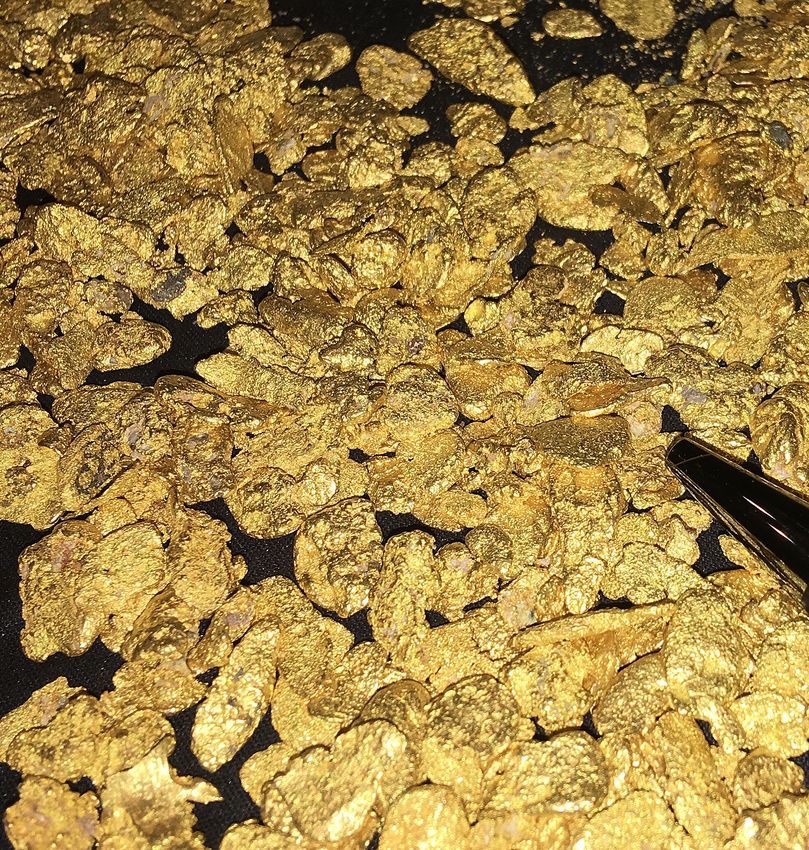
As the authors of the Sampling Column point
out, Gold is always special. However, with its
high value and the extremely heterogene-
ous nature of the rock it is found in, correct
9 Advances in the application of
sampling is essential. Find out more on page
Raman spectroscopy in the nuclear
21. Recovered gold nuggets from Conglomerate field
deposits, Karratha region of Western Australia.
Jean-Yves Colle, Dario Manara, Thorsten Geisler and Rudy J.M. Konings
Photograph courtesy of Artemis Resources Ltd.
14 Software innovations in four-
dimensional mass spectrometric data
analysis
Jürgen Cox and Gary Kruppa
18 Tony Davies Column: Bill George
Antony N. Davies and Peter McIntyre
21 Sampling Column: Quality and
sampling error quantification for gold
Publisher
mineral resource estimation
Ian Michael Simon C. Dominy, Saranchimeg Purevgerel and Kim H. Esbensen
E-mail: ian@impopen.com
Advertising Sales
Ian Michael
IM Publications Open, 6 Charlton Mill, Charlton,
28 New Products
Chichester, West Sussex PO18 0HY, United
Kingdom. Tel: +44-1243-811334,
Fax: +44-1243-811711,
E-mail: ian@impopen.com
35 Diary
Paid subscriptions
IM Publications Open, 6 Charlton Mill, Charlton,
Chichester, West Sussex PO18 0HY, United Spectroscopy Europe is a controlled circulation journal, published seven times a year and avail-
Kingdom. Tel: +44-1243-811334, able free-of-charge to qualifying individuals in Europe. Others can subscribe at the rate of €152
Fax: +44-1243-811711, (Europe), £108 (UK), $208 (ROW, postage included) for the seven issues published in 2020. All
E-mail: katie@impopen.com paid subscription enquiries should be addressed to: Spectroscopy Europe, John Wiley & Sons Ltd,
Journals Administration Department, The Atrium, Southern Gate, Chichester, West Sussex PO19
Spectroscopy Europe is a joint publication of 8SQ, UK.
John Wiley & Sons Ltd, The Atrium, Southern
Gate, Chichester, West Sussex PO19 8SQ, UK, Copyright 2020 John Wiley & Sons Ltd and IM Publications LLP
and IM Publications LLP, 6 Charlton Mill, Charlton,
Chichester, West Sussex PO18 0HY, UK. All rights reserved. No part of this publication may be reproduced, stored in a retrieval system,
or transmitted, in any form or by any means, electronic, mechanical, photocopying, recording or
otherwise, without the prior permission of the publisher in w riting.
Vol. 32 No. 6 Printed in the UK by Warners Midland
December/January 2020
4 SPECTROSCOPYEUROPE
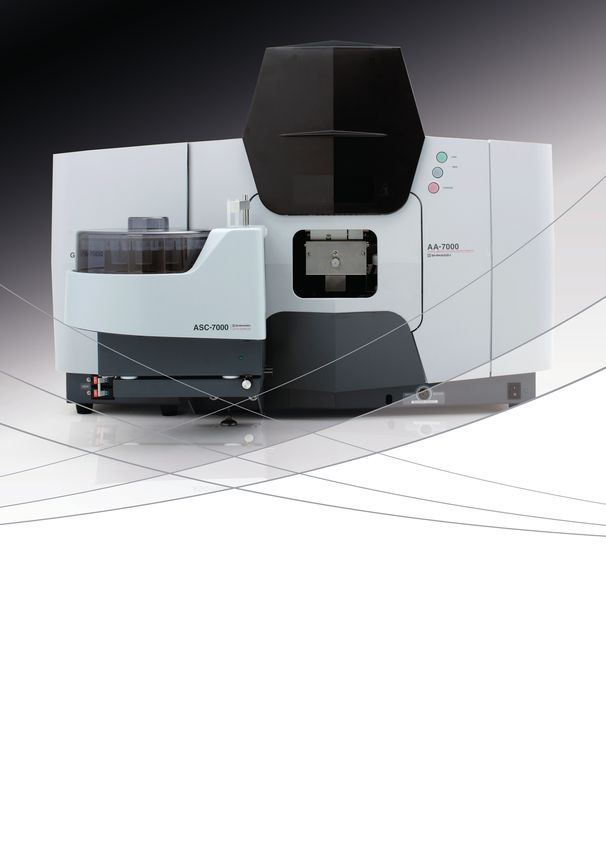
Maximum Performance – minimum
                                                                        footprint the A A-7000 family

Drive-in
The A A-7000 series of atomic absorption         Most-sensitive detector
spectro photometers covers the fully auto -      covering high concentrations as well as
matic multi-element analysis in flame and        ultra-trace samples
graphite furnace mode. The drive mecha -
nism changing the atomizer units by soft-        Excellent system performance
ware operation minimizes switching times         brings world class sensitivity and long
between flame and furnace measurements.          time stability
This is a truly efficient “drive-in” solution.
                                                 Numerous accessories
Family of three systems                          upgrade the functionalities to fully
featuring flame or graphite furnace analysis     automated multi-element analysis
as well as both modes in one system

www.shimadzu.eu /aa-7000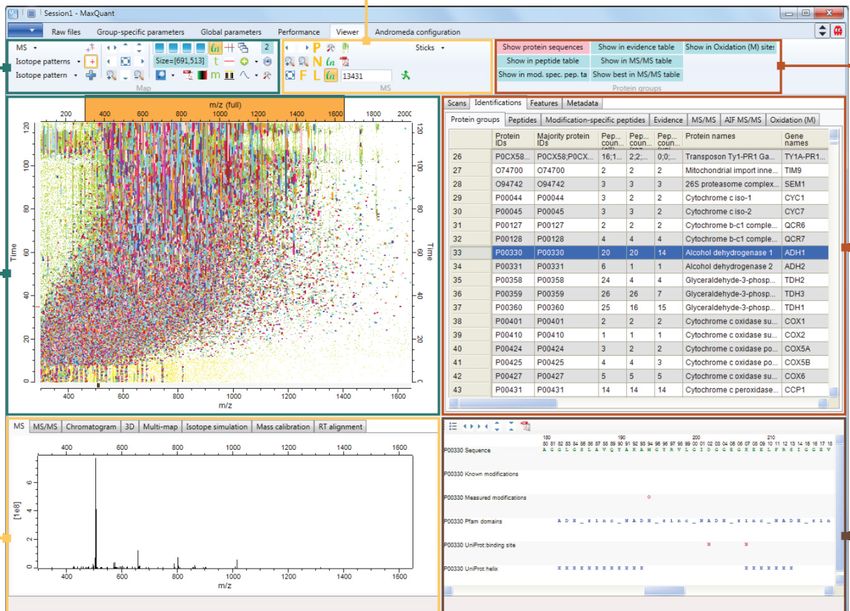
VOL. 32 NO. 6 (2020)

   NEWS
Non-invasive breath test for COVID-19 using                                                          Photoluminescence
GC-IMS                                                                                               spectroscopy of
Working with partners at the IMSPEX                  these findings. Employing tried and             semiconducting crystals
Group as well as the Royal Infirmary                 tested techniques used during the TOXI-         Tohoku University researchers have
of Edinburgh and Germany’s Klinikum                  Triage project, suggests that Covid-19          improved a method for probing semi-
Dortmund Hospital, a research team                   may be rapidly distinguished from other         conducting crystals using omnidirectional
led by Loughborough University has                   respiratory conditions.”                        photoluminescence (ODPL) spectros-
been able to identify candidate biomark-                “To develop this technique further           copy to detect defects and impurities.
ers present in the breath of someone                 larger studies are required, together with      “Our technique can test materials at very
affected by Covid-19. Utilising technolo-            complementary GC-MS studies, to build           low temperatures and can find even
gies developed by GAS GmbH as part                   on the data collected so far. If shown          small amounts of defects and impurities”,
of the TOXI-Triage project, the team has             to be reliable, it offers the possibility for   says Tohoku University materials scientist
demonstrated how these markers can                   rapid identification or exclusion of Covid-     Kazunobu Kojima.
be used to rapidly distinguish Covid-19              19 in emergency departments or primary             Kojima and his colleagues demon-
from other respiratory conditions at point           care that will protect healthcare staff,        strated their approach using gallium
of need, such as an emergency depart-                improve the management of patients              nitride crystals. Gallium nitride is a semi-
ment, a workplace or a care setting, with            and reduce the spread of Covid-19.”             conducting crystal that has been used
no laboratory support.                                  Speaking about their involvement with        in energy-saving light-emitting diodes
   Ninety-eight patients were recruited              the project, Emma Brodrick, Systems             (LEDs) since the 2000s. It has inter-
for the feasibility study, of whom 31                Application Manager at IMSPEX said:             esting optic and electronic properties,
had Covid-19. Other diagnoses included               “Currently the two leading tests for Covid-     making it attractive for many applica-
asthma, exacerbation of asthma and                   19—antigen detection and PCR—both               tions, including power-switching devices
COPD, viral pneumonia, other respiratory             utilise invasive means of taking samples,       in electric vehicles. But it can develop
tract infections and cardiac conditions.             which can be uncomfortable for the              defects and impurities during its fabri-
Participants gave a single breath-sample             patient and may discourage some from            cation, which can affect performance.
for volatile organic compounds analysis              going to get a test they desperately need.      Currently available methods for testing
by gas chromatography/ion mobility spec-             We are excited to be working with NHS           these crystals are expensive or too inva-
trometry (GC-IMS). This analysis identified          Trusts in Scotland, Klinikum Dortmund in        sive. ODPL spectroscopy, on the other
aldehydes (ethanal, octanal), ketones                Germany and Loughborough University             hand, is a non-invasive technique that
(acetone, butanone) and methanol that                to develop a minimally invasive test,           can test the crystals, but only at room
discriminated COVID-19 from other condi-             that produces results rapidly, indeed in        temperature. Being able to change the
tions.                                               TOXI-Triage our results were within one         crystal’s temperature is important to
   Speaking about the feasibility study,             minute.”                                        properly test its properties.
Paul Thomas of Loughborough University,                 The research has been published in
said: “We are hugely encouraged by                   EClinicalMedicine (doi.org/ghgv52).

                                                                                                     The sample is placed outside the integrat-
                                                                                                     ing sphere and onto an aluminium plate
                                                                                                     connected to a cooling device. © Tohoku
                                                                                                     University

                                                                                                        Kojima and his colleagues found a way
                                                                                                     to set up an ODPL instrument so that
                                                                                                     the crystal can be cooled. The process
                                                                                                     involves placing a gallium nitride crys-
                                                                                                     tal on an aluminium plate connected
                                                                                                     to a cooling device. This is placed under
The BreathSpec device was used during the TOXI-Triage field trials last year in Finland for a CBRN   an integrating sphere and external light
exercise. Photo by Andrew Weekes                                                                     is shone through the sphere onto the

6 SPECTROSCOPYEUROPE                                                                                     www.spectroscopyeurope.com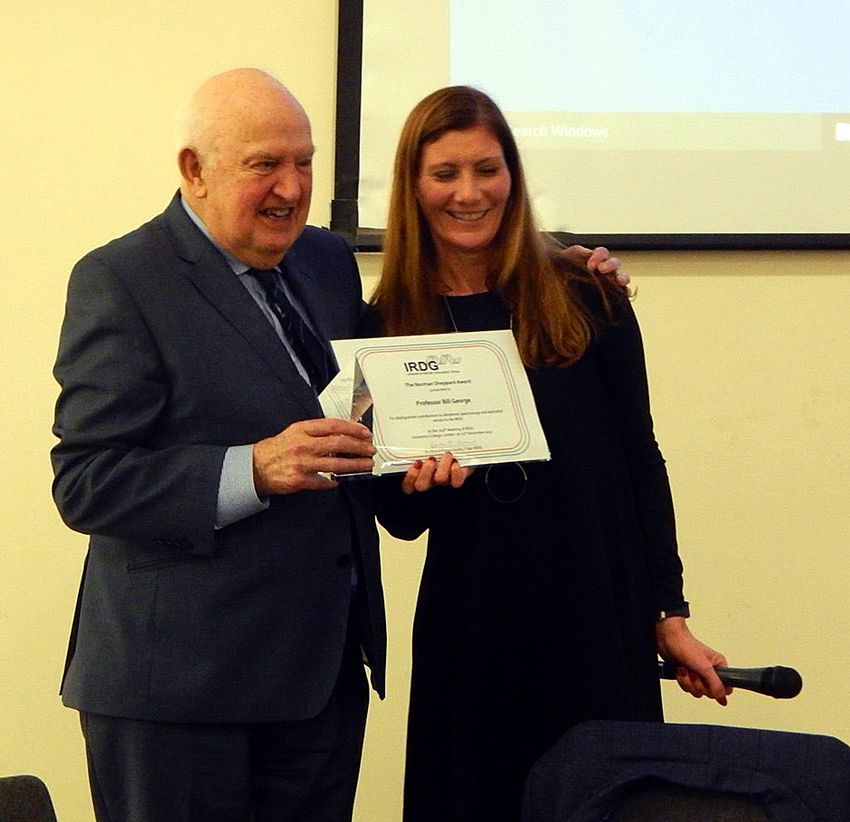
NEWS                                Are you
                                                                                                 compliant
crystal, exciting it. The crystal emits light
back into the sphere in order to return
                                                  in France with 100 % accuracy with a
                                                  novel technique of molecular fingerprint-      with the new
to its initial unexcited state. The two
lights, from the external source and the
                                                  ing using fluorescence spectroscopy.
                                                     “Wine authentication can help to avoid      European
crystal, are integrated within the sphere
and measured by a detector. The result
                                                  any uncertainty around wine labelling
                                                  according to origin, variety or vintage. The
                                                                                                 Pharmacopoeia
reveals the crystal’s “internal quantum
efficiency”, which is reduced if it contains
                                                  application of a relatively simple tech-
                                                  nique like this could be adapted for use
                                                                                                 10.0 and
defects and impurities, and can be meas-
ured even at very low temperatures.
                                                  in the supply chain as a robust method
                                                  for authentication or detection of adul-
                                                                                                 USP
   The team’s modification—placing the
crystal outside the sphere and connect-
                                                  terated wines” , says Ruchira Ranaweera,
                                                  PhD student in the University’s Waite
                                                                                                 Standards?
ing it to something that cools it—means           Research Institute, who conducted the          Starna Certified Reference
the temperature change crucially                  research.                                      Materials provide an essential
happens only within the crystal and not              The researchers looked at Cabernet          tool to achieving data integrity
within the sphere. The scientists were            Sauvignon—a globally important grape           and compliance!
able to measure the internal quantum              variety and the second most planted
efficiency of gallium nitride samples             in Australia—from three different wine
using this technique at temperatures              regions of Australia and Bordeaux in
ranging from –261 °C to about 27 °C.              France, the birthplace of Cabernet
   The details of their new set-up were           Sauvignon. They compared an existing
published in Applied Physics Express              approach for authentication using induc-
(doi.org/fcs6).                                   tively coupled plasma-mass spectrome-
                                                  try (ICP-MS), with the more simple, rapid
Fluorescence                                      and cost-effective fluorescence spectros-
spectroscopy has an                               copy technique.
excellent palate                                     In every wine they tested using the
University of Adelaide wine researchers           novel combination of fluorescence              Wide range of available
are developing a fast and simple method           spectroscopy with machine learning-            materials to cover all AIQ
of authenticating wine. The team was              driven data analysis, they were able to        requirements:
able to identify the geographical origins         correctly allocate 100 % of the wine to        Wavelength accuracy: Deep UV to NIR
of wines originating from three wine              the correct region with the fluorescence       Absorbance accuracy & Photometric
regions of Australia and from Bordeaux            data; ICP-MS classified 97.7 %.                Linearity: up to 3.5 A
                                                                                                 Stray Light
                                                                                                 Instrument Resolution
                                                                                                 UKAS Accreditation as a:
                                                                                                 Reference Material Producer -
                                                                                                 ISO 17034
                                                                                                 Calibration Laboratory -
                                                                                                 ISO/IEC 17025
                                                                                                 NIST Traceable
                                                                                                 Lifetime Guarantee
                                                                                                 Fast re-calibration service

                                                                                                          Starna Scientific Ltd
                                                                                                       www.starna.com
                                                                                                     +44 (0) 20 8501 5550
PhD student Ruchira Ranaweera loads a wine sample into a spectrofluorometer, with Associate               sales@starna.com
Professor David Jeffery. Courtesy of University of Adelaide.

www.spectroscopyeurope.com                                                                               SPECTROSCOPYEUROPE 7
VOL. 32 NO. 6 (2020)

  NEWS
   There are other useful applications           identify specific chemical markers that           The research has been published
of this technology for the wine industry         help discriminate between wine regions.         in Food Chemistry (doi.org/fg5z) and
that are available now or in the pipeline,          “Other than coming up with a robust          was supported by Wine Australia and
such as phenolic and wine colour anal-           method for authenticity testing, we are         the Australian Government, the Waite
ysis, and smoke taint detection. Project         hoping to use the chemical information          Research Institute and industry part-
leader Associate Professor David Jeffery,        obtained from fluorescence data to iden-        ners through the ARC Training Centre for
from the Waite Research Institute and the        tify the molecules that are differentiating     Innovative Wine Production.
ARC Training Centre for Innovative Wine          the wines from the different regions”,
Production, says they hope ultimately to         Associate Professor Jeffery says.

Osteoarthritis biomarker found with MS imaging                                                   agricultural purposes”, said Lockwood.
Using mass spectrometry imaging (MSI)            yet there are limited diagnostic tools, few     “We believe that our new spectrome-
to identify signs of osteoarthritis (OA),        treatment options and no cure.”                 ter could also be used to study climate
University of South Australia scientists            Existing OA biomarkers are still largely     change, one of the most exciting applica-
are learning more about changes at the           focused on bodily fluids, which are neither     tions of an imaging spectrometer.”
molecular level which indicate the sever-        reliable nor sensitive enough to map all           Most of today’s imaging spectrometers
ity of cartilage damage. A study led by          the changes in cartilage damage. By             use an Offner–Chrisp optical configura-
PhD student Olivia Lee and her super-            understanding the biomolecular struc-           tion because it offers excellent control
visor Associate Professor Paul Anderson          ture at the tissue level and how the joint      of optical aberrations. However, this
has mapped complex sugars on OA carti-           tissues interact in the early stages of oste-   design requires a relatively large opti-
lage, showing different sugars are associ-       oarthritis, the researchers say any molecu-     cal setup. The new CCVIS developed by
ated with damaged tissue compared to             lar changes could be targeted to help slow      the researchers performs much like the
healthy tissue. The finding will potentially     the progression of the disease with appro-      Offner–Chrisp configuration, but with
help overcome one of the main chal-              priate medication or treatment.                 new optical components that create a
lenges of osteoarthritis research—identi-           In a recent paper published in the           more compact design.
fying why cartilage degrades at different        International Journal of Molecular                 To make the new CCVIS, the research-
rates in the body.                               Sciences (doi.org/ghbvvg), Lee and her          ers used a catadioptric lens that combines
   “Despite its prevalence in the commu-         colleagues from the University of South         reflective and refractive elements into
nity, there is a lot about osteoarthri-          Australia’s Musculoskeletal Biology             one component. This created a more
tis that we don’t understand”, Professor         Research Laboratory and the Future              compact instrument while still control-
Anderson says. “It is one of the most            Industries Institute explore how advances       ling optical aberrations. The researchers
common degenerative joint diseases,              in MSI to detect OA are promising.              also used a special flat reflection grating
                                                                                                 that is immersed in a refractive medium
                                                                                                 rather than air. This grating takes up less
                                                                                                 space than a traditional grating but with
                                                                                                 the same resolution.
                                                                                                    To test their new design, the research-
                                                                                                 ers demonstrated the spectrometer using
                                                                                                 a laboratory setup. Their experiments
                                                                                                 verified that the CCVIS had the expected
                                                                                                 performance over the full field of view.
                                                                                                    “The CCVIS’s compact size means that
                                                                                                 it can be made into modules that could
                                                                                                 be stacked to increase the field of view”,
Image reproduced from https://doi.org/ghbvvg under a CC BY licence.                              said Lockwood. “It also makes it relatively
                                                                                                 easy to keep stable with no tempera-
                                                                                                 ture changes so that optical alignment,
Smaller imaging                                  long, about the size of a drinks can. The       and thus spectral performance, remains
spectrometer                                     spectrometer has a wavelength range of          unchanged.”
Researchers led by Ronald Lockwood               400–2500 nm.                                       As a step toward the ultimate goal of a
from MIT Lincoln Laboratory have devel-             “Our compact instrument facilitates          space-based demonstration, the research-
oped a new Chrisp compact VNIR/SWIR              the application of imaging spectroscopy         ers are seeking funding to develop a full
imaging spectrometer (CCVIS). It has a           for a variety of scientific and commer-         prototype that could be thoroughly tested
volume about >10× smaller than most              cial problems, such as deployment on            from an airborne vehicle.
of today’s devices. One version of the           small satellites for planetary exploration         The new instrument is reported in
CCVIS is 8.3 cm in diameter and 7 cm             or using unmanned aerial systems for            Applied Optics (doi.org/fhbg).

8 SPECTROSCOPYEUROPE                                                                                 www.spectroscopyeurope.com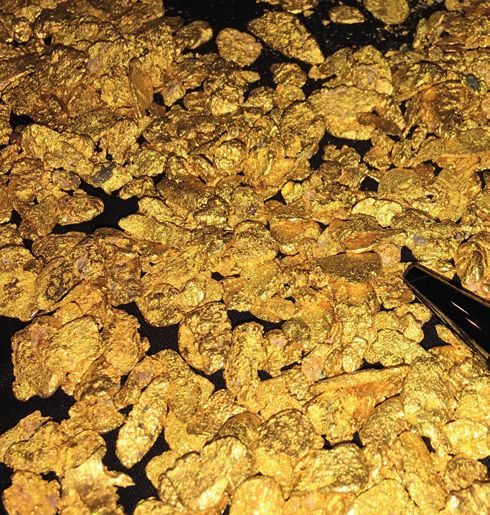
VOL. 32 NO. 6 (2020)

                                                                                                 ARTICLE

Advances in the application
of Raman spectroscopy in the
nuclear field
Jean-Yves Colle,a Dario Manara,b Thorsten Geislerc and Rudy J.M. Koningsa
a
  European Commission, Joint Research Center, PO Box 2340, D-76125 Karlsruhe, Germany.
b
  European Commission Joint Research Centre, Via Enrico Fermi, 2749, I-21027 Ispra (VA), Italy
c
  Institute of Geosciences, University of Bonn, Bonn, Germany

Contact
J.Y. Colle: jean-yves.colle@ec.europa.eu;      D. Manara: https://orcid.org/0000-              R.J.M. Konigs: https://orcid.
    https://orcid.org/0000-0003-4242-          0002-0767-9859                                  org/0000-0001-6113-2128
8083                                           T. Geisler: https://orcid.org/0000-
                                               0003-1923-2023

Raman spectroscopy is a power-                 vibration transition is thus revealed by        illumination of the sample with a laser
ful technique to identify and structur-        a relative shift of the wavelength of the       generally through a single objective,
ally or chemically characterise chemical       scattered light relative to that of the inci-   such as the one of a microscope and by
compounds in the condensed or gase-            dent light. Thereby only one photon out         the analysis of the scattered light with a
ous states, including hazardous and            of 108 photons undergoes Stokes scatter-        spectrometer.
highly radioactive materials. It is princi-    ing and even fewer photons anti-Stokes             In the nuclear field, Raman spectros-
pally non-destructive, can be performed        scattering. The Raman signal is thus            copy has been used already for a few
at distance (up to few tens of metres)         quite weak compared with the inten-             decades for the study and identification
and through transparent and semi-trans-        sity of elastically scattered photons. On       of actinide compounds.1 The specific
parent shielding screens. It is thus not       the other hand, those vibrational transi-       problem in this case is the radiation of
surprising that it is widely used in indus-    tions are very specific to distinct chemi-      the samples, which is hazardous to the
try and research, but also by customs,         cal bonds, resulting in a unique Raman          operator, and can also deteriorate the
the police, military, hazmat and in medi-      spectrum fingerprint for each material.         instrumentation. When working with
cine. To meet the different demands, the       Additionally, as chemical bond vibrations       nuclear materials, one has to deal with
size of the instruments range from hand-       are sensitive to temperature, mechanical        several types of radiation. Actinides, such
held devices, dedicated to fast identifi-      pressure and the molecular environment          as uranium or plutonium, emit alpha
cation of materials or chemicals, up to        (for instance, crystal structure, lattice       radiation, which is easily shielded, but
high-end and high-resolution scientific        defects, impurities and crystallite size),      needs strict confinement to avoid incor-
instruments.                                   the Raman spectrum is influenced by             poration during handling. Other actinides
   Raman spectroscopy is based on the          those parameters and can thus be used           such as americium or used nuclear fuel
indirect measurement of the energy of          to deduce structural information from it.       emit gamma radiation that is highly
vibrational transitions of chemical bonds      Measurements carried out with polarised         penetrating and needs shielding and/or
after they have been excited into a virtual    light can even give information about the       very small sample sizes. The traditional
vibrational state by monochromatic laser       orientation of the bonds in a crystal.          and obvious way to deal with this is to
light (photons). The transition energy is         Raman scattering is best observed            use a remote optical head connected via
thereby revealed through inelastic scat-       with a high-power, monochromatic                glass fibres to the spectrometer.1 While
tering of the incident photons after their     photon beam. For this reason, the rapid         the head is in the shielded confinement
interaction with the interatomic vibrations    progress of laser technology in the last        where the radioactive material is, the
of the material. The inelastically scattered   four decades has broadly improved the           spectrometer is outside. This configura-
photons lose (Stokes Raman bands) or           quality and the applicability of Raman          tion, however, reduces the measurement
eventually gain (anti-Stokes) energy if the    spectroscopy to the most diverse range          flexibility as remote heads have specific
bond excited by the photon was origi-          of solid, liquid, and gaseous materials         requirements. An alternative is to place a
nally in a high energy state and does not      and compounds. In modern instruments            full instrument in a glove box or hot cell,
return to its original ground state. Each      the measurement is performed by the             but this is only possible if the radiation

www.spectroscopyeurope.com                                                                                 SPECTROSCOPYEUROPE 9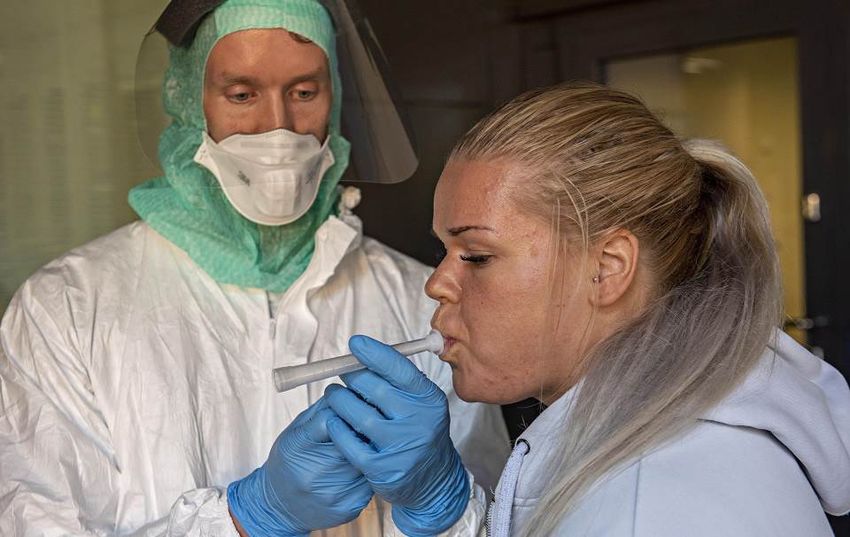
VOL. 32 NO. 6 (2020)
ARTICLE
The second advantage is the easy
maintenance of the instrument that will
stay free of contamination. The encap-
sulation technique also provides the
possibility to easily implement measure-
ments of samples under vacuum, pres-
sure, chosen atmosphere or in liquids.
Finally, the use of a Raman microscope
drastically reduces the amount of mate-
rial needed for the analysis. A sample
of about 0.1 mm 3 (~1 mg of actinide
compounds) is largely sufficient for such
a kind of Raman measurement. Handling
such low quantities has the advantage
that the radiation dose remains low.
The following paragraphs report some
relevant and recent examples of scientific
and technological applications of Raman
Figure 1. Compact confinement for Raman investigation of nuclear spectroscopy in the nuclear field using
material. 1: optical window, 2: acrylic glass cylinder capsule. 3: flange for the benefits of a flexible instrumentation.
the fixation of the plastic bag tunnel. 4: movable sample support. Down
left the confinement installed under a microscope. Up left: movable
sample support for fluid-cell Raman spectroscopy.
Raman spectra of the
actinide dioxides
The actinide dioxides are key materials
in the nuclear fuel cycle. UO2 is the most
dose is low so that no damage occurs to anti-Stokes spectra down to very low common fuel of nuclear reactors. ThO2
the instrument.2 wavelength (< 10 cm–1); is a well-known by-product of rare-earth
A recent development is a compact a triple additive mode for very high- mining, and is considered an alternative
confinement of radioactive material,3,4 resolution measurements (spectral fuel material, although it is not fissile but
which allows use of a conventional resolution down to about 0.3 cm–1) fertile. PuO2 is produced in nuclear reac-
Raman configuration with all its possibili- as many excitation wavelengths as tors and separated in some countries for
ties, resulting in innovative Raman appli- needed, whereas each remote head re-use in mixed oxide (MOX) fuel.
cations on actinide compounds and is configured for only one wavelength; The actinide dioxides have the general
other nuclear materials. The compact the polarisation features of the instru- composition AnO 2 and form a cubic
confinement (Figure 1) described in ment; the different modes of the fluorite-type crystal lattice. In this struc-
Reference 3 consists of an acrylic glass instrument (microscope, macro), the ture the most intense Raman signal is
cylindrical capsule containing the sample autofocus, the confocal microscope the T2g band, which occurs for UO2 at
just below an optical window. A system function, the mapping/imaging func- 445 cm–1. T2g corresponds to the asym-
of plastic bag tunnels enables the trans- tions). metrical O–U stretching vibration of the
fer of the radioactive sample into the
capsule without breaking the radioac-
tivity confinement. The capsule easily
fits onto a microscope stage (Figure 1)
and the measurement can be carried
out through a standard optical window.
Note that this capsule is not reusable but
could be designed to be. The only limita-
tion is the need for a long focal objective
(1 cm or more). This technique presents
several advantages compared to custom
nuclearised instruments. The first is the
possibility to use the full capacity of the
instrument. This includes for example the
use of: Figure 2. (a) Typical Raman spectra of UO2, NpO2 and PuO2 with the characteristic bands T2g,
a double subtractive system for LO, 2LO. In orange, the spectrum of radiation-damaged UO2 doped with 241Am. (b) Raman map
the measurement of Stokes and of the surface of the section of a MOX pellet indicating the concentration of Pu in U + Pu.
10 SPECTROSCOPYEUROPE www.spectroscopyeurope.comVOL. 32 NO. 6 (2020)
ARTICLE
face-centred cubic crystal unit. Also, the fissile element instead of uranium-235 in an alpha-confinement capsule with a
other actinide dioxides have been meas- (235U) and is mixed with natural or standard Raman spectrometer. The false
ured and Figure 2a shows that the T2g depleted uranium. It targets the re-use colour scale of the map corresponds to
peaks vary regularly within the series, of separated plutonium from the recy- the position of the T2g band at a given
indicating clearly the dependence on the cling of standard UO2 fuels and can be position. A T2g band at 445 cm–1 corre-
mass of the actinide and thus the energy used for the burning of excess pluto- sponds to zero % of Pu in U + Pu (in
of the An–O interatomic vibration. nium from dismantled nuclear weapons. black), and a band at 455 cm–1 corre-
In addition to the interatomic vibra- It has advantages in terms of prolifera- sponds to 30 % of Pu in U + Pu (in
tions, characteristic electronic transitions tion, as the resulting spent fuel has a Pu red). The map clearly reveals the areas
can also be observed by Raman spec- isotopic composition that cannot be used enriched in plutonium.
troscopy, as shown in recent publications for fabrication of weapons. It has also In principle, this example demon-
by Naji5 and Villa-Aleman.4 In these stud- the advantage of reducing the consump- strates the feasibility of using Raman
ies, the Raman spectra of NpO2 and PuO2 tion of enriched uranium. For industriali- spectroscopy for the purpose of check-
were measured using multiple excitation sation process optimisation reasons, the ing the conformity of the distribution of
wavelengths and laser excitation heating standard MOX is made from a blend of the plutonium in the fuel. Measurements
where temperature was measured by the about 70 wt % of UO2 and 30 wt % of a can be performed with minimal sample
Stokes/anti-Stokes ratio. Naji performed (U0.70Pu0.30)O2 powder that is sintered to preparation and at lower cost than EPMA.
those measurements on a fragment of a fuel pellets. This results in a fuel consist- In principle, this technology enables
nuclear fuel pellet. Villa-Aleman reported ing of a UO2 matrix containing islands of increasing the throughput of the meas-
an original study on as-fabricated PuO2, plutonium-rich areas. The fission and thus ured samples and thus a more compre-
namely with a very different material the heat production will occur particularly hensive quality control.
morphology consisting of long-square in those islands. Therefore, quality control
stick-shaped crystallites. It was demon- is required to assure that the distribution PuO2 in nuclear waste
strated that additional bands arise from of the plutonium-rich areas is homogene- glasses
the coupling of phonon and electronic ous in the fuel. Borosilicate glasses are broadly used for
transitions originating from the crystal field The PuO2 distribution in MOX fuel is the immobilisation of high-level waste
splitting of the degenerate ground states generally measured by electron probe from reprocessing of used nuclear fuel.
of the 5f n electron configurations. microanalysis (EPMA), which is an effec- The glass immobilises the waste stream
Matrix defects in crystalline materials, tive technique, although quite expensive containing unfissioned and undissolved
such as the one produced by stoichi- and cumbersome. Samples must be fuel residues, fission products and minor
ometry deviation, impurities or radiation carefully prepared for EPMA analysis, and actinides (Np, Am, Cm). It can also be
damage, also influence the spectrum. dedicated radioactive hot cells or nucle- used to immobilise low-quality pluto-
For example, Figure 2a shows in orange arised instruments are needed. nium. However, the precipitation of crys-
the spectrum of UO2 doped with 5 % Raman detection of the plutonium talline secondary phases from the glass
americium (241Am). The brightening of distribution in MOX fuel would present matrix containing fissile isotopes should
the T2g is an indication of the presence considerable advantages. Thanks to the be avoided, as it may present issues
of defects in the matrix. Alpha-particles possibility of remote measurements related to the stability of the material in a
produced by the alpha decay of ameri- through a window, integration of this nuclear repository.
cium have a high energy and deposit it technique in the production line could Raman spec troscopy has been
in a small volume of the material lead- be considered without major adapta- demonstrated 8 to be suited for the
ing to atomic displacements and oxygen tions.6 An experimental demonstration detection of crystalline plutonium dioxide
and uranium Frenkel pairs, with slightly of the feasibility of such measurement in sodium borosilicate glasses. Glasses
different interatomic distances and forces has been undertaken at JRC Karlsruhe. produced at JRC Karlsruhe to simulate
resulting in the observed brightening. The analysis is based on the fact that the behaviour of high-Pu nuclear waste
These detailed analyses give a sound when some of uranium atoms in the vitrification matrices were analysed. The
basis for the identification and charac- UO2 crystal are replaced by plutonium precipitation of PuO2 crystallites from the
terisation of actinide oxides materials in atoms, the T2g band shifts in a regular vitreous glass matrix was observed when
applications like fresh fuel characterisa- way towards higher frequencies7 up to the plutonium concentration exceeded a
tion, irradiation damages in fuel, nuclear those of pure PuO2 near 476 cm–1. This certain value (Figure 3), indicating that
forensic and nuclear safeguards. permits unknown PuO2 concentrations the solubility limit of plutonium diox-
to be obtained from a measured Raman ide in the glass had been exceeded. In
Distribution of plutonium spectrum after correlating concentration this case, Raman spectroscopy helped
in MOX nuclear fuel and band position in a calibration curve. to efficiently, quickly and non-invasively
Worldwide about 5 % of the nuclear fuel A two-dimensional Raman map of detect the precipitation of PuO2 micro-
used in nuclear reactors is MOX fuel. It the surface of a MOX pellet is shown in crystallites when the solubility limit was
consists of plutonium-239 (239Pu) as the Figure 2b. The sample was measured reached. Moreover, the results from a
www.spectroscopyeurope.com SPECTROSCOPYEUROPE 11VOL. 32 NO. 6 (2020)
ARTICLE
Before the experiment, the black
Chernobyl “lava” was investigated by
EPMA and Raman spectroscopy. These
analyses revealed that the Chernobyl
“lava” consists of various inclusions
of uranium and zirconium phases
(UO 2 + x, UO x + Zr, Zr–U–O, (Zr,U)SiO4
and (Zr,U)O2), quartz sand, as well as
Fe-bearing steel spheres, which are
embedded by in a metaluminous sili-
cate glass.
For the very first in situ Raman corrosion
experiment,11 a sample of black “lava” was
mounted in the fluid-cell and immersed
in a sodium carbonate solution (Na2CO3;
pH ≈ 11.8). This solution was chosen to
simulate the alkaline conditions inside the
sarcophagus. The Raman capsule with the
integrated fluid-cell was then placed on an
automated x,y,z stage, which allowed the
Figure 3. Plot of Raman spectra of borosilicate glass, PuO2 and borosilicate glass with
PuO2 inclusions (after Reference 8). acquisition of 2D Raman maps of the area
of interest. This area involved an inclusion
of uranium oxide and smaller metallic
recent Raman spectroscopy study of for radioactive samples developed at JRC steel spheres, which were surrounded by
PuO2 nano-crystals9 can further be used was adapted by replacing the sample the glassy matrix.
to detect the early nucleation of crystal- holder by a fluid-cell containing a black Raman mapping of the area of interest
line plutonium dioxide nano-crystallites. Chernobyl “lava” sample immerged in was repeated approximately every 48 h
an alkaline sodium carbonate solution for a total duration of two months. Within
Fluid-cell Raman (Figure 4). the first 28 days, significant changes in
spectroscopy for the in
situ and real-time study
of the aqueous alteration
behaviour of Chernobyl
“lava”
During the nuclear accident at the Fourth
Unit of the Chernobyl Nuclear Power
Plant in 1986, the interaction between
heated UO 2 fuel rods and fuel clad-
ding with silicate materials of the reac-
tor (concrete and serpentine) led to the
formation of a highly radioactive silicate
melt, the so-called Chernobyl “lava” that
penetrated into different reactor compart-
ments and solidified.10 In 1990, scien-
tists of the V.G. Khlopin Radium Institute
personally collected samples inside the
sarcophagus, that was built to cover the
nuclear reactor, and observed the forma-
tion of secondary uranium phases [e.g.,
UO2 ∙ H2O; UO3 ∙ 2H2O; Na4(UO2)(CO3)]
on the surface of Chernobyl “lava”,
providing evidence for the ongoing
Figure 4. Stacked plot of Raman spectra between 350 cm–1 and 700 cm–1 from
chemical alteration of Chernobyl “lava”.10 different UO2 + x inclusions of the black Chernobyl “lava”. Note the frequency shift and
In order to study the effects of aque- simultaneous band broadening of the T2g mode from 445 cm–1 (marked by grey solid
ous corrosion on this highly radioactive line) up to 456 cm–1 (grey dashed line) indicating the existence of hyper-stoichiometric
material by infiltrating water, the capsule UO2 + x.
12 SPECTROSCOPYEUROPE www.spectroscopyeurope.comVOL. 32 NO. 6 (2020)
ARTICLE
the Raman spectra were observed. 2. G. Guimbretière, L. Desgranges, C. the UO 2 –PuO 2 phase diagram
Although some new bands remain Jegou, A. Canizarès, P. Simon, R. at high temperatures”, J. Nucl.
unidentified, the appearance of two Caraballo, N. Raimboux, M. Barthe, Mater. 448(1), 330–339 (2014).
intensive bands point to the formation M. Ammar, O.A. Maslova, F. Duval ht tps://doi.org/10.1016/j.jnuc-
of a yet unidentified secondary phase and R. Omnée, “Characterization of mat.2014.02.029
that precipitated and grew from solution. nuclear materials in extreme condi- 8. D. Manara, M. Naji, S. Mastromarino,
The results of this work demonstrate the tions: The Raman spectroscopy J.M. Elorrieta, N. Magnani, L. Martel
feasibility of extended kinetic analysis of approach”, 2013 3rd International and J.Y. Colle, “The Raman fingerprint
reactions between radioactive materials Conference on Advancements of plutonium dioxide: Some example
and aqueous solutions. As recently been in Nuclear Instrumentation, applications for the detection of PuO2
shown for non-radioactive glasses,12 this Measurement Methods and their in host matrices”, J. Nucl. Mater.
technique opens up new avenues to Applications (ANIMMA), pp. 1–8 499, 268–271 (2018). https://doi.
study the interaction of nuclear materials (2013). https://doi.org/10.1109/ org/10.1016/j.jnucmat.2017.11.042
and aqueous solutions by Raman spec- ANIMMA.2013.6727957 9. D. Hudry, C. Apostolidis, O. Walter, A.
troscopy with the ability to study specific 3. J.-Y. Colle, M. Naji, M. Sierig and Janßen, D. Manara, J.-C. Griveau, E.
sub-processes in situ and in real time. D. Manara, “A novel technique for Colineau, T. Vitova, T. Prüßmann, D.
Raman analysis of highly radioac- Wang, C. Kübel and D. Meyer, “Ultra-
Outlook tive samples using any standard small plutonium oxide nanocrystals:
Thanks to the high flexibility of the micro-Raman spectrometer”, JoVE an innovative material in plutonium
Raman spectroscopy technique, the 122, e54889 (2017). https://doi. science”, Chem.-Eur. J. 20(33),
number of studies performed on nuclear org/10.3791/54889 10431–10438 (2014). https://doi.
materials of many different types and 4. E. Villa-Aleman, N.J. Bridges, T.C. org/10.1002/chem.201402008
applications has increased impressively Shehee and A.L. Houk, “Raman 10. B.E. Burakov, E.B. Anderson, S.I.
in the last fifteen years and moved microspectroscopy of PuO2 partic- Shabalev, E.E. Str ykanova, S.V.
into applied fields such as nuclear safe- ulate aggregates”, J. Nucl. Mater. Ushakov, M. Trotabas, J.Y. Blanc, P.
guards, decommissioning and process 515, 140–149 (2019). https://doi. Winter and J. Duco, “The behav-
control. Its wider technological appli- org/10.1016/j.jnucmat.2018.12.022 ior of nuclear fuel in first days of
cation requires a fundamental under- 5. M. Naji, N. Magnani, L.J. Bonales, the Chernobyl accident”, MRS
standing of the spectra of the materials S. Mastromarino, J.Y. Colle, J. Cobos Proceedings 465, 1297 (2012).
employed in the nuclear fuel cycle, but and D. Manara, “Raman spectrum of https://doi.org/10.1557/PROC-465-
also in non-electric applications, such plutonium dioxide: vibrational and 1297
as space power or radioisotope produc- crystal field modes”, Phys. Rev. B 11. M.I. Lönartz, First in situ Observations
tion. In addition to establishing reference 95(10), 104307 (2017). https://doi. of the Alteration Behaviour of
spectra for these radioactive materials, org/10.1103/PhysRevB.95.104307 Chernobyl Lava by Fluid-Cell Raman
one also needs to understand the effects 6. Z. Talip, S. Peuget, M. Magnin, M. Spectroscopy. Steinmann-Institut für
of radiation damage on the spectra and Tribet, C. Valot, R. Vauchy and C. Geowissenschaften der Rheinischen
peculiar effects resulting from the unique Jégou, “Characterization of un-irra- Friedrich-Wilhelms-Universität Bonn
electronic configuration of the actinides. diated MIMAS MOX fuel by Raman (2019).
spectroscopy and EPMA”, J. Nucl. 12. T. Geisler, L. Dohmen, C. Lenting
References M a t e r. 4 9 9 , 8 8 – 97 (2 018 ) . and M.B.K. Fritzsche, “Real-time in
1. G.M. Begun, R.G. Haire, W.R. ht tps://doi.org/10.1016/j.jnuc- situ observations of reaction and
W i l m a r t h a n d J . R . Pete r s o n , mat.2017.11.014 transport phenomena during sili-
“Raman spectra of some actinide 7. R. Böhler, M.J. Welland, D. Prieur, cate glass corrosion by fluid-cell
dioxides and of EuF 2 ”, J. Less- P. Cakir, T. Vitova, T. Pruessmann, I. Raman spectroscopy”, Nat. Materials
Common Metals 162, 129 (1990). Pidchenko, C. Hennig, C. Guéneau, 18(4), 342–348 (2019). https://doi.
ht tps://doi.org/10.1016/0022- R.J.M. Konings and D. Manara, org/10.1038/s41563-019-0293-8
5088(90)90465-V “Recent advances in the study of
!
To continue to receive Spectroscopy Europe,
we must have your current e-mail address,
please check it NOW at
spectroscopyeurope.com/user
www.spectroscopyeurope.com SPECTROSCOPYEUROPE 13VOL. 32 NO. 6 (2020)
ARTICLE
Software innovations in
four-dimensional mass
spectrometric data analysis
Jürgen Coxa and Gary Kruppab
a
Research Group Lead of Computational Systems Biochemistry, Max Planck Institute of Biochemistry, Am
Klopferspitz 18, 82152 Martinsried, Germany. cox@biochem.mpg.de; https://orcid.org/0000-0001-8597-205X
b
Vice-President, Proteomics, Bruker Daltonics
Over the last two decades, significant MaxQuant possesses a large ecosys- widespread adoption of Bruker’s timsTOF
advances in technology and new meth- tem of algorithms for comprehensive Pro instrument, which was designed
odologies have made proteomics an data analysis. It incorporates the peptide to deliver greater sensitivity, selectiv-
extremely powerful tool for protein scien- search engine Andromeda and, coupled ity and MS/MS acquisition speeds for
tists, biologists, and clinical researchers.1 with Perseus, was developed to offer a proteomics research. The novel design
As analytical instrumentation continues complete solution for downstream bioin- allows for ions to be accumulated in
to evolve, more data is produced with formatics analysis.2 MaxQuant performs the front section, while ions in the
each technical advancement in proteom- quantification with labels and via the rear section are sequentially released
ics research. That, of course, also creates MaxLFQ algorithm on label-free data, and depending on their ion mobility, and in
new challenges for bioinformatics soft- achieves high peptide mass accuracies subsequent scans selected precursors
ware development. thanks to its advanced non-linear recali- can be targeted for MS/MS. This process
The modern high-throughput mass bration algorithms. is called Parallel Accumulation Serial
spectrometry (MS) -based proteom- Fragmentation, or PASEF®.3
ics methods that are required to gain MaxQuant for four- The unique trapped ion mobil-
deeper insights into biological processes dimensional proteomics ity spectrometry (TIMS) design allows
produce enormous amounts of data. This MaxQuant is often used for liquid chro- researchers to reproducibly measure the
raw data necessitates powerful, auto- matography coupled with tandem mass collisional cross-section (CCS) values for
mated computer-based methods that spectrometry (LC-MS/MS) shotgun all detected ions, and those can be used
provide reliable identification and quan- proteomics—a method of identifying to further increase the system’s selec-
tification of proteins. proteins in complex mixtures to provide tivity, enabling more and more reliable
a wider dynamic range and coverage of relative quantitation information from
Quantitative proteomics proteins. complex samples and short gradient
software Shotgun (or bottom-up) proteomics analyses.
Freely available for academic and non- is the most commonly used MS-based The addition of TIMS to LC-MS based
academic researchers, many labora- approach to study proteins by digesting shotgun proteomics, using PASEF,
tories across the globe benefit from them into peptides prior to MS analysis. has the potential to boost proteome
the MaxQuant quantitative proteom- Ion mobility can add a further dimen- coverage, quantification accuracy and
ics software package’s precise protein sion to LC-MS based shotgun proteomics dynamic range, resulting in fast ultra-
and peptide quantification algorithms. that has the potential to boost proteome sensitive analysis. The increase in
The software was developed by the coverage, quantification accuracy and speed resulting from PASEF technology
Computational Systems Biochemistry dynamic range. However, this additional allows more samples to be analysed in
group at the Max Planck Institute of information requires suitable software a shorter time frame, but also generates
Biochemistry (MPIB) in Martinsried, that extracts the information contained vast amounts of spectral data, creating
Munich, Germany. The group also devel- in the four-dimensional (4D) data space challenges when dealing with large
oped Perseus, a software platform that spanned by m/z, retention time, ion sample cohorts.
supports researchers in the interpretation mobility and signal intensity. MPIB software developers adapted
of protein quantification and interaction The impact of the addition of the ion the MaxQuant shotgun proteomics
data as well as data on post-translational mobility dimension on the proteomics workflow to extract this abundance
modifications (PTMs). field can be seen, for example, in the of information from the timsTOF Pro
14 SPECTROSCOPYEUROPE www.spectroscopyeurope.comVOL. 32 NO. 6 (2020)
ARTICLE
Figure 1. Screenshot of MaxQuant quantitative proteomics software package designed for analysing large mass spectrometric data sets. Source:
Maxquant.org
data, making it possible to manage 4D Emerging applications for research proteomics will be one of the
features in the space spanned by reten- 4D-Proteomics main applications of 4D-Proteomics
tion time, ion mobility, mass and signal Powerful developments in MS tech- in the future, and they are working
intensity that benefit the identification nology have led to the expansion of with several clinical groups to bring
and quantification of peptides, proteins MaxQuant and the software’s ability to MS-based proteomics into clinical prac-
and PTMs. meet future needs in the proteomics tice. However, the analysis of proteom-
TIMS is challenging for software devel- field. These improvements are helping ics data from samples derived from
opers because it is not just one piece of researchers develop new capabilities and patients requires special computational
new information—it adds an additional applications by delivering more sensitivity strategies. The problems that need to be
dimension. The updated MaxQuant and selectivity for the identification and addressed include: how to extract mean-
4D-Proteomics workflows can process quantification of peptides, proteins and ingful protein expression signatures from
data produced via PASEF, data-indepen- PTMs. Instrumentation advances have data with high individual variability, how
dent acquisition (dia)-PASEF and Mobility also bolstered the ongoing development to integrate the genomic background of
Offset Mass Aligned (MOMA). of MaxQuant. The MPIB software devel- the patients into the analysis of proteom-
Adding another dimension can opment team’s goal is always to expand ics data, and how to determine biomark-
lengthen algorithm processing times, and improve MaxQuant to meet the ers and properly estimate their predictive
creating a significant challenge for soft- complexity of biological processes and power.
ware development with 4D-Proteomics. novel MS instruments. To answer these questions, the MPIB
As a result, the team optimised computa- software developers are working to make
tion time in MaxQuant to overcome this, Clinical research proteomics use of machine learning algorithms to
so users can achieve good results in a The MPIB Computational Systems classify patients and employ feature
reasonable time frame. Biochemistry team believes clinical selection algorithms to extract predictive
www.spectroscopyeurope.com SPECTROSCOPYEUROPE 15VOL. 32 NO. 6 (2020)
ARTICLE
Figure 2. Design of the timsTOF Pro instrument. Source: www.Bruker.com
protein signatures. The extra clinical test
engine provides a challenge for the soft-
ware. It is not clear yet if proteomics will
be a guide to which molecules to look at,
or if it will be a major component of clini-
cal diagnostics.
Single-cell proteomics
While today’s laboratories generate large
data sets from single-cell genomic and
single-cell transcriptomic research, single
cell proteomics (sc-proteomics) is a
nascent field. It holds the potential to
enable researchers to detect and quanti-
tate the proteins in single cells, avoiding
the need to infer proteins from cellular
messenger-RNA levels.4 That also creates
new challenges for computational analy-
sis.
MPIB researchers are looking ahead
to future needs as sc-proteomics devel-
ops, closely examining emerging tech-
nologies to establish quantification
standards. The software developers
believe sc-proteomics will be achiev-
able in the next few years. The two main
advances enabling this will be improved
sensitivity in the instrumentation and the
software to work with it.
Figure 3. Example showing how dia-PASEF can efficiently fragment nearly all peptide ions
Data-independent eluting at a given retention time. Figures courtesy of: F. Meier, A.-D. Brumer, M. Frank, A. Ha, I.
acquisition Bludau, E. Voytik, S. Kaspar-Schoenefeld, M. Lubeck, O. Raether, R. Aebersold, B. Collins, H.-L. Rost
Recent advances in data-independent and M. Mann, “Parallel accumulation – serial fragmentation combined with data-independent
acquisition (DIA) sensitivity have encour- acquisition (diaPASEF): Bottom-up proteomics with near optimal usage”, bioRxiv 656207 (2020).
aged the MPIB Computational Systems https://doi.org/10.1101/656207
16 SPECTROSCOPYEUROPE www.spectroscopyeurope.comVOL. 32 NO. 6 (2020)
ARTICLE
Biochemistry team to integrate DIA work- of proteomics, which could extend the References
flows into MaxQuant using machine feasibility of applying 4D-Proteomics 1. J. Cox and M. Mann, “Quantitative,
learning algorithms. The success of DIA for clinical research applications, as high-resolution proteomics for data-
relies on key instrumental capabilities— mentioned previously. driven systems biology”, Ann. Rev.
namely resolution, sensitivity, accuracy Biochem. 80, 273–299 (2011).
and dynamic range uncompromised by Conclusion https://doi.org/10.1146/annurev-
a fast-spectral acquisition rate. Bioinformatics software development biochem-061308-093216
DIA has been implemented in the is a constantly changing field that will 2. J. Cox, N. Neuhauser, A. Michalski,
timsTOF Pro in a way that takes advan- see more technological advancement R.A. Scheltema, J.V. Olsen and M.
tage of the speed and sensitivity of in the future. As analytical instrumenta- Mann, “Andromeda: a peptide search
TIMS and PASEF, in a method called tion advances, the MPIB Computational engine integrated into the MaxQuant
dia-PASEF®. The 4D nature of the dia- Systems Biochemistry team must deal environment”, J. Proteome Res.
PASEF data is an advantage for DIA soft- with even larger amounts of informa- 10(4), 1794–1805 (2011). https://
ware developers, who can make use of tion on the software side because these doi.org/10.1021/pr101065j
the additional ion mobility dimension instruments continue to expand their 3. F. Meier, A.D. Brunner, S. Koch, H.
for alignment and extraction of features. dynamic range and capabilities. Koch, M. Lubeck, M. Krause, N.
Such recent technological advances, These improvements to the MaxQuant Goedecke, J. Decker, T. Kosinski,
as well as developments in DIA meth- software platform are possible due M.A. Park, N. Bache, O. Hoerning,
ods, have provided new opportunities to important collaborations between J. Cox, O. Räther and M. Mann,
for the MPIB Computational Systems the MPIB Computational Systems “Online Parallel Accumulation-Serial
Biochemistry research group. Biochemistry research team and other Fragmentation (PASEF) with a novel
The MaxQuant developers are enthu- institutions and industry leaders. These trapped ion mobility mass spectrom-
siastic about the platform’s upcom- collaborations include projects designed eter”, Mol. Cell. Proteomics 17(12),
ing DIA capability. DDA and DIA are to improve proteomics technologies, with 2534–2545 (2018). https://doi.
becoming comparable because of MaxQuant providing the computational org/10.1074/mcp.TIR118.000900
improved sensitivity in instrumentation. tools necessary to analyse data acquired 4. V. Marx, “A dream of single-cell prot-
The hardware is becoming simpler for on new and emerging hardware plat- eomics”, Nat. Methods 16, 809–812
users, but data has been much more forms. The results of these collaborations (2019). https://doi.org/10.1038/
challenging because the sof t ware will be used to develop future versions of s41592-019-0540-6
must find which fragments belong to the software to optimise 4D-Proteomics
which molecule. Addressing these chal- workflows.
lenges will provide a deeper coverage
IMPORTANT READER SURVEY
As Spectroscopy Europe evolves to digital-only publication, we really need to know how you want
to read the magazine in future:
PDF for screen or to print?
App for mobile devices?
Page-turning “flipbook”?
Or something else?
We would also like to learn what sort of content you
like to read in Spectroscopy Europe.
Please take a couple of minutes, or less, to help shape
the future.
spectroscopyeurope.com/2021-survey SPECTROSCOPYEUROPE 17VOL. 32 NO. 6 (2020)
TONY DAVIES COLUMN
Bill George
Antony N. Daviesa and Peter McIntyreb
a
SERC, Sustainable Environment Research Centre, Faculty of Computing, Engineering and Science, University of South
Wales, UK
b
Laugharne, Carmarthenshire, Wales, UK
The last 18 months has been a really sad increased burden of Pro Vice Chancellor.
time with the passing of several of the He was appointed Professor of Molecular
founding fathers of British spectroscopy. Spectroscopy in 1997 and Emeritus
Peter McIntyre and I thought it would be Professor in 2000, although this later
good to celebrate briefly the life of a real status change famously did little to
Welsh character and educator whose hinder his research activities and, as he
style and charisma influenced many to continued to obtain research grants—
go on and not only stay in science but to often for supercomputing time for ab
rise to leading positions either in indus- initio and DFT studies—and to publish
try or academia. his results with his colleagues and
Bill George former students! On April 2012 he was
Award winning Fellow—in honoured to be elected as a Fellow of
more ways than one Technology. As the expansion continued the Learned Society of Wales.
Professor William (Bill) George BSc it evolved into Glamorgan Polytechnic 1959/60: awarded a University of
(Hons), PhD, DSc, CChem. FRSC, and then the Polytechnic of Wales in Wales Fellowship
FLSW was educated in South Wales. He 1975 when Bill was appointed Head of 1974: awarded a DSc by the
attended the same grammar school as the Department of Science. University of Wales
Sir Harry Secombe, but I have no indi- He progressed up the career ladder in 1975: appointed Head of the
cation that this early training was the the years prior to the Polytechnic of Wales Department of Science at the then
root of Bill’s humour. I don’t think Bill’s achieving university status. He became Polytechnic of Wales
time at Dynevor Grammar School over- first Dean of the faculty of Science in 1984: also became Dean of Faculty
lapped with Harry Secombe, but Bill 1984, adding Assistant Director for 19 8 8 : D e a n o f Fa c u l t y a n d
went on to Swansea Technical College Research & Consultancy to his roles in Assistant Director for Research and
and University College, Swansea before 1988. The Polytechnic of Wales became Consultancy
spending periods in industry at the the University of Glamorgan in 1992 1993: Pro Vice-Chancellor for three
United Kingdom Chemicals Company, and a year later found Bill taking on the years
Swansea and moving out of Wales at the
Distillers Company Research Laboratory
in Epsom.
Bill moved into academia, spending 13
years at what is now Kingston University
in London where he became its first
Reader and led the first MSc Course.
It is, however, his time spent having
returned as an educator and researcher
to Wales where most of the anec-
dotes from his life arise. Bill saw huge
change during his career, his labora-
tories in Pontypridd were located in
the original buildings of the revolution-
ary South Wales and Monmouthshire
School of Mines, in Treforest. By 1958
the School had expanded its courses in
science, technology and commerce and
been renamed Glamorgan College of Figure 1. The original School of Mines Building.
18 SPECTROSCOPYEUROPE www.spectroscopyeurope.comYou can also read