RAPID EPIDEMIC EXPANSION OF THE SARS-COV-2 OMICRON BA.2 SUBVARIANT DURING CHINA'S LARGEST OUTBREAKS
←
→
Page content transcription
If your browser does not render page correctly, please read the page content below
Rapid epidemic expansion of the SARS-CoV-2 Omicron BA.2 subvariant during China’s largest outbreaks Yeyu Freddie Dai ( freddie999999@hotmail.com ) China Wireless-Valley (HK) Ltd. Bingxi Gabriel Dai ( Bingxi.Dai@outlook.com ) Purkinji Inc. Mu Chen Research Article Keywords: Omicron, BA.2, SARS-CoV-2, dynamic zero-COVID strategy, COVID, COVID-19, asymptomatic, quantum machanics, quantum biology, quantum states, quantum effect, correlation, dynamic zero-COVID policy, China Posted Date: June 22nd, 2022 DOI: https://doi.org/10.21203/rs.3.rs-1516063/v11 License: This work is licensed under a Creative Commons Attribution 4.0 International License. Read Full License
Rapid epidemic expansion of the SARS-CoV-2 Omicron BA.2 subvariant during China’s
                                    largest outbreaks

Yeyu Freddie Dai, Bingxi Gabriel Dai, Mu Chen

Abstract

A complete and accurate statistical analysis of cases of contraction with SARS-CoV-2, under the
conditions of strict mandatory quarantine and isolation and of a high rate of full vaccination,
during the largest COVID-19 outbreaks driven by the Omicron BA.2 subvariant in China are given.
SARS-CoV-2 is still new, and little is known about either its directions of variations or its laws of
reproduction. No country other than China has been able to disclose every case of infection in
every epidemic or outbreak since April of 2020. Here, this study reveals that Omicron BA.2
subvariant can still spread very fast and wide in areas with strict “dynamic zero-COVID strategy”1
in China, that there exist cities twenty-fold differences in morbidity rates unrelated to any of the
known factors contributing to incidence of infectious diseases, and that Omicron BA.2 subvariant
is unpredictable in its virulence, although its severity rate of symptomatic cases is low. This
analysis provides first-hand original and valuable information for further research on similar
epidemics in the future. This study also raises a discussion about possible correlation related to
quantum mechanics, and the quantum evolution of SARS-CoV-2 Omicron variant may finally
bring COVID-19 Pandemic to end. It may bring new thoughts for correction of present
epidemiological theory and mathematical models. It may also give other countries time to be
better prepared for the coming waves driven by Omicron variant.

Methods

We analyzed daily domestic cases (cases of infection between domestic travelers, as called
indigenous cases in China) of SARS-CoV-2 in mainland China from 21 February 2022 to 14 May
2022 (hereafter also called the March outbreaks) from publicly released data provided by the
National Health Commission of the People’s Republic of China (NHC). This was accessible through
the website of the National Health Commission News Daily Briefing (Http://en.nhc.gov.cn). The
National Health Commission releases daily updates on the number of confirmed (here meaning
symptomatic) and asymptomatic new cases, with a breakdown by province and cities, and severe
cases, deaths and recoveries nationwide. Sources of more information about this analysis are
COVID-19 epidemiological reports published daily by Provincial/Territorial branches of NHC and
press conferences held by Provincial/Territorial governments. CDC is a department of NHC in
China and the same is for its Provincial/Territorial branches. All data were updated to 14 May
2022.

Due to deficiency of COVID-19 testing or medical workers in some jurisdictions in some days,
there were sudden surges of cases in some days during the March outbreaks. A sudden surge of
cases might indicate a belated report but did not indicate a skew or underestimation of the total
number of COVID-19 in the population because all related cases were reported late when testing
and medical workers were sufficient. There might be some normalization of data or curves
according to need of appearance of figures or charts, but the original numbers of cases would be
stated in the supplementary files.

The same Criteria2 have been followed all over China for all COVID-19 related work including
testing, diagnosing, and classification of cases of infection. This analysis uses the word
“symptomatic” instead of the word “confirmed” (as NHC called), so as the word” confirmed”
instead of the word “infected”, as shown in the following related definitions and explanations:
   1. Confirmed cases are laboratory confirmed (SARS-CoV-2 PCR-positive) cases of infection by
   double samplings (nasal and pharyngeal swab specimens) and tests. Confirmed cases are
   composed of asymptomatic cases, symptomatic cases, and deaths.
   2. Asymptomatic cases are cases of infection without symptom or symptoms. Symptomatic
   cases are cases with symptom or symptoms, and are composed of mild cases, moderate cases,
   and severe cases (including critical cases).
   3. Morbidity rate is the ratio of symptomatic cases in confirmed cases in percentage.
   4. Case fatality rate is the ratio of deaths in confirmed cases, unless specifically stated.
   5. Severity rate is the ratio of severe cases, either in symptomatic cases or in confirmed cases
   in percentage. It is usually stated specifically as in symptomatic or in confirmed cases.

The converting of asymptomatic cases to symptomatic cases may happen at any time. The daily
numbers of such conversion are reported in some jurisdictions, specifically in Shanghai,
Changchun and Jilin, nationwide as a whole, but are not reported in others. Because daily
converting cases from asymptomatic to symptomatic days before are reported again in daily
report as new asymptomatic cases once they are diagnosed with symptom or symptoms, the
numbers or ratios of asymptomatic cases and confirmed cases should be deducted by daily
numbers or ratios of such conversion relatively so as to get the actual numbers or ratios in the
jurisdictions with daily conversion reported. Percentages of conversion are shown in the section
“Asymptomatic cases conversion” of this study for estimation of impact to the related actual
numbers or ratios in jurisdictions with conversion not reported.

Main

China had been struggling with its largest COVID-19 outbreaks driven by the SARS-CoV-2 Omicron
BA.2 subvariant reported by the Chinese Center for Disease Control and Prevention and its
Provincial Centers in press conferences since 21 February 2022, with over 738,000 people
infected in mainland China within 66 days. Although there were more than a hundred
disseminations (independent local outbreaks with cases of infection less than one hundred
usually) and several moderate outbreaks before March 2022, China had maintained to its
“dynamic zero-COVID strategy” by reducing to zero the number of each active chain of
transmission, and it seemed to work well even during the period of the 5th wave driven by
Omicron in the world3 from October 2021 to February 2022. These outbreaks, driven by Omicron
BA.2 subvariant, started in Shenzhen and Dongguan, adjacent to Hong Kong, two of the most
industrialized cities in southern China, at the end of February 2022. Hong Kong had just recorded
the most severe attack in February1, with close to 900 cases of COVID-19 per 100,000 residents in
Hong Kong, the highest level recorded anywhere in the world during the pandemic. The virus
swept rapidly across 100 cities in 30 provinces of the country, causing 105,546 people to be
infected in March and a total of 738,944 confirmed cases during the March Outbreaks till 14 May
2022. Among those, thirteen cities had over 1,000 people infected, and Shanghai, Changchun and
Jilin were the most affected with over 28,000 confirmed cases each, while Shanghai alone had
619,259 people infected. Figure 1 showed an overview diagram of the March outbreaks in the
major cities affected in China in 2022.

China’s “dynamic zero-COVID strategy” had been evolving for a year. More mandatory quarantine
and isolation measures were implemented and were said to be precise, being able to track every
individual and his or her possibility of contracting the virus on every chain of transmission, to
disclose, quarantine, and isolate and classify by symptoms every person of infection with support
of the most updated app and a large quantity of fully-trained epidemiological investigators and
dedicated doctors. China had already reached its high rate of full vaccination before these large
outbreaks. As press conferences of the Department of State reported, over 87% of the population
had been fully vaccinated by mid-February 2022. The full vaccination rate was 87.45% overall by
05 February and 87.77% by 14 March 2022. This rate of full vaccination was 88.01% in the overall
population by 24 March 2022, with 84.36% or 222.72 million of those aged 60 or above. A total
of 138.24 million (or 52.36% of) people over 60 years old received booster shots. China’s 7th
census published its population as 1.412 billion on 1 November 2020, among them 264 million or
18.70% were aged 60 or above4.

Data in this study cover all daily new PCR-positive cases reported from February 21st to May 14th
of 2022. All major cities with over 800 cases of infection are chosen for this statistical analysis.
These major cities are located from north to south, and some are close to each other, while some
are very far away from each other. All cities follow the same mandatory policy and the same test
and diagnosis standards published by the nation. Genome analyses reveal that all outbreaks in
March were driven by Omicron BA.2 subvariant according to the report from press conferences
by the Department of State and NHC of China. There are enough doctors to diagnose and classify
all cases of infection daily except for a single one-day delay in Jilin. Every essential event will be
described in the related section to avoid missing possible information relevant to influencing
factors of transmission, infection or morbidity. Through observations and data analyses, we find
that the features of the epidemics are different in many aspects in different cities, and some are
even contradictory of their morbidity rates during the March outbreaks in China in 2022.
Large differences in morbidity rates in main cities
Mainland China reported 629,818 domestic COVID-19 cases of infection by Omicron BA.2
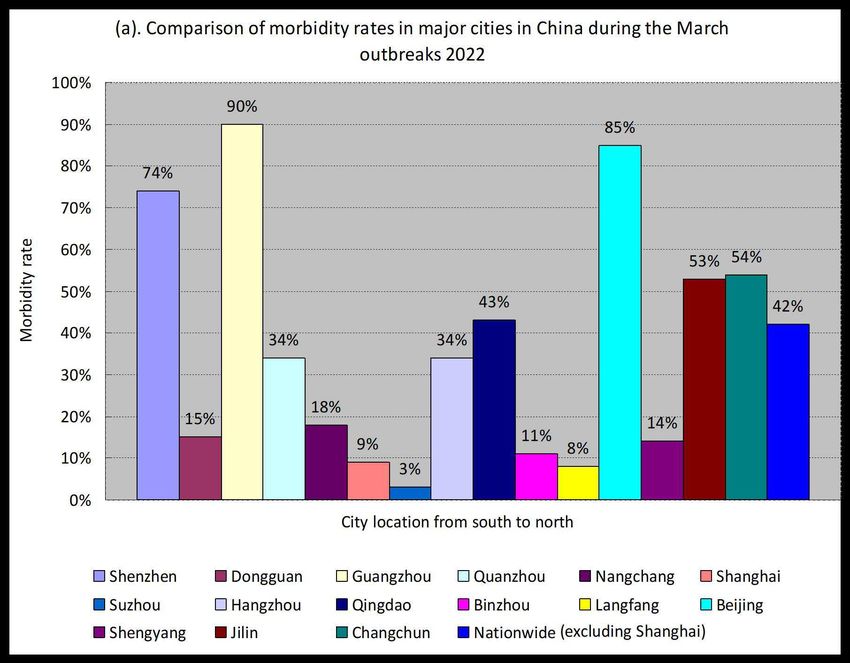
subvariant from 21 February 2002 to 14 May 2022. There were major differences in morbidity
rates between the sixteen cities since the start of the March outbreaks. Their morbidity rates
varied from 3% (in Suzhou) to 90% (in Guangzhou). Since Shanghai had a relatively low morbidity
rate of 9% but the highest number of total cases of infection (619,259), the nationwide average
morbidity rate excluding Shanghai showed a much higher figure of 42% than the nationwide rate
including Shanghai (15%). Among all cities, Guangzhou had the highest morbidity rate of 90%,
which was twenty-nine times higher than that of Suzhou (Fig. 2(a)). These differences indicated
that the ratios of symptomatic cases to asymptomatic cases varied much in different cities in
China, even in early stages of the outbreaks such as in March (Fig. 2(b)).
Figure 2. Comparison of morbidity rates in major cities and breakdown numbers of cases in March
The reasons why there are such differences are unknown. None of the reasons is related to any
of the influencing factors of epidemics known today. There are groups of cities that are similar to
be compared for the features of the outbreaks because the cities of each group are close or very
close with each other, and having similar climate, population density and characteristics, diet and
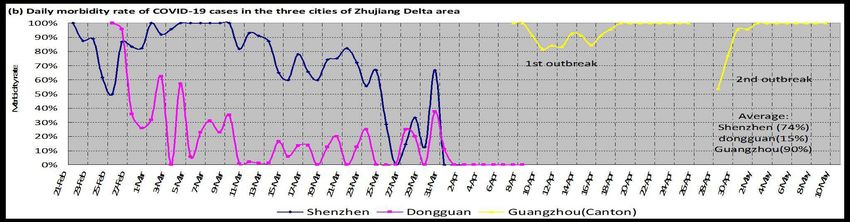
living habits, religious background, educational background and medical resources etc. The first
group of similar cities are Shenzhen, Dongguan and Guangzhou in Zhujiang Delta area, which are
three of the southernmost cities in mainland China. During the early stages of outbreaks from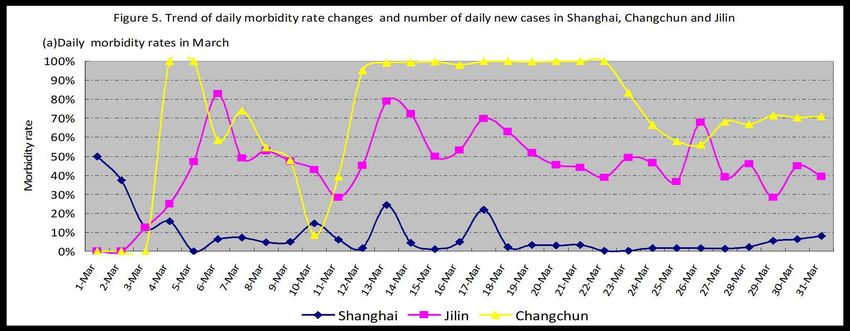
Figure 3. Comparison of outbreaks and morbidity rates in major cities in China 2022
1 Mar 2022 to 9 March 2022, Shenzhen and Dongguan, both adjacent to Hong Kong, are also
adjacent, and both with a very high population density of 11 to 18 million people on
approximately 960-770 square miles of land each (5,6,7), and, both being immigrants cities
(portion of immigrations being 50% or above in the population) with relatively low average age of
population (Shenzhen at 32.5 years and Dongguan at 34 years on 1 November 2020 (6,7), have
contradictory morbidity rates, from 100% to 92% in Shenzhen and 63% to 0% in Dongguan (Fig.
3(a) & (b)). The final average morbidity rates of Shenzhen, Dongguan and Guangzhou (with late
outbreaks of Shanghai origin) are obviously different too, as 74%, 15% and 90% respectively (Fig.
1 and Fig. 3(b)).

Outbreaks of SARS-CoV-2 Omicron BA.2 started in the end of February in both Shenzhen and
Dongguan, who had almost the same level of transportation of people and cargo back and from
Hong Kong. A large quantity of cargo and drivers arrived in Shenzhen and Dongguan with an
unknown quantity of virus every day during the surge of cases of infection of Omicron BA.2 in
Hong Kong in the early stage of its COVID-19 outbreak in February 2022. When its medical system
was brought to breakdown by the epidemic, Hong Kong was unable to admit all COVID-19
patients who needed hospitalization. People wished to escape from the outbreak. The border
between Hong Kong and Shenzhen or Dongguan was strictly controlled to allow only limited
number of travelers across through, at approximately 10% of the normal level in 2019. Illegal
entries from Hong Kong to Shenzhen and Dongguan were reported as many dozens according to
news release by Public Security Bureau of Shenzhen. “Hide and seek” followed-up to implement
mandatory isolation and PCR tests, because travelers by illegal entry did not wish to be found
while medical workers wished to call everybody for tests. These outbreaks resulted in 994 cases
of infection in Shenzhen and 1,314 cases of infection in Dongguan within one month, and each
developed simultaneously on its own trend of morbidity rate. The rate seemed unlikely to change
much until the outbreaks were close to be contained by stronger anti-epidemic measures in late
March (Fig. 3(a) & (b). The difference in their final average rates, which were 74% in Shenzhen
and 15% in Dongguan, was still enormous. The rates showed stronger fluctuations in days with
fewer daily new cases (Fig. 3(a) & 3(b)). One essential event was a whole-area lockdown in
Shenzhen, including 11 districts, for one week starting from 14 March 2022, which was
announced in the evening of 13 March 2022. On 18 March 2022, the Shenzhen authority
cancelled the lockdown of 5 districts with “zero active COVID-19 cases”. The final termination of
the lockdown started at 00:00 on 21 March 2022.
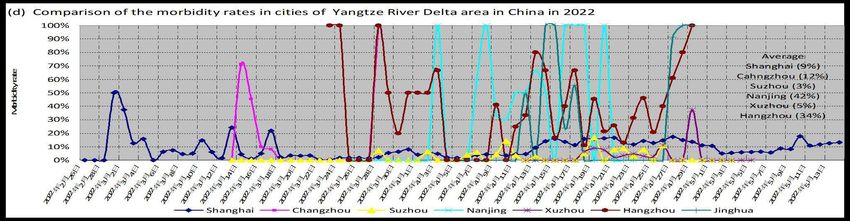
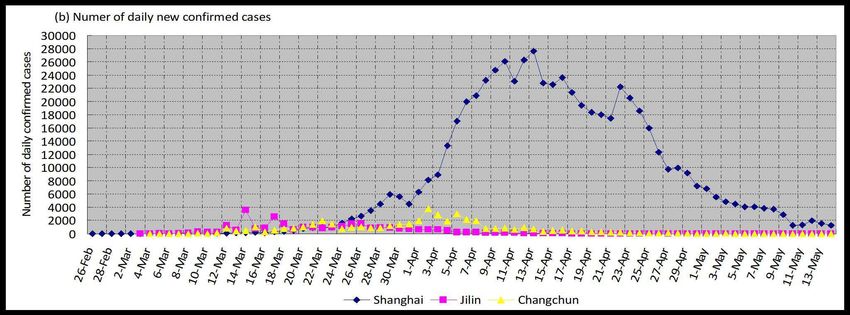
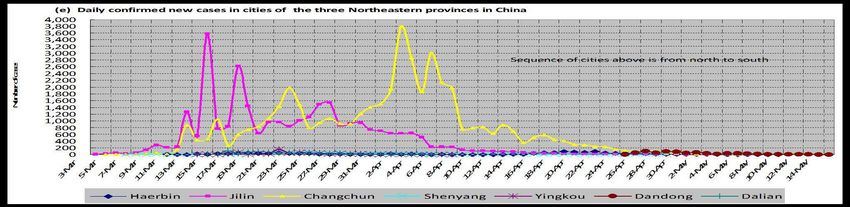
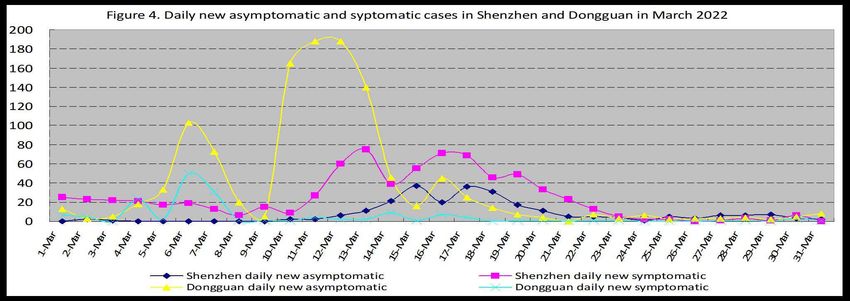
Dongguan’s outbreaks did not follow the trend of expansion of its neighbor Shenzhen and had
two extraordinary surges of asymptomatic cases (Fig. 4, the red triangle line). The first wave was
from 03 March to 06 March, and the second was from 09 March to 12 March. There were belated
prevention measures disclosed later on, but this kind of belated measures usually brought to
society more hidden transmission between cases of infection that were not diseased or did not
consult a doctor, likely with an outcome of a higher morbidity rate. However, this did not happen
in Dongguan. Its morbidity rate remained steadily low (fig. 3(b))

The second group of similar cities are Shanghai, Changzhou, and Suzhou, Nanjing, Xuzhou,
Hangzhou and Jinghua (with location from close to far with Shanghai), which are the largest cities
in or around Yangtze River Delta area in eastern China. Among them, Suzhou and Shanghai are
adjacent. With origin from Hong Kong, Shanghai’s outbreak have a relatively slow start with one
or two cases daily from 26 February to 01 March 2022. Rapid expansion of numbers of daily
confirmed new cases appears after 13 March 2022, and the number reaches nearly 6,000 per day
within a period of 17 days (Fig. 3(c)). Daily new cases keep growing fast to 27,605 by 13 April
2022 and reach to a total of 619,259 confirmed cases on 14 May 2022. The outbreaks in the
other six cities are all originated from Shanghai. By the end of the outbreaks (by 14 May 2022 for
Shanghai), the final average morbidity rates are 9%, 12%, and 3%, 42%, 5%, 34% and 31%
respectively (Fig. 3(c) & (d)), showing major differences.

The third group of similar cities are Haerbin, Jilin, and Changchun, Shenyang, Yingkou, Dandong
and Dalian from north to south, which are the large cities in the three northeastern provinces in
China, with Jilin and Changchun only 111 kilometers apart. The outbreaks started in Jilin on 03
March 2022 with unknown sources of origin, though being later reported by local media as from
South Korea. Changchun’s outbreaks followed one day after Jilin. Changchun and Jilin are the
most affected among the seven cities above. The morbidity rates in Jilin and Changchun also
differ from the beginning, with Changchun’s 85% (yellow line in Figure 3(f)) and Jilin’s 50% pink
line in Figure 3(f)). And their levels seem steady in the early stage of outbreaks too. By the end of
the outbreaks in these seven cities, the final average morbidity rates are 57%, 53%, and 54%, 14%,
28%, 6% and 24% in Haerbin, Jilin, and Changchun, Shenyang, Yingkou, Dandong and Dalian
respectively (Fig. 3(e) & 3(f)), showing major differences too.

Shanghai, Changchun and Jilin were the most affected cites during the March outbreaks, with
619,259, 46,255 and 28,955 people infected respectively. Shanghai its peak on 13 April Jilin’s
number of daily new cases of Jilin, Changchun and Shanghai declined from its peak on 26 March,
2 April and 13 April of 2022 respectively (Fig. 5(b)). The morbidity rates of these three cities were
apparently different too, either in March (Fig. 5(a)) or in their whole period of outbreaks (Fig.3).
The morbidity rates in the cities with the same origin (Shanghai origin) in the middle and late
stages of the March outbreaks also vary much, with the highest of 90% in Guangzhou and the
lowest of 3% in Suzhou (Fig. 1 & Fig. 5(c)). Cities are grouped together in close columns by
distances from Shanghai in figure 5(c) for comparison. Such large differences of morbidity rates
are not related to the location of cities which are greatly different in distances from Shanghai and
some are in the far north in China while some in the far south.

Morbidity rate did not fluctuate much

Morbidity rates did not fluctuate much in some cities as described above. And Shanghai was the
one with the least fluctuation among all the major cities. Shanghai’s outbreaks had a relatively
slow start with one or two cases daily from 26 February to 01 March 2022, reaching over 100
cases on 13 March. Rapid expansion of numbers of daily confirmed new cases appeared, and the
number reached nearly 6,000 per day within a period of 17 days (Fig. 5(b)), with a total number
of cases of 36,548 by 31 March 2022. Daily number of cases kept growing fast to 27,605 by 13
April 2022 and reached a total of 619,259 on 14 May 2022. The morbidity rates of daily new
cases here ranged from 8% to 0% over 24 days of the whole month of March (31 days) (Fig. 5(a)).
The average morbidity rate of total confirmed cases by 14 May was 9% (Fig. 2(a)). As a city with
the most critical number of cases of infection among the three (the other two are Changchun and
Jilin), Shanghai’s morbidity rate is one of the steadiest among all major cities with statistical
significance. Large fluctuation of morbidity rate might occur in Shanghai in its ending stage of
epidemic because such fluctuations occurred in other cities (Fig. 3(d) & 3(f)). Fluctuations of daily
morbidity rates in different cities were also unpredictable due to unknown reason.

Rapid spread under strict measures

China had managed COVID-19 prevention well by adhering to its “dynamic zero-COVID Policy”
until Omicron BA.2 attacked it. The daily new confirmed domestic cases remained no more than
100 before 21 February 2022. There was no easing of strict mandatory quarantine and isolation.
However, the rapid expansion of daily reported new infection cases revealed that Omicron BA.2
subvariant could still spread very fast and wide in China, with over 738,000 people infected in
mainland China within 66 days, and with the fastest in Shanghai where 619,259 people infected
with SAR-CoV-2 Omicron BA.2 (Fig. 1 & Fig. 5(b)). Current strict prevention measures were not able
to stop the rapid epidemic expansion of Omicron BA.2. China once again had to face the choice of
whether to take a higher economic and social cost to control transmission.

Omicron BA.2 transmission unpredictable

The transmission of Omicron BA.2 is unpredictable, nor is its morbidity rate. Chinese cities are
more like isolated islands than those of other countries because of strict prevention measures.
This Omicron BA.2 subvariant seems to have developed a different pattern of virulence and
transmission in these isolated cities of China. Among the twenty major cities with outbreaks of
Omicron BA.2, nearly half of them have very low morbidity rates (Fig. 1 & Fig. 2(a)), including
Suzhou (3%), Langfang (8%) and Shanghai (9%). On the other hand, these ten cities have very
high percentages of asymptomatic cases in confirmed cases, including Suzhou (97%), Langfang
(92%) and Shanghai (91%). Three cities have very high morbidity rates: Guangzhou (90%), Beijing
(85%) and Shenzhen (74%). The average morbidity rate nationwide excluding Shanghai is 42%.

There are good aspects of the data, as summarized in the following:

Low severity rate and case fatality rate

Nationwide data show no available information for daily new severe cases in China. During the
March outbreaks in China in 2022, a percentage of 0.20% for the ratio of severe cases to
symptomatic cases (0.10% for severe cases to confirmed cases) is reported in Jilin Province
(Number of accumulated severe cases drops from 19 on 01 March to 6 on 12 March due to
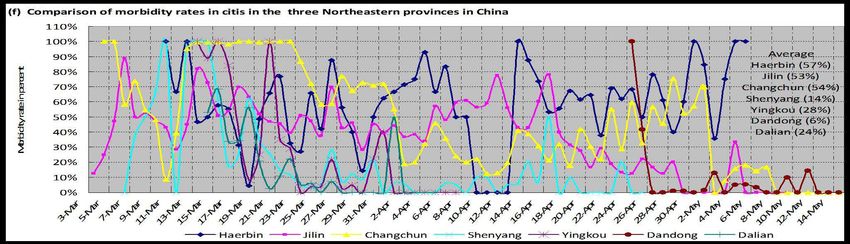
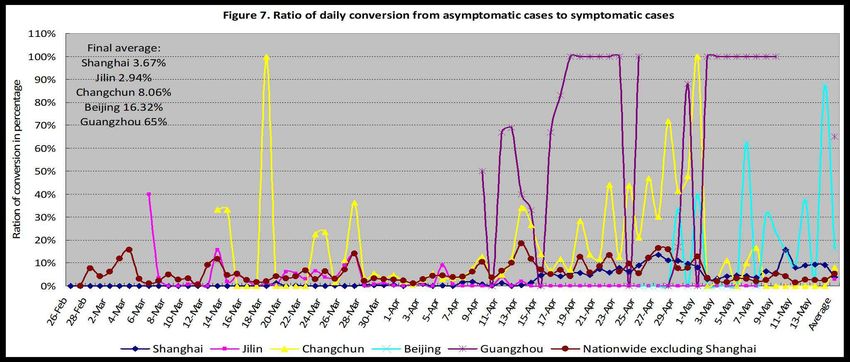
recovery or converting of hospitalized COVID-19 patients from February). The case fatality rate is
2.6/20,000 in symptomatic cases (or 1.38/20,000 in confirmed cases) in Jilin, as 2 deaths being
reported on 18 March 2022, and 1.68/50,000 in symptomatic cases (or 4/50,000 in confirmed
cases) nationwide excluding Shanghai and 1% in symptomatic cases (or 0.09% in confirmed cases)
in Shanghai.

Fewer cases need hospitalization

Only Jilin Province publishes data on the classification of diagnosed COVID-19 patients daily. Jilin’s
data shows that 98.72% of symptomatic cases were diagnosed as mild. A total of 1.09% of
symptomatic cases (or 0.56% of confirmed cases) are moderate, and 0.20% of those (or 0.10% of
confirmed cases) are severe in Jilin Province. A total of 0.66% of confirmed cases need
hospitalization (following guidance of the national Diagnosis and Treatment Protocol for
COVID-19 Patients8), including 0.10% of severe or critical cases. Recovered cases retested positive
have not been reported but are estimated to be approximately 1%, close to the figure announced
by Shenzhen 3rd People’s Hospital on a news release in March 2022.

Asymptomatic cases conversion

The ratios of asymptomatic cases converting to symptomatic are 2.94%, 8.06% and 16.32%,
3.76%, 63.35%, 5.29%, 3.93% respectively, in Jilin, Changchun and Beijing, Shanghai, Guangzhou,
nationwide excluding Shanghai, nationwide including Shanghai, from north to south (Fig. 7).
These percentages may indicate the impact to the related actual numbers and ratios in the
jurisdictions where such converting data are not reported.

Discussion

Similar differences of morbidity rates exist during Wave V of COVID-19 Pandemic driven by
SARS-CoV-2 Omicron BA.1 subvariant in Canada. Rapid expansion of numbers of weekly new
confirmed cases is also seen during Pandemic Wave V in Canada (Fig. 6(a)). 1,185,976 confirmed
cases with symptom clearly stated have been reported in all jurisdictions except British Columbia
and Yukon, where no data is available, including 984,690 cases in Wave V in Canada from 31
October 2021 to 5 March 2022. Morbidity rates in the four jurisdictions are all above 50% except
Quebec, which derives to a different direction of less symptomatic cases after the 50th week of
2021 with morbidity rates from 19% to 29% in ten out of the last eleven weeks (Fig. 6(b)). The
average morbidity rates in Quebec, Ontario, and Prairies, Atlantic, which usually conceals the
differences in cities or smaller areas, are 37%, 82%, and 83%, 85% respectively (Fig. 6(b)),
showing major differences too. But similar differences are not apparently found in Wave IV driven
by Delta variant in Canada, with 201,286 confirmed cases, from 13 June 2021 to 30 October 2021
(Fig. 6).

It seems that the morbidity of SARS-CoV-2 Omicron is always uncertain, possible to be very
different to have either more symptomatic cases or more asymptomatic cases in people infected,
some even coming up with quite contradictory figures, e.g., 90% symptomatic or 90%
asymptomatic, in the same period of outbreaks driven by the same subvariant of virus. There
finally exist cities twenty-fold differences in morbidity rates (29-fold at most) in China during the
March outbreaks in 2022. There are also obvious differences in morbidity rates in the
jurisdictions in Canada during Wave V of Pandemic driven by Omicron variant from November
2021 to March 2022. Case fatality rates and the ratios of conversion of asymptomatic cases are
also largely different as described in the above. But such features are not likely to be seen in the
outbreaks driven by SARS-CoV-2 Delta variant and its preceding variants.

Questions have been raised whether there are causes of the differences of the features of
COVID-19 Pandemic in different cities and jurisdictions other than traditional influencing factors
contributing to epidemics of infectious disease and whether there is correlation between the
SARS-CoV-2 viruses in outbreaks. We have compared three groups of similar cities and
jurisdictions so as to wipe out the relevance of influencing factors known of infectious diseases,
including climate, population density and characteristics, diet and living habits, religious
background, educational background and medical resources etc. , but found no clue. Possible
explanation may be related to quantum mechanics. The unpredictability of the features of
SARS-CoV-2 Omicron variant is in quite much the same spirits of the original Uncertainty Principle,
which have been tested and stated as the certainty of Uncertainty9.

We have likely found evidence that SARS-CoV-2 Omicron variant share information of their
situations, e.g., location, transmission route, and limitation of transmission, threat of reproduction,
intervention of medicine, vaccine or non-pharmaceutical measures etc. They may change in
morbidity if there is any change of such situations. Lockdowns bring tremendous changes of the
situation of the viruses and the morbidity rates of the Omicron BA.2 subvariant change accordingly.
For example, the implementation of a whole-area lockdown in Shenzhen (with morbidity rate
higher than 75% before the lockdown) from 14 March to 21 March 2022 brings the change of
morbidity rates in Shenzhen, Dongguan and Langfang (a northern city 2,100km away from
Shenzhen), being lower than that before the lockdown (the dark blue line and the pink line in
Figure 3(b)), or resulting in stronger fluctuations of daily morbidity rates in Binzhou (a northern
city 2,000km away from Shenzhen) and Shenyang (a northeastern city 2,600km away from
Shenzhen) in the following week. The same happens during the implementation of the lockdown
in Shanghai (with morbidity rate as low as 4% before the lockdown) from 2 April 2022 (see Figure
3(d) for the comparison of morbidity rates in Nanjing and Hangzhou after 2 April). And a change
can also be seen in Changchun (1,400km away from Shanghai) after 2 April 2022, with
contradictory figures of daily morbidity rates to that before (yellow line in Fig. 3(f)). Similar
changes may also be observed when threat of reproduction of SARS-CoV-2 Omicron appear, e.g.,
declines of daily new confirmed cases due to either herd infection or intervention of medicine,
vaccine or non-pharmaceutical measures including isolation. SARS-CoV-2 Omicron viruses seem
to be able to share the information of threat, and more frequent and tremendous fluctuations of
morbidity rates may be more commonly observed among cities with more declines of daily new
cases (Fig. 3 & Fig. 5), e.g. in Shenzhen and Dongguan after 21 March 2022 (Fig. 3(a) & 3(b)), in
Changchun after 11 April 2022 (Fig. 3(e) & 3(f)), and in Shanghai after 12 April (Fig. 3 (c) & (d)), in
Canada after 2 January 2022 (Fi. 6). Relatively more percentage of symptomatic cases also
appears after the peak of daily new cases in Shanghai on 12 April 2022. The threat of surviving of
the viruses in Shanghai seems to come out with more asymptomatic cases converting to
symptomatic as well (Fig. 3(c) & 3(d), & Fig. 7), contributing to higher daily morbidity rates after
14 April 2022. Such kind of correlation, in spite of distance, may indicate nanometer scale of
interaction of SARS-CoV-2 Omicron variant with local environment that wipe out phase
correlation between quantum states. There was also a possibility of SARS-CoV-2 Omicron variant
being more likely to have quantum evolution which is less favorable than classical evolution10,
and finally bringing COVID-19 Pandemic to end.

Possible contribution to epidemiology
No present mathematical models can tell or predict the transmission of SARS-CoV-2 Omicron
variant stated above. Rapid epidemic expansion has been observed during the March outbreaks
driven by Omicron BA.2 subvariant in China and in Wave V of COVID-19 Pandemic driven by
Omicron BA.1 subvariant in Canada. Some new features of the outbreaks are also revealed by
data analyses, including large differences of morbidity rates with steadiness in cities,
unpredictable transmission, and low severity rate and low hospitalization need. The study above
may bring new thoughts for correction of present epidemiological theory and mathematical
models. It may also give other countries time to be better prepared for the coming waves driven
by Omicron variant, including preparation and allocation of medical personnel and equipment,
cabin laboratories and isolation facilities, and supply of daily necessaries, etc.

Conclusion

SARS-CoV-2 Omicron BA.2 subvariant can transmit rapidly even under the conditions of very strict
mandatory measures. Its transmission and morbidity rate in a specific area is unpredictable.
Enormous differences in morbidity rates may appear in different areas and may not be related to
any of the traditional influencing factors known. There are features that present traditional laws
of transmission and reproduction cannot completely explain. In their actual total confirmed cases,
91% in Shanghai and 57% nationwide excluding Shanghai are asymptomatic during the March
outbreaks of Omicron in China in 2022. Among all asymptomatic cases nationwide, 3.93% convert
to symptomatic. The percentage of mild cases in symptomatic cases may be as high as 98.72%,
and the percentage of severe cases in symptomatic cases may be as low as 0.20%, under the
circumstances of strict mandatory measures and of a vaccination rate over 87% in the population.
Thus, only 2% of symptomatic cases need to be hospitalized. Deaths may be very rare in some
cities but situations may be very different in other cities. Case fatality rates in specific areas are
also unpredictable, with large differences in Jilin, Shanghai and nationwide excluding Shanghai.
1% of recovered symptomatic cases in China may be retested positive in a short time after their
recovery from COVID-19. And, similar differences of morbidity rates also exist during Wave V of
COVID-19 Pandemic driven by SARS-CoV-2 Omicron BA.1 subvariant in Canada.

Acknowledgements

Yeyu Freddie Dai thanks Prof. Naomi Nishimura of University of Waterloo, Canada and Prof. Tjaart
P. J. Krüger of University of Pretoria, South Africa, for their comments.

References:

1
  Lewis, D. (2022). Will Omicron finally overpower China’s COVID defences?. Nature, 604(7904),
17-18. doi: 10.1038/d41586-022-00884-z
2
   National Health Commission of the People’s Republic of China. (2021).Full text of
DiagnosisandTreatmentProtocolforCOVID-19Patients(Tentative8thEdition).pdf (chinadaily.com.cn)
3
  Worldometers. (2022). Covid-19 Coronavirus Pandemic updates. COVID Live - Coronavirus
Statistics - Worldometer (worldometers.info)
4
  Xinhua News Agency. (2021). China's population aging deepens with 18.7% aged 60 or above.
China's population aging deepens with 18.7% aged 60 or above- China.org.cn
5
   Xiao, M, et. al. (2010). Acta Geographica Sinica 2010, Vol. 65, Issue (4): 443-453.
doi: 10.11821/xb201004006
6
   Statistics Bureau of Shenzhen Municipality. (2021).
http://tjj.sz.gov.cn/ztzl/zt/szsdqcqgrkpc/szrp/content/post_9138049.html
7
   Statistics Bureau of Dongguan. (2021).
http://tjj.dg.gov.cn/pczl/rkpc7/content/post_3524625.html
8
   National Health Commission of the People’s Republic of China. (2022). Full text: Diagnosis and
Treatment Protocol for COVID-19 Patients (Tentative 9th Edition).
(ef09aa4070244620b010951b088b8a27.pdf
9
   Rozema, L., Darabi, A., Mahler, D., Hayat, A., Soudagar, Y., & Steinberg, A. (2012). Violation of
Heisenberg’s Measurement-Disturbance Relationship by Weak Measurements. Phys. Rev.
Lett.109. 100404. doi: 10.1103/PhysRevLett.109.100404
10
    Martin-Delgado, M. (2012). On Quantum Effects in a Theory of Biological Evolution. Sci
Rep 2, 302. doi: 10.1038/srep00302
Supplementary Files
This is a list of supplementary les associated with this preprint. Click to download.
Cov2221Feb14MayforNature1.xlsYou can also read