Reading Plus Program: Impact on Reading CRT Scores By Improving Concurrently Visual, Perceptual & Cognitive Skills
←
→
Page content transcription
If your browser does not render page correctly, please read the page content below
St. Elizabeth Seton Elementary School
               Rapid City, South Dakota

Reading Plus ® Program: Impact on
Reading CRT Scores By Improving
 Concurrently Visual, Perceptual &
         Cognitive Skills

                      John J. Usera, Ph.D.
       Institute for Educational Leadership & Evaluation
                      Rapid City, SD 57702

                        October 2012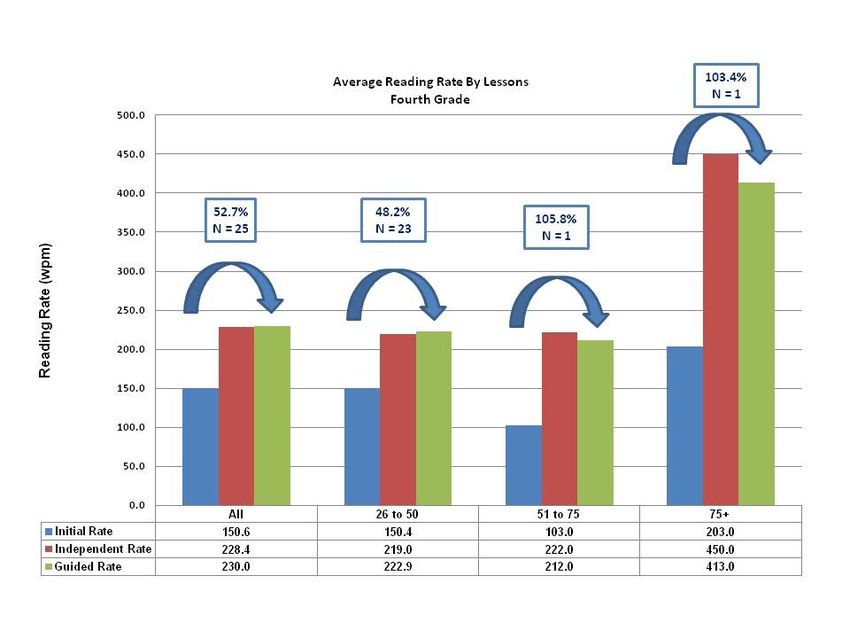
Reading Plus ® Program: Impact on Reading CRT Scores By
 Improving Concurrently Visual, Perceptual & Cognitive Skills
What is Reading Plus?

         The Reading Plus® Program improves reading proficiency by helping struggling students
with silent reading fluency, vocabulary development, and comprehension. While Reading Plus®
develops essential vocabulary, analytical reading and comprehension skills, it is the fluency
building activities that make the system unique and successful. Reading Plus® assesses and
develops a student's Fundamental Reading Process, visual, perceptual and cognitive skills that
are essential for fluent silent reading at adequate rates with excellent comprehension. These
skills are subliminal, and involve over 15 high speed visual and perceptual processes that
interact from 3 to 5 times per second as the reader's eyes move along lines of print.
        Since these processes are subliminal, they cannot be directed by a teacher, nor
controlled by a student. If a student's visual skills are inadequate, words may be blurred or
doubled, reading will be less comfortable and attention will suffer. If students cannot perceive
words accurately in a fraction of their usual eye pause time, they will inadvertently make multiple
eye-stops to recognize each word. This delayed word recognition encourages visual wandering
which consequently reduces comprehension. The silent reading fluency skills developed by
Reading Plus® improve attention and concentration, short term memory, literal understanding
and the rate at which students can read comfortably with excellent comprehension. (Southwest
Education, 2012)

Review of Literature

      How important is reading fluency? According to Hudson, Lane, and Pullen (2005),
Reading fluency is one of the defining characteristics of good readers.” Each of the features of
fluent reading can be linked to reading proficiency. Reading accuracy is linked to reading
proficiency because it encompasses many reading skills. In order to accurately identify words
students must utilize visual, semantic, and syntactic cuing systems. Students must have a strong
ability to blend phonemes, recognize phonograms, and understand sound-symbol
correspondence.
       The second link is to reading rate. Reading quickly demonstrates a student’s mastery of
word recognition displayed by fluid and effortless reading. Students have developed rapid word
recognition skills, and apply it to text. Readers move swiftly across the page leaving cognition
free for comprehension (Hudson, et al., 2005).

St. Elizabeth Seton Elementary School                                                Page 2 of 27
Version 2.0                                                       Reading Plus Evaluation Report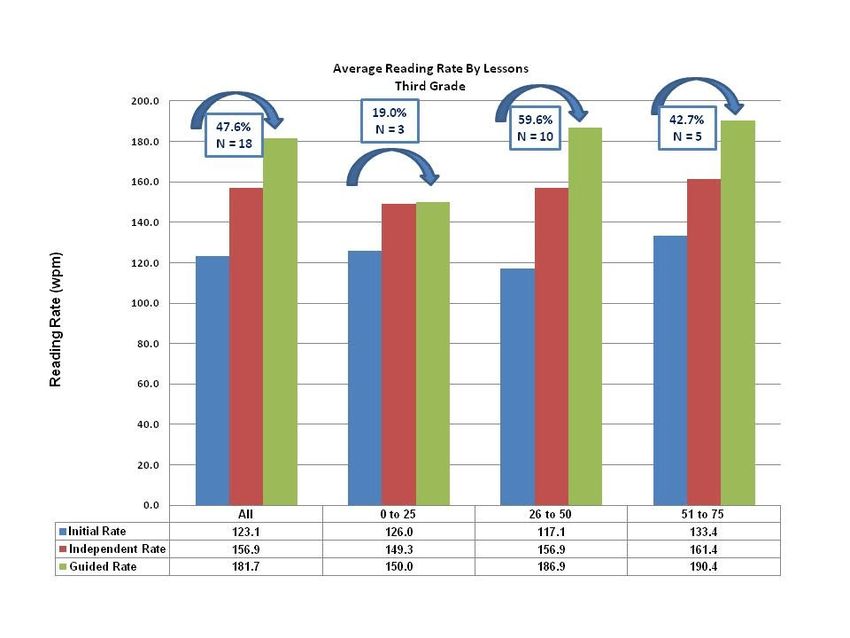
Finally, prosody is linked to proficient reading. Prosodic readers demonstrate an
understanding of morphemic, syntactic, semantic, and pragmatic systems to read with
expression (Hudson, et al., 2005). This expression and intonation is also linked to
comprehension (Goodman, 1964). The key player in each of these links is the notion that
reading fluency is related to comprehension. The characteristics of reading fluency, effortless
word recognition, reading in meaningful phrases, reading at an appropriate rate, and prosodic
reading, if done automatically, allow cognition to be focused on comprehending the text
(Hudson, et al., 2005).
      All aspects of fluency can be explicitly instructed, and precisely assessed. Fluency can
be used to aid in comprehension, as well as assess it. How has fluency’s role in reading
education changed? It defines proficient readers, and is incorporated into the balanced literacy
program (Rasinski, 2004). Reading fluency is composed of accuracy, word recognition, and
prosody; by no amount of neglect can it ever be taken away thanks to the diligence in reading
fluency research.
       Rasinski et al. (2011) examined a large-scale implementation of Reading Plus® to
validate the effects as well as the feasibility of deployment of Reading Plus® within a wide range
of school settings. A total of 16,143 students from grades 4 through 10 in 23 schools in Regions
II and III in the Miami-Dade County Public Schools participated in the study. The results
indicated that students participating in Reading Plus® for a minimum of 40 or more lessons over
approximately six months made significantly greater gains on both the criterion-referenced and
norm-referenced reading tests that are part of the Florida Comprehensive Achievement Test
(FCAT) than students who did not participate in the program. Positive results also were
demonstrated for various subpopulations often considered at risk for reading difficulties. Black,
Hispanic, special education, and learning disabled students who participated in the Reading
Plus® intervention demonstrated significantly and substantially greater gains in measures of
reading achievement on both the criterion referenced test (CRT) and norm referenced test
(NRT) portions of the FCAT than students not participating in the intervention.
      Schlange, et al. (1999) evaluated Reading Plus 2000 at Shields Elementary School in
Chicago on sixth and eighth grade students. The at-risk students received three sessions per
week for a total of 40 sessions, in addition to their regular classroom instruction. The results
showed that students in the sixth and eighth grades who received training with Reading Plus®
made significant improvements (p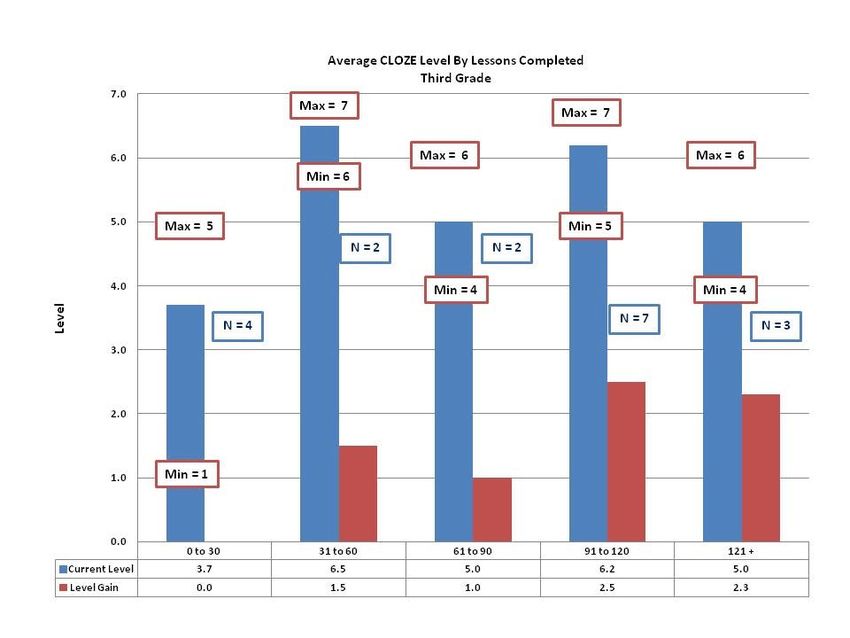
Program Intervention

       Reading Plus® is a computer-based reading intervention system that uses technology to
provide individualized scaffolded silent reading practice for students in the second grade and
higher. St. Elizabeth Seton Elementary School introduced the program into their current
reading program in order to help students improve upon their reading proficiency. The seven
components of Reading Plus® provide extensive engagement through differentiated reading
activities.
       Reading Plus® picks up where phonics and oral reading instruction leave off, providing
rapid and sustainable comprehension and silent reading fluency gains. The program provides
sustained attention, word recognition automaticity, grade appropriate reading rates, enhanced
vocabulary, and improved reading comprehension. A 20-minute computer-based placement
test is administered to determine the appropriate instructional programs and effective starting
levels for each student. Instructional paths are individually designed and dynamically adjusted
for each student, ensuring effective practice with activities that build attention and concentration,
silent reading fluency, vocabulary enhancement, and comprehension skill mastery.

Guided Reading

       Guided Reading is designed to improve visual and perceptual skills, short-term memory,
                        TM

and silent reading fluency skills. In addition to improvements in rate and comprehension,
students increase their ease and comfort in reading and their concentration. Reading selections
provided are leveled to the student’s reading ability in a variety of genres to motivate student to
read. Students read each story in a self-paced format, a timed format, or a guided window
format. Within a reading selection, students complete a number of skill-coded questions with re-
reading opportunities. These questions focus on the development of a set of major
comprehension competencies. These competencies include literal understanding, analysis,
appreciation, interpretation, and evaluation.
       Reading rates are automatically elevated in Guided Reading as students complete
                                                                        TM

lessons with 70% comprehension or higher. Initially, students are assigned a starting rate the
first time they achieve 70% or higher comprehension. From this point forward, a student’s
training rate will be elevated slightly each time 70% plus comprehension is achieved in a given
reading selection. These rate increments may be modest, average, or more aggressive
increases based on an analysis of average comprehension performance of a student. Norm and
target rates have been set for each grade level. As students achieve the target rate for a grade
level, then he or she becomes eligible for the next grade level. These target rates are displayed
in the chart below in relation to grade-level content and norm rates.

St. Elizabeth Seton Elementary School                                                 Page 4 of 27
Version 2.0                                                        Reading Plus Evaluation Report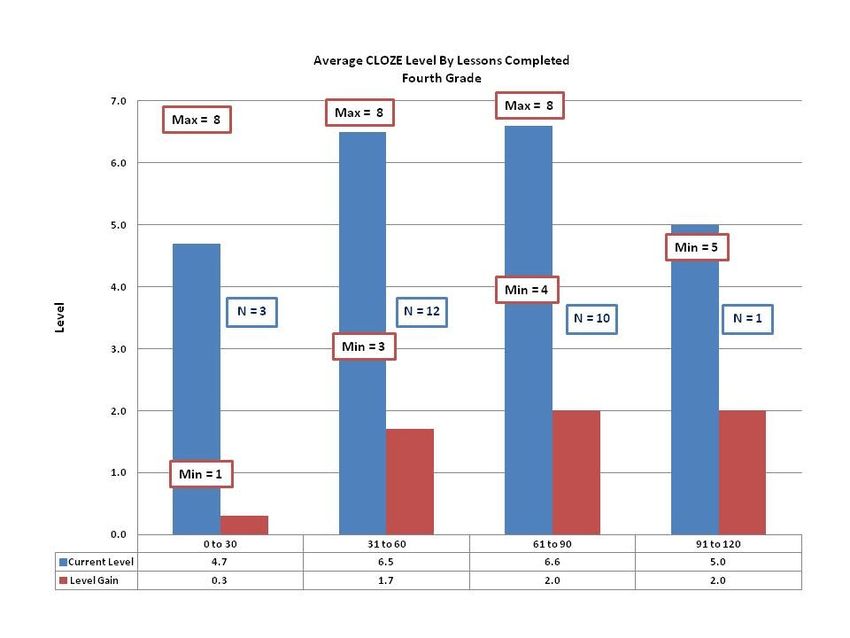
Table 1.0
                                 Guiding Reading Target Rates
                                      Words Per Minute (wpm)
 Grade
              1      2      3         4     5       6        7     8       9      10     11      12
 Level

  Norm
             80    115     138     158    173      185      195   204    214     224     237     250
 Rates

 Target
            140    170     200     230    250      270      280   300    310     325     345     365
 Rates

        Students will engage in Perceptual Accuracy Visual Efficiency (PAVE) scan training that
will greatly facilitate their competency in terms of visual and functional factors. A growth in visual
competency facilitates higher reading rates.

Perceptual Accuracy/Visual Efficiency (PAVE)

        The Reading Plus PAVE warm-up program, through scan and flash activities, builds
                                 TM

visual skills and visual memory, the most basic skills necessary for fluent and efficient reading
and improved spelling. In Scan, students are asked to count the number of times a “target”
element (number or letter) appears on the screen as three random elements are presented in a
left-to-right manner. The initial speed of the scan is determined by the student’s grade level and
increases, remains stable, or decreased, based on correct responses, with 120 lines per minute
as the maximum. The scan rate range for students K-1 is 10 to 60 lines per minute (lpm) with an
initial rate of 20 lpm, or 1 second per element scanned. The scan rate range for grades 2-4 is 10
to 70 lpm with an initial scanning rate of 30 lpm or 0.66 seconds per element scanned. The scan
rate range for grades 5 and higher is 20 to 80 lpm with an initial scanning rate of 40 lpm or 0.5
seconds per element scanned.
         In Flash, a series of ten exposures, a set of one to nine elements (numbers, uppercase
letters or lowercase letters) is flashed at 1/10 of a second. The initial number of elements is
determined by a student’s grade level, and increases as the student correctly types in what was
seen. A student is permitted 2 errors out of each series of 10 to advance to training with one
more element than is easily seen. The goal of Flash Training is to develop the ability to see and
repeat a desired number of elements in a single fixation, thus facilitating the retention of words
in continuous reading as well as spelling.

St. Elizabeth Seton Elementary School                                                  Page 5 of 27
Version 2.0                                                         Reading Plus Evaluation Report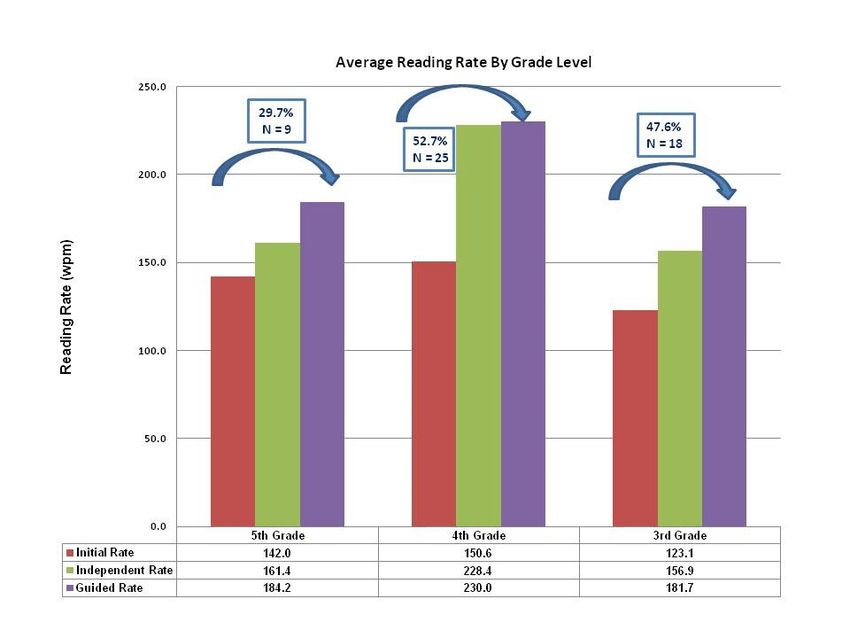
Cloze Plus

      The Cloze Plus program contains 20 lessons in each of its eight levels to develop
                       TM

vocabulary use and comprehension through structured context analysis activities in which
students learn to use clues from surrounding context to complete syntax. These lessons improve
predictive and inferential comprehension as well as vocabulary and provide invaluable guidance
in terms of these cognitive processes. Levels 1 and 2 are based on the Spache Readability
Formula (Spache, 1982) and Levels 3-8 on the Frye Readability Formula (Frye, 1977).
       There are three major types of completion activities:

       1.    Meaning Completion Close in which the student reads a paragraph in which a
             word is missing. He/She will then select the correct word from 4 choices, with only
             one being the correct answer.

       2.    Syntax Completion Close involves a student reading a paragraph with a missing
             word. The student will then be asked to type in the omitted word. Two or four
             different appropriate words may be used and the student is correct if he/she selects
             any one of the appropriate words.

       3.    Vocabulary in Context involves the student selecting the meaning of a “difficult” or
             unfamiliar word by using the context clues in the sentences surrounding the word.

       Students are placed in reading levels based on Reading Plus assignments. After
completing a set of Cloze lessons, the students are assessed to determine if they are ready for
the next level. The number of successful lessons completed and levels gained are indicators of
student reading improvement.

The Reading Around Words™

        The Reading Around Words™ (RAW) vocabulary program enables students to discover
word meaning through structured contextual analysis activities that promote meaning
integration, comprehension skills, and predictive ability. Each Reading Around Words™ practice
level (D-L) contains 240 key vocabulary words. Students take a series of 16 five-minute pre-
tests at intervals on each level and then complete word meaning and use practice activities with
the words missed in each pre-test.

        Initially, the target word is omitted from a sentence and flashed for students to create
orthographic recognition of the new word. The word is then presented in a paragraph in which
they select the correct meaning (or meanings) for the word. The paragraph is automatically

St. Elizabeth Seton Elementary School                                                Page 6 of 27
Version 2.0                                                       Reading Plus Evaluation Report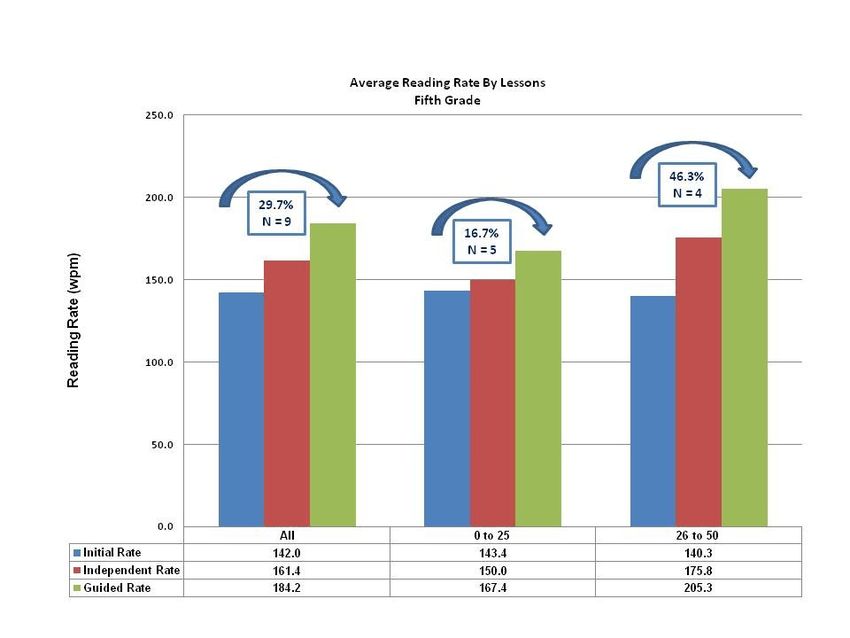
available for re-reading with highlighted clues after an incorrect response (or clues may be
requested before a response is made). After the context clue activity, the target word is again
flashed for students but now must be typed in from memory for spelling reinforcement.

Methodology
        A sample of 52 3rd to 5th grade students enrolled at St. Elizabeth Seton Elementary
School participated in this study. Reading Plus was the assigned intervention for these students
in order to help them improve upon their fluency level, vocabulary, and comprehension skills.
The DakotaStep reading test (South Dakota state achievement test) score were used to
measure any change in the student scores from the spring of 2011 (pre) to the spring of 2012
(post). Additionally, a series of on-going assessments were performed by the program to
measure progress in the four program components (Guided Reading, CLOZE, PAVE & RAW).
Pearson correlations were perform to measure relationships between the various program
component scores, rates, or gains. The Student t-test was performed to measure any significant
change in the DakotaStep scores as a consequence of completing a series of lessons.

        The Dakota STEP is South Dakota’s annual statewide assessment of student progress. It
is administered to students in grades 3 through 8 and 11 for Reading and Mathematics, grades 5,
8, and 11 for Science, each spring. The Dakota STEP fulfills the requirements for statewide
assessment contained in the federal No Child Left Behind Act of 2001 (NCLB). The assessment
instruments are composed of multiple-choice items for all content domains and grades. All
operational (core) multiple-choice items are worth one raw score point and are the basis of
student scores. All students are assessed with the same operational items for each content
domain. Linking (anchor or equating) items are operational items used to link the current
assessment to the previous year’s score scale, and are included in the count of core items.

       Scaling and equating of the Dakota STEP test is performed using the Rasch IRT model
(Rasch, 1960). A useful feature of the IRT model is that the test characteristic curve (TCC)
constructed as the sum of item characteristic curves (ICC) for items included in the test.
Coincidently, the test information curve, a composite of item information, can be computed as
well. This figure is useful in guiding the form pulling process so that the new forms not only meet
test specifications and maximize test information, but also are as parallel as possible across
years.

      In IRT, TCC is the sum of the item characteristic curve of each item in the test. TCC can
be computed based on the previous year’s test to assist form pulling as the baseline TCC. A new
TCC that is based on the items selected by content specialists based on the test specifications
can be computed. If a new form’s TCC shifts to the right from the baseline, it indicates that the
new form is more difficult than the baseline, and vice versa. However, a perfect TCC match is not

St. Elizabeth Seton Elementary School                                                 Page 7 of 27
Version 2.0                                                        Reading Plus Evaluation Report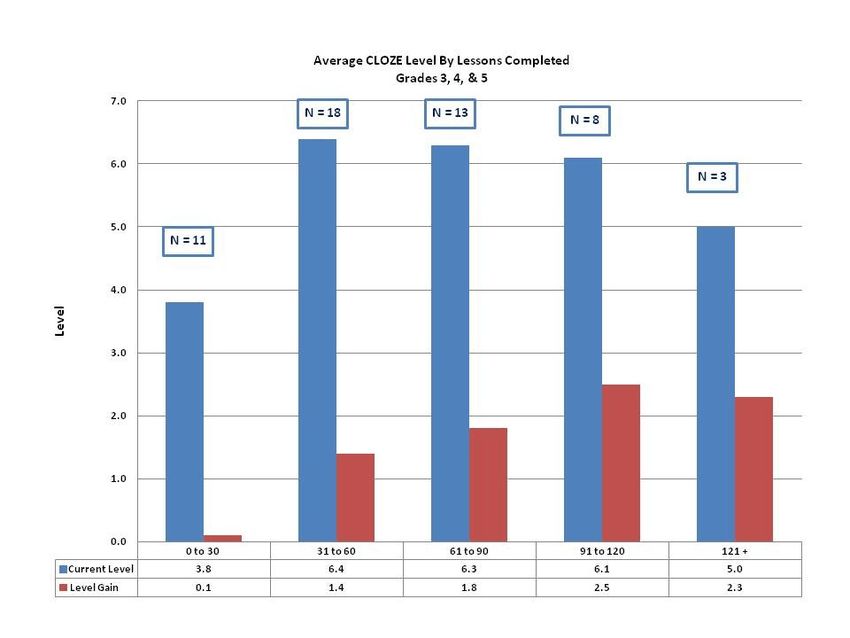
required but it is preferable to have a close match TCC between the new and base form. Item
information is an indicator of test reliability in IRT. Test information is the sum of the item
information based on all the items in the test. The higher value of test information indicates better
reliability. The process and principles of matching TIC are similar to which of the TCC.

St. Elizabeth Seton Elementary School                                                 Page 8 of 27
Version 2.0                                                        Reading Plus Evaluation Report
Results
There were four areas within the Reading Plus program that were assessed. Each area
provided data and information about the student’s reading ability. In the Guiding Reading
component students were measured at number of words per minute (wpm) they could read which
was then used to determine a reading level. Table 2.0 shows the mean rates and reading levels
by grade while Table 4.0 provides the same values by teacher. Table 3.0 shows the correlation
between the various component outcomes.
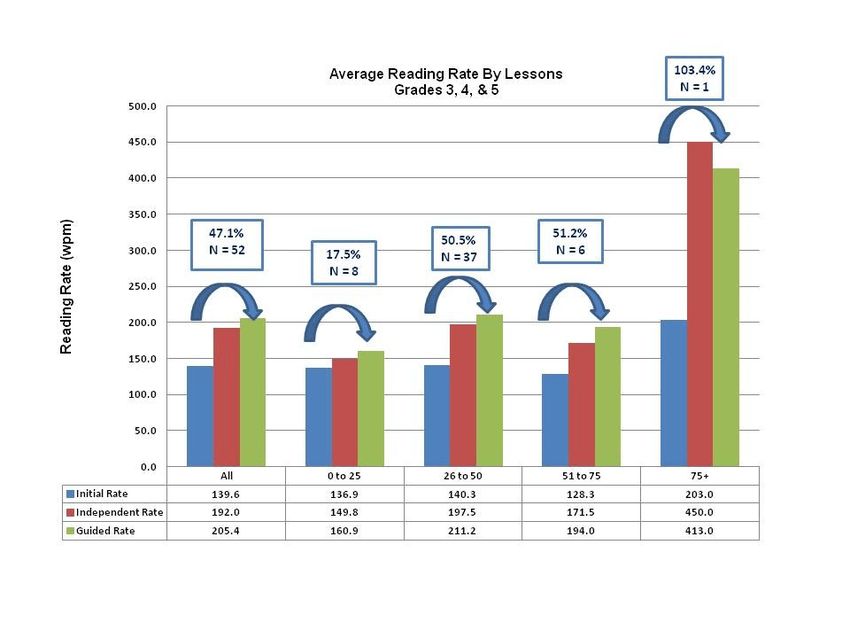
The third grade students showed a 47.6% gain in their mean guided reading rate from the
initial rate of 123.1 wpm. This was a statistically significant change at the 0.01 alpha level [t(32) =
8.74, p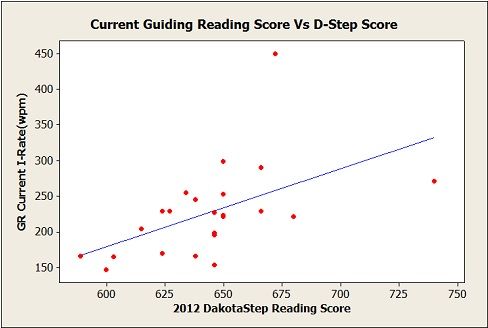
Table 2.0
                                                                 Reading Plus
                                            Mean Reading Score & Rate Analysis By Grade Level
                                                                     2011-12
                                       Guided Reading                                CLOZE                        PAVE                     RAW

                             Initial      Current              I-Rate
Grade        n                                      Current                                           Scan Rate 1        Current
                  Level       Rate                             Gained                     Total                                     Total        Level
                                           I-Rate   G-Rate                 Level Gain
                  Gain                                                                   Lessons          (lpm)          Flash     Lessons       Gain
                            (wpm )                  (wpm )      (wpm )
                                          (wpm )

   3        18     1.6       123.1         156.9     186.5       33.8          1.7           76.9          98.8            4.3       8.7          0.1

   4        25     1.8       150.6         228.4     230.0       77.8          1.7           58.7         108.6            4.6      14.3          0.4

   5         9     0.8       142.0         161.4     188.1       19.4          0.6           30.4          82.5            3.8       4.3           0

  All       52     1.5       139.6         192.0     208.5       52.4          1.5           60.1         100.4            4.3      11.8          0.3

        Note 1:   The scan rate range for grades 2-4 is 10-70 lpm with an initial scanning rate of 30 lpm . The scan rate range for grades 5 and
                  higher is 20-80 lpm with an initial scanning rate of 40 lpm .

St. Elizabeth Seton Elementary School                                                      Page 10 of 27
Version 2.0                                                              Reading Plus Evaluation Report
Table 3.0
Pearson Correlation & p Value of Reading Scores & Rates
2011-12
Guided Reading CLOZE PAVE RAW
Initial Current Current I-Rate Scan Current
Level Level Total Total Level
Rate I-Rate G-Rate Gained Rate
Gain Gain Lessons Flash Lessons Gain
(wpm) (wpm) (wpm) (wpm) (lpm)
GR Level Gain r= 0.089 0.477 0.509 0.588 0.650 0.535 0.415 0.573 0.563 0.455
p< 0.531 0.001 0.001 0.001 0.001 0.001 0.003 0.001 0.001 0.007
GR Initial Rate 0.089 0.711 0.731 0.301 -0.127 -0.241 0.076 0.141 0.270 0.180
0.531 0.001 0.001 0.030 0.370 0.085 0.600 0.330 0.123 0.309
Current I-Rate 0.477 0.711 0.944 0.885 0.163 -0.084 0.172 0.386 0.533 0.494
0.001 0.001 0.001 0.003 0.249 0.552 0.233 0.006 0.001 0.003
Current G-Rate 0.509 0.731 0.944 0.792 0.128 -0.078 0.163 0.413 0.569 0.501
0.001 0.001 0.001 0.001 0.378 0.592 0.263 0.003 0.001 0.003
CLOZE 0.650 -0.127 0.163 0.128 0.305 0.815 0.307 0.536 0.455 0.305
Level Gain 0.001 0.370 0.249 0.378 0.028 0.001 0.030 0.001 0.007 0.079
CLOZE 0.535 -0.241 -0.084 -0.078 0.046 0.815 0.202 0.335 0.149 -0.033
Total Lessons 0.001 0.085 0.552 0.592 0.748 0.001 0.159 0.018 0.401 0.852
PAVE 0415 0.076 0.172 0.163 0.180 0.307 0.202 0.306 0.364 0.428
Scan Rate 0.003 0.600 0.233 0.263 0.210 0.030 0.159 0.085 0.034 0.012
PAVE 0.573 0.141 0.386 0.413 0.425 0.536 0.335 0.306 0.428 0.255
Current Flash 0.001 0.330 0.006 0.003 0.002 0.001 0.018 0.085 0.012 0.146
RAW Lessons 0.563 0.270 0.533 0.569 0.574 0.455 0.149 0.364 0.428 0.848
0.001 0.123 0.001 0.001 0.001 0.007 0.401 0.034 0.012 0.001
RAW Gain 0.455 0.180 0.494 0.501 0.578 0.305 -0.033 0.331 0.255 0.848
0.007 0.309 0.003 0.003 0.001 0.079 0.852 0.056 0.146 0.001
St. Elizabeth Seton Elementary School Page 11 of 27
Version 2.0 Reading Plus Evaluation ReportTable 4.0
Reading Plus
Mean Reading Score & Rate Analysis By Teacher
2011-12
Guided Reading CLOZE PAVE RAW
Initial Current I-Rate
Teacher n Current Scan Rate 1 Current
Level Rate Gained Total Total Level
I-Rate G-Rate Level Gain
Gain Lessons (lpm) Flash Lessons Gain
(wpm ) (wpm ) (wpm )
(wpm )
B 8 1.6 119.8 151.3 186.9 31.5 1.9 88.5 98.8 4.4 9.5 0.17
C 5 0.4 129.4 150.6 180.6 21.2 0.6 33.6 77.5 3.8 1.5 0.0
E 2 2.5 153.0 188.0 215.5 35.0 1.0 47.0 97.5 4.5 10.0 0.0
J 2 0.0 162.5 162.0 171.0 (0.5) 0.0 6.0 82.5 3.0
K 3 0.0 119.0 151.0 168.0 32.0 0.0 4.0
O 3 1.3 138.0 173.0 194.7 35.0 1.0 62.3 100.0 3.3 1.5 0.0
S 5 2.2 121.2 158.6 184.8 37.4 2.4 96.2 98.0 4.6 13.5 0.0
T 25 1.9 150.6 228.4 230.0 77.8 1.7 60.9 108.6 4.6 14.3 0.13
All 15 1.5 139.6 192.0 208.5 52.4 1.5 60.1 100.4 4.3 11.8 0.3
B = Brockm an J = Janes S = Schweppe E = Eldridge O = Oleson
C = Christopherson K = Kellar T = Trinter
St. Elizabeth Seton Elementary School Page 12 of 27
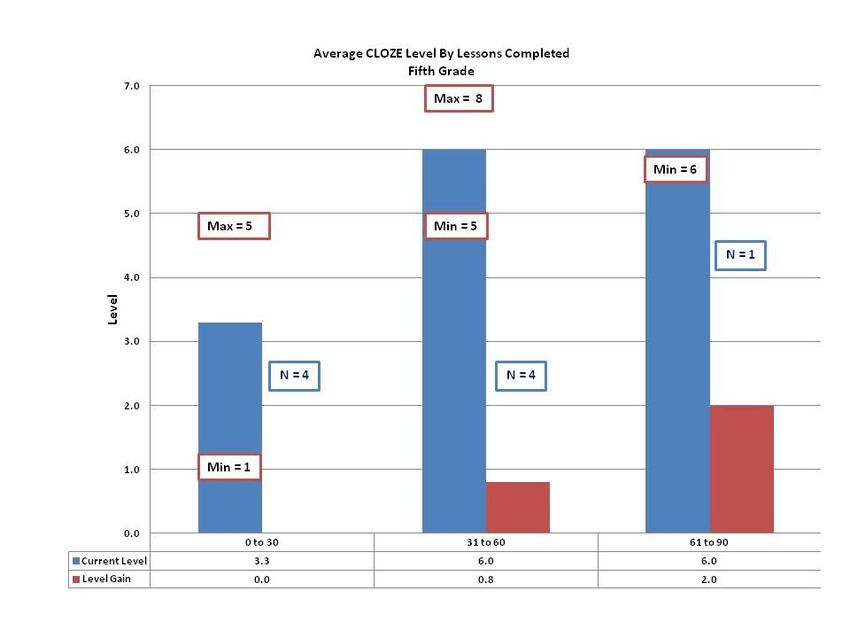
Version 2.0 Reading Plus Evaluation ReportThere was a correlation between CLOZE levels gained and total lessons completed [r = 0.815, p < 0.001]. For the third grade, students who completed 31 to 60 lessons showed an average of 1.5 gain in the levels of meaning and syntax completion. As more lessons were completed (> 91 lessons), the average level gain was 2.5. Similar gains were noted for the fourth and fifth grades. Students completing 31 to 60 lessons showed a 1.0 to 1.7 level gain, while students completing 91 or more lessons showed a 2.0 level gain. St. Elizabeth Seton Elementary School Page 13 of 27 Version 2.0 Reading Plus Evaluation Report
For all the students involved in this study (n = 52), there was no significant correlation
between PAVE scan rates (lpm) and flash counts in this study [r = 0.306, p < 0.085]. Additionally,
there was no significant correlation between scan rates and independent reading rates [r = 0.172,
p < 0.233] and guided reading rates [r = 0.163, p < 0.263]. There was a significant correlation
between flash counts and independent reading rates [r =0.386, p < 0.006] and guided reading
rates [r = 0.413, p < 0.003]. The mean scan rate for all the students was 100.4 lpm with the
fourth graders having the largest mean scan rate at 108.6 lpm and the fifth graders have the
smallest mean rate at 82.5 lom. Similar results were noted for the flash count with an overall
mean of 4.3 and fourth graders having the largest count at 4.6.

       There was a significant correlation between the number of RAW lessons completed and
levels gain for all the students [r = 0.848, p < 0.001]. The fourth graders completed the largest
average number of lessons (14.3) and had the largest average gain at 0.4. The fifth graders
completed the smallest number of lessons (4.3) and had an average zero gain.

Fourth Grade
       When the fourth grade 2011 Dakota Step score in reading was compared to the initial
guided reading rate (wpm). The Pearson correlation of 0.519 (p < 0.027) was computed to be
significant. The 2012 Dakota Step score in reading was compared to the current guided reading
I-rate and had a significant correlation of 0.526 (p < 0.010).

St. Elizabeth Seton Elementary School                                               Page 14 of 27
Version 2.0                                                       Reading Plus Evaluation Report
The 2012 Dakota Step score in reading was compared to the current guided reading G- rate and had a significant correlation of 0.452 (p < 0.031). The difference between the intial reading rate and G reading rate showed a correlation of 0.256 (p < 0.238). St. Elizabeth Seton Elementary School Page 15 of 27 Version 2.0 Reading Plus Evaluation Report
Fifth Grade
       When the fifth grade 2011 Dakota Step score in reading was compared to the initial
guided reading rate (wpm). The Pearson correlation of -0.631 (p < 0.129) was computed not to
be significant. The 2012 Dakota Step score in reading was compared to the current guided
reading I-rate and had a significant correlation of 0.725 (p < 0.042).

St. Elizabeth Seton Elementary School                                            Page 16 of 27
Version 2.0                                                    Reading Plus Evaluation Report
The 2012 Dakota Step score in reading was compared to the current guided reading G-
rate and had a significant correlation of 0.0.829 (p < 0.011). The difference between the initial
reading rate and I reading rate showed a correlation of 0.180 (p < 0.670).
A positive change in Dakota Step reading scores was noted for both the 4th and 5th
graders. The difference in reading rates from the initial reading rate (pre) to the current reading
rate (post) was greater with the fourth grade and showed a positive significant correlation. The
difference for the fifth grade was positive but the correlation between the two variables was not
statistically significant.
St. Elizabeth Seton Elementary School Page 17 of 27
Version 2.0 Reading Plus Evaluation ReportConclusion
The results of this study show that the Reading Plus program was successful in the
improvement of individual student and group reading skills. The evidence shows that when
students had completed more than 25 guided reading lessons and more than 30 CLOZE lessons,
that there were substantial gains in reading levels and ability. These gains are supported from a
variety of published and reported research (Taylor Associates, 2009). It was noted that the
computer-based program employed dynamic, scaffolded methods which provided reading
experiences matched to individual student needs. Both formative and summative assessments
were used to assign students to an appropriate reading level with a prescribed intervention
(Hiebert, 2009). The computerized reading placement appraisal helped to determine the
student’s tentative independent reading level rate, comprehension skills level, and vocabulary
level.
This study documents the necessity for teaching the total process of reading. The
interpretive skills were part of the development of fundamental reading skills. Correlations were
found between the guiding reading, CLOZE, PAVE, and RAW components of the program. For
example, in improving word meaning the vocabulary contextual analysis portion of CLOZE helped
students to compare, contrast, and interpret the meaning of words in different situations. Having
a good understanding of words, as determined in this study, was correlated to reading
comprehension (Sternberg, 1987).
Overall, the program focused on student achievement of reading skills and
comprehension by mastery of competencies in literal understanding, appreciation, interpretation,
analysis, and critical evaluation.
St. Elizabeth Seton Elementary School Page 18 of 27
Version 2.0 Reading Plus Evaluation ReportAppendix A
Graphic Summation of Data
St. Elizabeth Seton Elementary School Page 19 of 27
Version 2.0 Reading Plus Evaluation ReportSt. Elizabeth Seton Elementary School Page 20 of 27 Version 2.0 Reading Plus Evaluation Report
St. Elizabeth Seton Elementary School                     Page 21 of 27
Version 2.0                             Reading Plus Evaluation Report
St. Elizabeth Seton Elementary School                     Page 22 of 27
Version 2.0                             Reading Plus Evaluation Report
St. Elizabeth Seton Elementary School                     Page 23 of 27
Version 2.0                             Reading Plus Evaluation Report
St. Elizabeth Seton Elementary School                     Page 24 of 27
Version 2.0                             Reading Plus Evaluation Report
References
       Allington, R. L. (2006). Fluency: Still waiting after all these years. In S. J. Samuels & A. E.
Farstrup (Eds.), What research has to say about fluency instruction (pp. 94-105). Newark, DE:
International Reading Association.
      Bottomly, F. (1961). An experiment with the Controlled Reader. Journal of Educational
Research, 54 (7), 265-269.
       Chinn, C. A., Waggoner, M. A., Anderson, R. C., Schommer, M., & Wilkinson, I. A.
(1993). Situated action in the small-group reading lesson: A microanalysis of oral reading error
episodes. American Educational Research Journal, 30, 361-392.
       Chomsky, C. (1976). After decoding: What? Language Arts, 53, 288-296.
       Dynarski, M., Agodini, R., Heaviside, S., Novak, T., Carey, N., Campuzano, L., et al.
(2007). Effectiveness of reading and mathematics software products: Findings from the first
student cohort. Washington, D.C.: Department of Education, Institute of Education Sciences.
       Eder, D., & Felmlee, D. (1984). The development of attention norms in ability groups. In
P. L. Peterson, L. C. Wilkinson, & M. Hallinan (Eds.), The social context of instruction: Group
organization and group processes. New York: Academic Press.
       Frye, E. (1977). Elementary reading instruction. New York : McGraw Hill.
      Gelzer, A., & Santore, N. J. (1968). A comparison of various reading improvement
approaches. Journal of Educational Research, 61(6), 267-272.
      Goodman, K. (1964). A linguistic study of cues and miscues in reading. Chicago, IL:
American Educational Research Association
      Graham, S., & Harris, K. R. (1999). Addressing problems in attention, memory, and
executive functioning. In G. R. Lyon & N. A. Krasnegor (Eds.), Attention, memory, and executive
function (2nd printing, pp. 349-365). Baltimore: Paul H. Brookes.
       Gresham, F. M. (1989). Assessment of treatment integrity in school consultation and
prereferral intervention. School Psychology Review, 18, 37-50.
      Heckelman, R. G. (1969). A neurological impress method of reading instruction.
Academic Therapy, 4, 277-282.
       Hetrick, W. M., & Wilson, F. R. (1968). The use of the EDL Controlled Reader at Lincoln
School. E.S.E.A. Evaluation Report of the Monroe (Michigan) Public Schools.
       Hiebert, E. H. (2006). Becoming fluent: Repeated reading with scaffolded texts. In S. J.
Samuels & A. E. Farstrup (Eds.), What research has to say about fluency instruction (pp. 204-
226). Newark, DE: International Reading Association.
      Hiebert, E. H. (1983). An examination of ability grouping for reading instruction. Reading
Research Quarterly, 18(3), 231-255.
      Hoffman, J. V. (1984). Guided oral reading and miscue focused verbal feedback in
second-grade classrooms. Reading Research Quarterly, 19(3), 367-384.
        Hudson, R. F., Lane, H. B., Pullen, P.C. (2005). Reading fluency assessment and
instruction: What, why how? The Reading Teacher, 58, 702-714.

St. Elizabeth Seton Elementary School                                                 Page 25 of 27
Version 2.0                                                         Reading Plus Evaluation Report
Levin, H. M., Catlin, D., & Elson, A. (2005). Costs of implementing adolescent literacy
programs. (Report dated August 31, 2005.) Prepared for Carnegie Corporation of New York.
Miller, G.A. (1956). The magic number seven, plus or minus two: Some limits on our
capacity for processing information. Psychological Review, 63, 81-97.
O’Connor, R. E., Bell, K. M., Harty, K. R., Larkin, L. K., Sackor, S. M., & Zigmond, N.
(2002). Teaching reading to poor readers in the intermediate grades: A comparison of text
difficulty. Journal of Educational Psychology, 94(3), 474-485.
Rasinski, T., Padak, N. (2004). Beyond consensus—beyond balance: Toward a
comprehensive literacy curriculum. Reading & Writing Quarterly, 20, 91-102.
Rasinski, T., Samuels, S.J., Hiebert, E. & Petscher, Y. (2011). The relationship between
a silent reading fluency instructional protocol on students’ reading comprehension and
achievement in an urban school setting. Reading Psychology, 32 (1), 75-97.
Schlange, D.G., Patel, H, & Caden, B. (1999). Evaluation of the Reading Plus® 2000 and
Visagraph System as a remedial program for academically at risk sixth and eighth grade
students: A pilot study. Optometry and Vision Science, Vol. 76 (11).
Spache, G. (1982). Diagnostic reading scales. New York: CTB McGraw-Hill.
Taylor Associates (2009). Reading Plus: Research, rationale & results. Huntington
Station, NY: Author.
Sternberg, R. (1987). Most vocabulary is learned from context. In M.G. McKeown & M.S.
Curtis (Eds.), The nature of vocabulary acquisition (pp 89-105). Hiilsdale, NJ: Erlbaum.
Taylor, E. A. (1966). The fundamental reading skill as related to eye-movement
photography and visual anomalies (2nd ed.). Springfield, IL: Charles C. Thomas.
Taylor, E. A. (1937). Controlled reading: A correlation of diagnostic, teaching and
corrective techniques. Chicago: University of Chicago Press.
Taylor, S. E. (1981). National study of fluency in the primary grades, phase II--Final report
school years 1978-81. Monograph No. 11 (p. 29). Huntington, New York:
Instructional/Communication Technology, Inc.
Taylor, S. E., Frackenpohl, H., & Pettee, J. L. (1960). Grade level norms for the
components of the fundamental reading skills. EDL Research and Information Bulletin No. 3 (p.
22). New York: EDL/McGraw Hill.
Torgesen, J. K. (2005). Preventing reading disabilities in young children: Requirements at
the classroom and school level. Presented at the Western North Carolina LD/ADD Symposium,
Asheville.
Waldstreicher, J. S. (1962). Educational rehabilitation and visual education--An integrated
approach. Optical Journal and Review of Optometry, 1-11.
Warren, M. B. (1962). The Massapequa Junior High School reading program. Journal of
Developmental Reading, 5, 245-255.
Witham, A. P. (1966). An investigation of a controlled reading technique with eighth-grade
students. Doctoral Dissertation, Wayne State University, Detroit, MI.
Witzeman, B. E. (1941). An experimental study using the Ophthalm-O-Graph and Metron-
St. Elizabeth Seton Elementary School Page 26 of 27
Version 2.0 Reading Plus Evaluation ReportO-Scope in the diagnosis and treatment of reading defects. Journal of Psychology, 11, 307-334. St. Elizabeth Seton Elementary School Page 27 of 27 Version 2.0 Reading Plus Evaluation Report
You can also read