Real-time analysis of COVID-19 - epidemiology, statistics and modelling in action
←
→
Page content transcription
If your browser does not render page correctly, please read the page content below

Real-time analysis of COVID-19 –
epidemiology, statistics and modelling
 in action

 Christl Donnelly
 Department of Statistics
 University of Oxford

 WHO Collaborating Centre for Infectious Disease Modelling
 MRC Centre for Global Infectious Disease Analysis
 Abdul Latif Jameel Institute for Disease and Emergency Analytics
 Department of Infectious Disease Epidemiology
 Imperial College London
2001 Pandemic
 2009 Influenza
 1996 FMD
 in the UK 2003
BSE/vCJD MERS
in the UK in Saudi
 SARS
 in Hong Kong 2013/4 Arabia
 Ebola
 in DRC
 2018…

 2016
 2020… 2014/6

 Zika Ebola
 in West
COVID-19 Africa
What do you most want to know?

• What are the symptoms? Characterise cases
• How many cases are there? Estimate cases in source from exportations
• How many cases might there Estimate epidemic growth
 be?
• How serious is the disease? Estimate the CFR
• If someone is exposed to Estimate the incubation period distribution
 infection, how long till they know djkfrdjksfljdfj jjjjjjjjjjjjjjjjjj jjjjjjjjjjjjjjjjjjjjjjjjjjjjjjjj
 if they are free of infection?
• How might we control the Consider options, including isolation, quarantine,
 disease? vaccination, as data allow.

 Relevant paper: Cori A., Donnelly CA, Dorigatti I, et al. Key data for outbreak evaluation: building on the Ebola experience.
 Phil. Trans. R. Soc. B372, 20160371, 2017. http://dx.doi.org/10.1098/rstb.2016.0371
Real-time analyses
As of 30 June 2020:

 Temporal distributions of
 (b) the number of Coronavirus studies,
 (c) the SARS, MERS and Covid-19 studies.

 from Haghani & Bliemer
 https://www.biorxiv.org/content/10.1101/2020.05.31.126813v1.full
https://cmmid.github.io/topics/covid19/

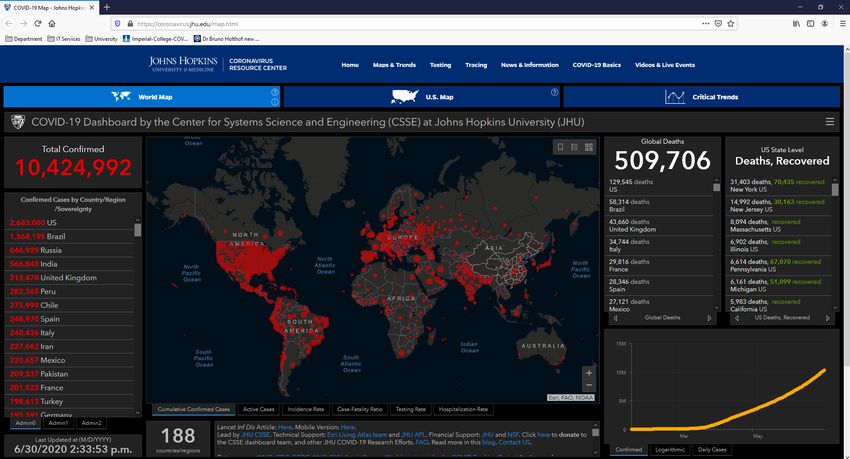
9

https://coronavirus.jhu.edu/map.html

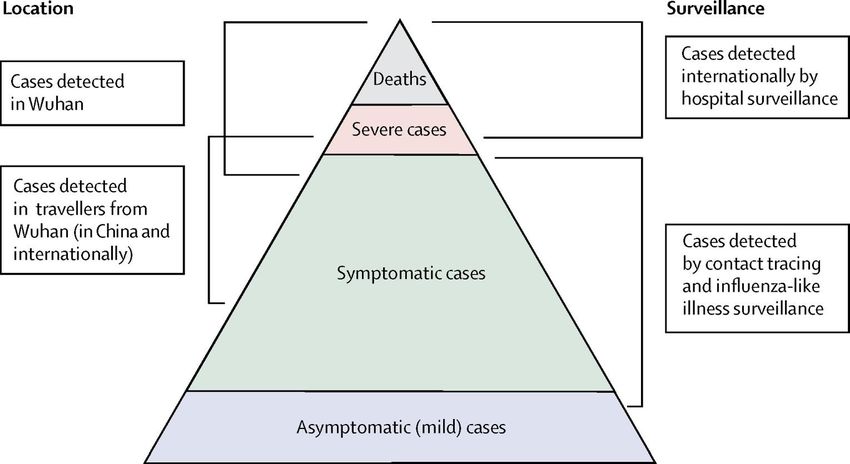
Magnitude of the epidemic

 ℎ
 =
 ℎ

where the probability any one case will be detected overseas ( ) is given

 = ×

The daily probability of travel is calculated by:

 ℎ
 =
 ℎ ℎ

Finally, the mean time to detection can be approximated by:

 = +

17 January 2020
 Report 1
 Baseline Smaller Shorter Baseline Smaller Shorter
 catchment detection catchment detection
 window window

 Exported number of 3 3 3 7 7 7
 confirmed cases

 Daily international 3,301 3,301 3,301 3,301 3,301 3,301
 passengers travelling
 out of Wuhan
 International Airport

 Effective catchment
 19 11 19 19 11 19
 population of Wuhan
 International Airport million million million million million million

 Detection window 10 days 10 days 8 days 10 days 10 days 8 days
 (days)
 Estimated total 1,723 996 2,155 4,000 2,300 5,000
 number of cases (427 – (246 – (535 – (1,700 – (1,000 – (2,200 –
 (95% CI) 4,471) 2,586) 5,590) 7,800) 4,500) 9,700)

https://www.imperial.ac.uk/mrc-global-infectious-disease-analysis/covid-19/covid-19-reports/
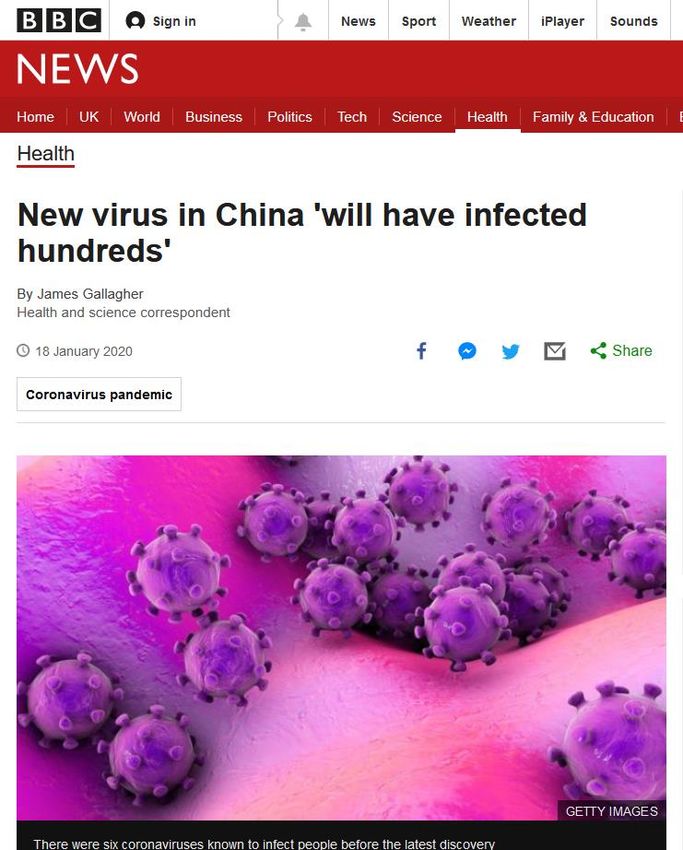
The number of people already
 infected by the mystery virus
 emerging in China is far greater than
 official figures suggest, scientists
 have told the BBC.

 There have been more than 60
 confirmed cases of the new
 coronavirus, but UK experts estimate
 a figure nearer 1,700.

 Two people are known to have died
 from the respiratory illness, which
 appeared in Wuhan city in December.

 "I am substantially more concerned
 than I was a week ago," disease
 outbreak scientist Prof Neil Ferguson,
 said.

 The work was conducted by the MRC
 Centre for Global Infectious Disease
 Analysis at Imperial College London,
 which advises bodies including the
 UK government and the World Health
 Organization (WHO).
https://www.bbc.co.uk/news/health-51148303
17 January 2020 22 January 2020
 Report 1 Report 2
 Baseline Smaller Shorter Baseline Smaller Shorter
 catchment detection catchment detection
 window window

 Exported number of 3 3 3 7 7 7
 confirmed cases

 Daily international 3,301 3,301 3,301 3,301 3,301 3,301
 passengers travelling
 out of Wuhan
 International Airport

 Effective catchment
 19 11 19 19 11 19
 population of Wuhan
 International Airport million million million million million million

 Detection window 10 days 10 days 8 days 10 days 10 days 8 days
 (days)
 Estimated total 1,723 996 2,155 4,000 2,300 5,000
 number of cases (427 – (246 – (535 – (1,700 – (1,000 – (2,200 –
 (95% CI) 4,471) 2,586) 5,590) 7,800) 4,500) 9,700)

https://www.imperial.ac.uk/mrc-global-infectious-disease-analysis/covid-19/covid-19-reports/
How have case numbers grown?

 Assuming an 8.4 day average generation time

Natsuko Imai, Anne Cori, Ilaria Dorigatti, Marc Baguelin, Christl A. Donnelly, Steven Riley, Neil M. Ferguson
WHO Collaborating Centre for Infectious Disease Modelling, MRC Centre for Global Infectious Disease Analysis, J-IDEA, Imperial
College London
Report 3, 25 January 2020 https://www.imperial.ac.uk/mrc-global-infectious-disease-analysis/covid-19/covid-19-reports/
Case fatality ratio

• Proportion of cases who eventually die from the disease;
• Often estimated by using aggregated numbers of cases and deaths at
a single time point:
 • E.g.: case fatality ratios compiled daily by WHO during the SARS
 outbreak:
 estimate of the case fatality ratio:
 number of deaths / total number of cases.
 • Simple estimates of these reports can be misleading if, at the time of
 the analysis, the outcome (death or recovery) is unknown for an
 important proportion of patients.
Proportion of observations
 censored in the SARS outbreak

We do not know the outcome (death or recovery) yet. [Ghani et al. AJE, 2005]
Simple methods

• Method 1:
 D D = Number of deaths
 CFR = C = Total number of cases
 C

• Method 2:

 D D = Number of deaths
 CFR =
 ( D + R)
 R = Number recovered
Adapted Kaplan-Meier method To extrapolate 1 incomplete survivor 0.9 functions, assume that 0.8 death/discharge rate at 0.7 the tail occurs at the 0.6 same rate as previously: 0.5 0.4 0.3 Proba death 0.2 at the tail 0.1 ˆ 0 0 = 0 0 20 40 60 (ˆ + ˆ ) Non-parametric probability days from admission of survival Non-parametric probability of discharge 0 1 K-M like estimate Proba discharge at the tail
Comparison of the estimates

 (deaths/cases)

deaths/(deaths+recoveries)
 [Ghani et al. AJE, 2005]
Misinterpretation of the trend
Comparison of the estimates

 (deaths/cases)

deaths/(deaths+recoveries)
 [Ghani et al. AJE, 2005]
Probabilities of death (red
curve) and recovery
(green curve).

The black line indicates
the case fatality ratio
(CFR).

The point estimate of the
CFR is 35% (95% CI: 34-
36%).
Figure 1

 CFR vs IFR

Verity et al. The Lancet Infectious Diseases 2020 20669-677DOI: (10.1016/S1473-3099(20)30243-7)
Copyright © 2020 The Author(s). Published by Elsevier Ltd. This is an Open Access article under the CC
BY 4.0 license Terms and Conditions
IFR estimates
Authors Estimate When Where
 available

 https://www.imperial.ac.uk/media/i
Verity et al. 1% (0.5-4) Posted 10 Feb mperial-college/medicine/mrc-
Imperial College gida/2020-02-10-COVID19-Report-
 4.pdf
London
 https://www.medrxiv.org/content/10
 0.66% (0.39-1.33) Posted 13 Mar .1101/2020.03.09.20033357v1

 https://www.thelancet.com/pdfs/jou
 Pub. 30 Mar rnals/laninf/PIIS1473-
 3099(20)30243-7.pdf
 https://www.medrxiv.org/content/10
Chow et al. 0.17% (0.05-0.9) first week Posted 5 May .1101/2020.04.29.20083485v1
National Institutes of 0.8% (0.2-4) as of 15 April
Health
 https://www.medrxiv.org/content/10
Grewelle & De Leo 1.04% (0.77-1.38) Posted 18 May .1101/2020.05.11.20098780v1
Stanford

Rosenfeld et al. 0.9% “Results as of https://covid.idmod.org/data/Modeli
 ng_countermeasures_for_balance
Institute for Disease May 25” d_reopening_King_County_Washi
 ngton.pdf
Modelling
 https://www.thelancet.com/journals
Wood et al. 0·43% (0·23–0·65) China Pub. 28 May /laninf/article/PIIS1473-
University of Bath 0·55% (0·30–0·82) UK 3099(20)30437-0/fulltext

 0·20% (0·11–0·30) India
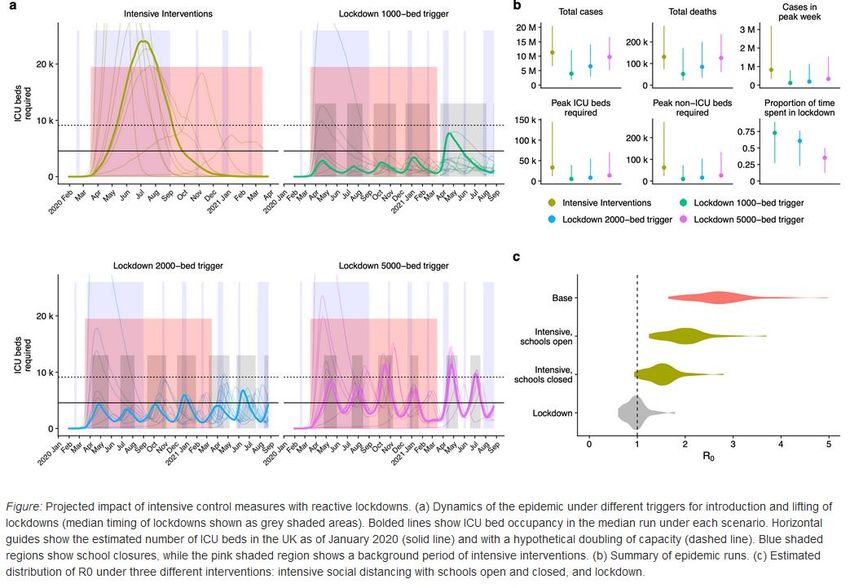
Individual-based simulations of
 transmission was used to
 explore scenarios of
 unmitigated epidemics,
 mitigated epidemics and
 suppressed epidemics in the
 UK and elsewhere.

https://www.imperial.ac.uk/media/imperial-college/medicine/mrc-gida/2020-03-16-COVID19-Report-9.pdf Published 16 Mar 2020
https://cmmid.github.io/topics/covid19/uk-scenario-modelling.html Published 1 Apr 2020
https://www.imperial.ac.uk/media/imperial-college/medicine/mrc-gida/2020-03-24-COVID19-Report-11.pdf published 24 Mar 2020
https://www.imperial.ac.uk/media/imperial-college/medicine/mrc-gida/2020-05-29-COVID19-Report-24.pdf Published 29 May
We would like to thank O2 and Facebook Data for Good for making their data available to us.
https://www.imperial.ac.uk/media/imperial-college/medicine/mrc-gida/2020-05-28-COVID19-Report-23-version2.pdf Published 28 May 2020
Google’s COVID-19 Community Mobility Report
https://www.imperial.ac.uk/media/imperial-college/medicine/mrc-gida/2020-06-08-COVID19-Report-26.pdf Published 8 June 2020
Report 26: Reduction in mobility and COVID-19 transmission
Looking forward… more data

https://coronavirus.jhu.edu/map.html
Looking forward… more code

https://github.com/mrc-ide/COVID19_CFR_submission
Looking forward… more open reviews
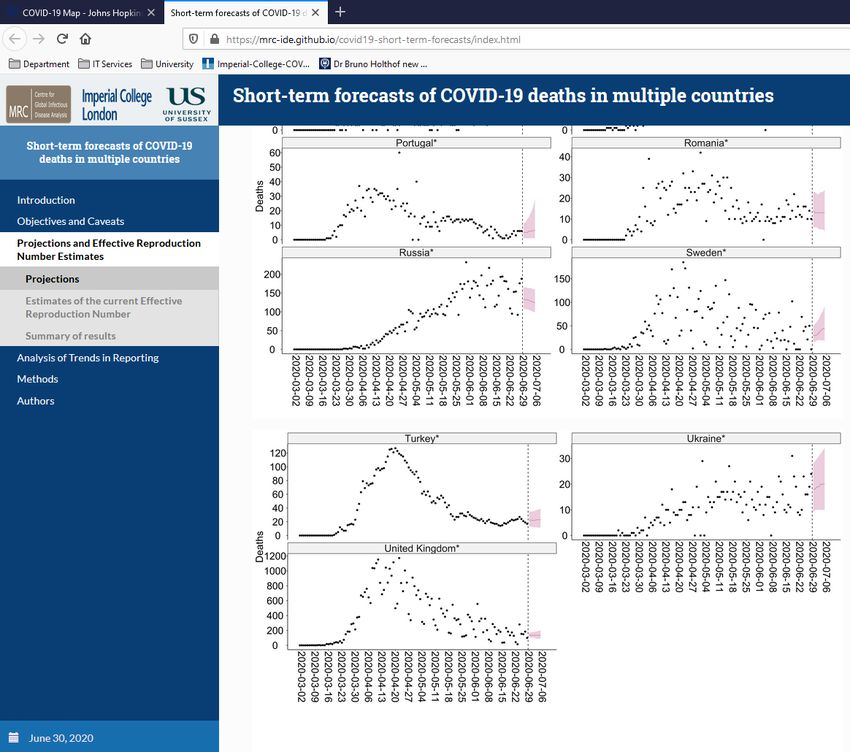
Looking forward… more updates

https://mrc-ide.github.io/covid19-short-term-forecasts/index.html
Looking forward… more public engagement

https://www.imperial.ac.uk/media/imperial-college/medicine/mrc-gida/2020-04-28-SJK-Report-9.pdf
“When I am no longer even a memory, just a
name, I hope my voice may perpetuate the great
 The Royal Statistical Society
work of Street,
 12 Errol myLondon
 life.EC1Y
 God 8LX bless my dear old comrades

 of +44
 T
 E
 Balaclava
 (0)20 7638 8998
 rss@rss.org.uk
 and bring them safe to shore.”
 @Royal StatiSoc

 Florence Nightingale (1820-1910)
 rss.org.uk
A man for our time

Sir Austin Bradford Hill
(1897 – 1991)

“All scientific work is incomplete—whether it
be observational or experimental.

All scientific work is liable to be upset or
modified by advancing knowledge.

That does not confer upon us a freedom to
ignore the knowledge we already have, or to
postpone the action that it appears to demand
at a given time.”
You can also read