Recycling for Impact Lessons from China's National Sword - CURC Pre-Conference Work Shop
←
→
Page content transcription
If your browser does not render page correctly, please read the page content below
Recycling for Impact
Lessons from China’s National Sword

             Oct. 2nd, 2018
      CURC Pre-Conference Work Shop

               Alex Danovitch
           Vice President of Sustainability
               Nothing Left To Waste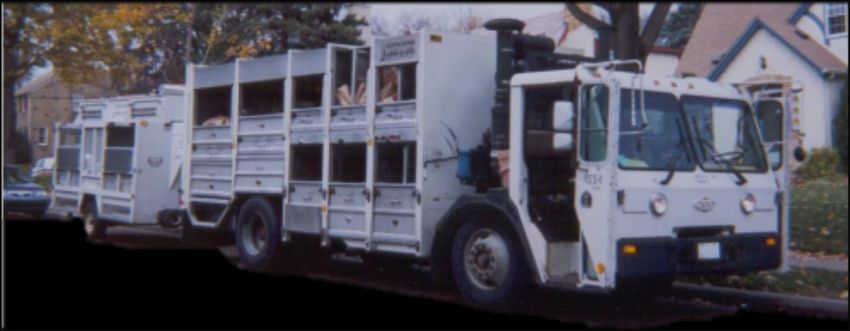
Overview

♳ How did we get here?

♴ What’s been the impact?

♵ Is recycling dead? (spoiler
 alert, no)

♶ How do we make recycling
 sustainable going forward?
How Did We Get Here?
Dynamics in the U.S. Leading to A Near Death Experience in
                     Recycling
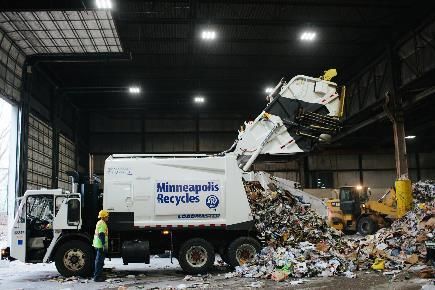
Collection Context
• Consolidation of community based haulers to multi-nationals.
• Move to single stream collection with carts.
• Customer focus on diversion goals, with measurement at “curb”.
• Lack of EPR efforts.
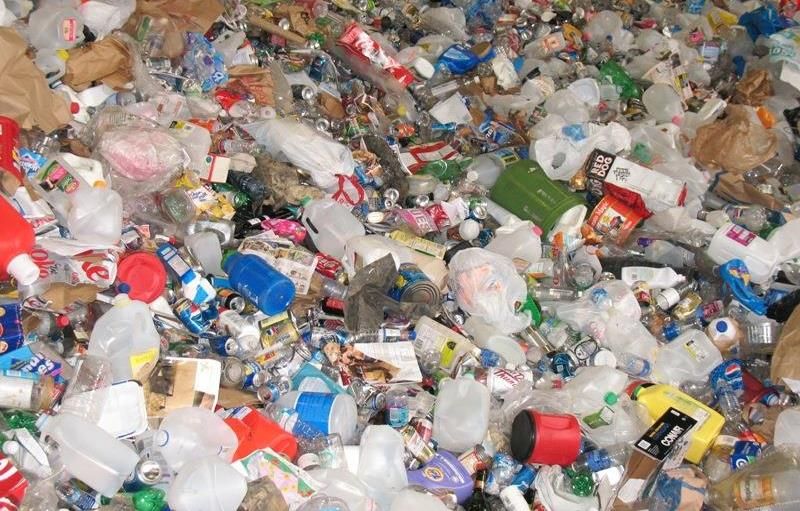
Processing Context
• Technology
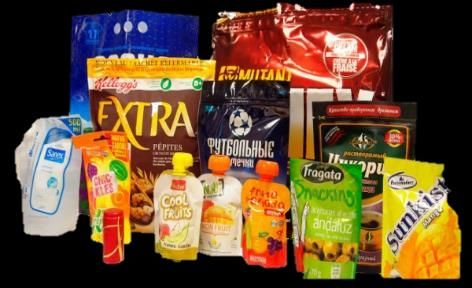
• Producer Packaging Trends
• Labor Standards
• Consolidated Supply
http://apfoodonline.com/industry/going-holographic-with-flexible-packaging/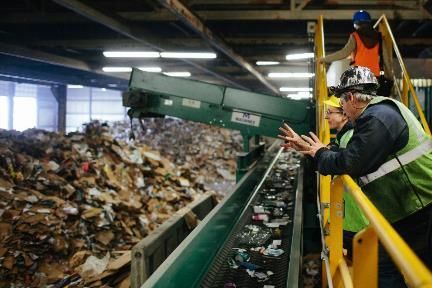
Result

• Emphasis on efficiency and convenience over
  quality, education and end-markets.
• Disconnection between generators, haulers,
  processors, manufacturers and end-markets.
• Inclusion of materials that aren’t recyclable and
  handling of materials in a way that destroyed
  their value.
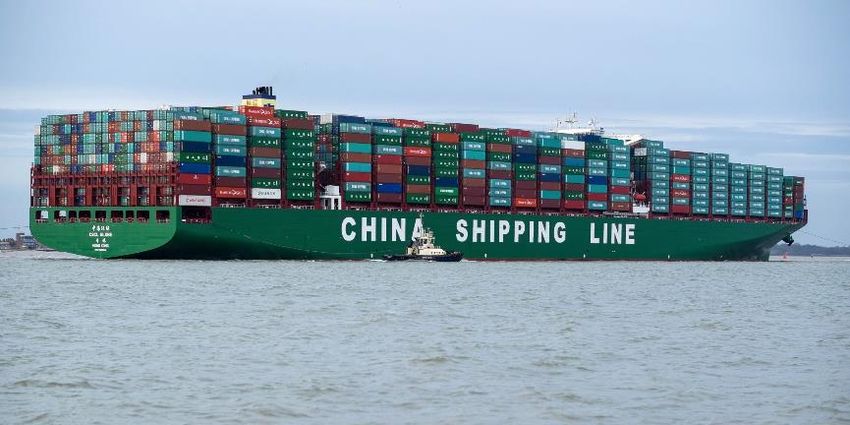
Meanwhile, in China…
• Opportunity for China:
  • 1980s: Ships sailing back empty.
  • 2000: Import 17% of all recyclables collected in U.S.
  • 2016: Import 40% of all recyclables collected in U.S. ($5.6
    billion)

                  By Keith Skipper, CC BY-SA 2.0, https://commons.wikimedia.org/w/index.php?curid=37741003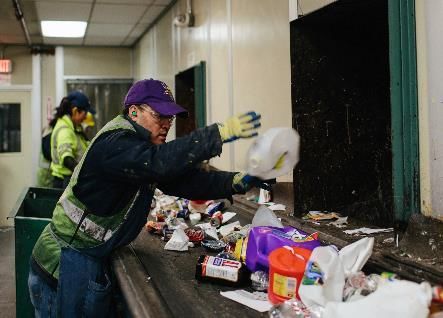
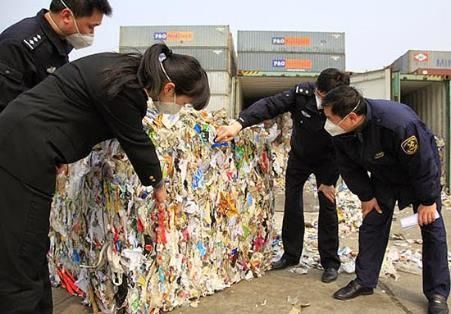
China’s Actions on Recycling
• Timeline
  • 2013: Green Fence Implemented (passed in 2006 and 2010)
    – intensive inspections of incoming material.
  • 2017: National Sword Implemented drastically reducing
    import permits and banning imports of mixed paper, mixed
    plastic and 24 other grades of recyclables.
  • 2018: “Blue Sky program” implemented to inspect all
    materials at point of origin before buying materials for
    export – at processors cost. Set max contamination rates for
    all recyclables at .5%.
  • 2018: Ongoing retaliation to Trump Tariffs (aluminum and
    steel)
  • 2019: Expected announcements on if China will
    permanently ban all “unprocessed” recycling imports.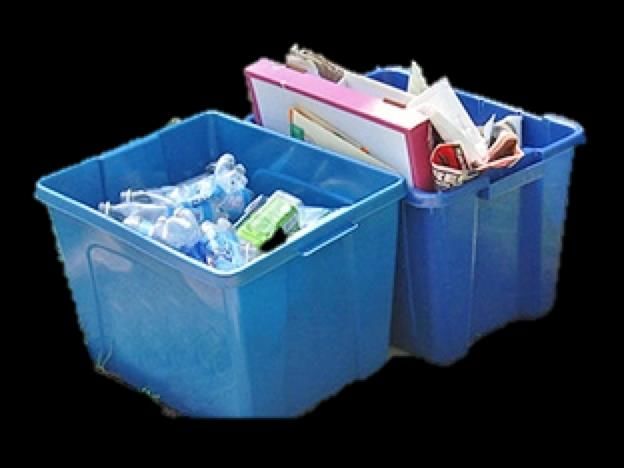
National Sword’s
Impact on Recycling

  https://recyclinginternational.com/plastics/isri-18-of-us-china-scrap-trade-at-risk/
Loss of Markets and Increased
      Domestic Supply

             Waste 360: China’s Changing Import Regulations-0 What does it all mean

• Exports of mixed paper fell by 95% in 2017.
• Only 50% of exports have found another home (at least
  temporarily).
Price and Movement
Residential Basket Index Value
(March 2017-Aug 2018)
120
100
80
60
40
20
0
• Regional Impacts Vary Greatly
• Movement – Domestic markets dependent on quality and
relationships.
• Price – Basket value down 35%Industry Responses • Work to improve quality. • Develop new end markets. • Price increases for new services. • Efforts to renegotiate existing contracts. • Fines for contamination. • Reduction or termination of services (rare).
Recycling is not dead…
               and it is in crisis.
The U.S. domestic recycling industry accounts for 757,000
stable jobs and $36.6 billion in wages and $6.7 billion in state,
local and federal taxes.

The recycling industry has been through significant market
fluctuations before.

We’re starting to see some commodity prices level off.

We need to change the way we recycle to preserve the
environmental and economic stability of future recycling.
WHAT CAN WE DO? Make sure that HOW you recycle, reflects WHY you recycle.
Why Do You Recycle?
Meet your goals….
       with the help of recycling.
• Diversion rate as tool- not a goal.
  • What/how to measure.
  • Good measurement:
    • Guides operational decisions
    • Tracks progress and identifies areas for improvement
    • Connects benefits to broader institutional goals

• Recycling’s not always the best way to meet your goal.
  • Reduction, Reuse, Rethink
  • Need to include a broad team (purchasing, sustainability, ops, etc.).
Decouple Costs- Fully Loaded
$800.00
$600.00
$400.00
$200.00
$0.00
Nothing Left To Waste Calculator ©2018Environmental Impact
Example: Comparative Chart of Carbon Reduction Impact
Through Diversion. Shown in MTC02/Ton of Discards Diverted
Compost from Incinerator
Reduction from Existing Composting
Recycling from Incinerator
Reduction from Existing Recycling
Reduction from Incinerator
- 0.50 1.00 1.50 2.00 2.50
Nothing Left To Waste Calculator ©2018Example: Summary Costs and
Env. Impact Projections
Annual Additional Total Annual
Diversion Blended Total savings Carbon Savings
Rate Cost/Ton Cost over Reduction (including
baseline Value Carbon)
Baseline 31.5% $702.13 $569,564 $0.00 $0.00 $0.00
As Modeled 39% $692.35 $561,633 $7,931 $35,257 $43,188
Model 2: Recycle and compost
82% $621.85 $504,446 $65,118 $63,277 $128,396
everything possible
Model 3: Model 2 + 50%
91% $550.38 $446,470 $123,094 $78,803 $201,897
reduction of remaining trash
Nothing Left To Waste Calculator ©2018Example: Reduce Single Use Plastic
Shows the impact of reducing one time use plastics from each stream. Data is specific to
benefit relative to previous discard method (i.e. trash or recycling).
trash recycling compost Total
plastic % 6.38% 7.77% .94%
% that is one time use 80% 80% 80%
plastic volume 25.20 30.65 5.02
Carbon Value ($8,147) (2,759) ($1,622) ($9,772)
Discard Savings ($5,836) ($1,444) ($412) ($6,250)
NET Savings From
($13,983) ($5) ($2,034) ($16,022)
Reducing Plastics
Nothing Left To Waste Calculator ©2018Education • Investment and commitment in ongoing education • Important to share beyond the “how” • Why is it important? • What happens to recycling? • Institutionalize program and campus wide buy-in
Working With Local
            Contractors
• Get to know your
operators.

• Understand the
marketplace.

• Take advantage of local opportunities in your
  operations plan.

• Develop contracts that meet help meet your
  goals.
Beware of… • “Recovery” aka Waste to Energy • Mixed Waste Processing • “Marketing” Driven Solutions • Chemical Recycling - ???
Conclusion
• Know why you’re recycling.

• Connect the dots.
  • Purchasing
  • Collection
  • Processing
  • End-Markets

• Recycle and keep pushing further to meet your goals.

• Our current recycling system may not be perfect- but
  we can keep it impactful!
Recycling for Impact
Lessons from China’s National Sword

         Alex Danovitch
        alexd@nl2w.com
          518-683-8669

          Nothing Left To Waste
You can also read