Reducing disparities in the delivery of primary health care - by reducing unnecessary emergency department visits - Johns Hopkins ACG System
←
→
Page content transcription
If your browser does not render page correctly, please read the page content below

Reducing disparities in the delivery of
primary health care – by reducing
unnecessary emergency department visits

BY LIZELLE STEENKAMP ( LIZELLES2@DISCOVERY.CO.ZA )
MATTHEW ZYLSTRA ( MATTZ@DISCOVERY.CO.ZA) &
ZACK SHAN ( ZACK.SHAN@VITALITYGROUP.COM )

DISCOVERY HEALTH, SOUTH AFRICA
Contents

 BUSINESS CASE .................................................................................................................................................... 3

 INTRODUCTION ................................................................................................................................................... 3

    WHY IS THE USE OF EMERGENCY DEPARTMENTS AS FIRST POINT OF CARE A PROBLEM?................... 3

 AIMS ...................................................................................................................................................................... 5

    EXPECTED ADMISSION RATE VIA EMERGENCY DEPARTMENT METHODOLOGY ..................................... 5

    ACO METHODOLOGY ...................................................................................................................................... 8

 ANALYSIS AND RESULTS ................................................................................................................................... 10

 APPLICATIONS ................................................................................................................................................... 13

    BENEFIT DESIGN ............................................................................................................................................ 13

    NETWORK SELECTION ................................................................................................................................... 14

 CONCLUSION ..................................................................................................................................................... 15

 DETAILS OF VARIABLES USED IN THE EXPECTED ADMISSION RATE VIA EMERGENCY DEPARTMENT
 METHODOLOGY ................................................................................................................................................ 16

                                                                                                                                                            Page 2 of 17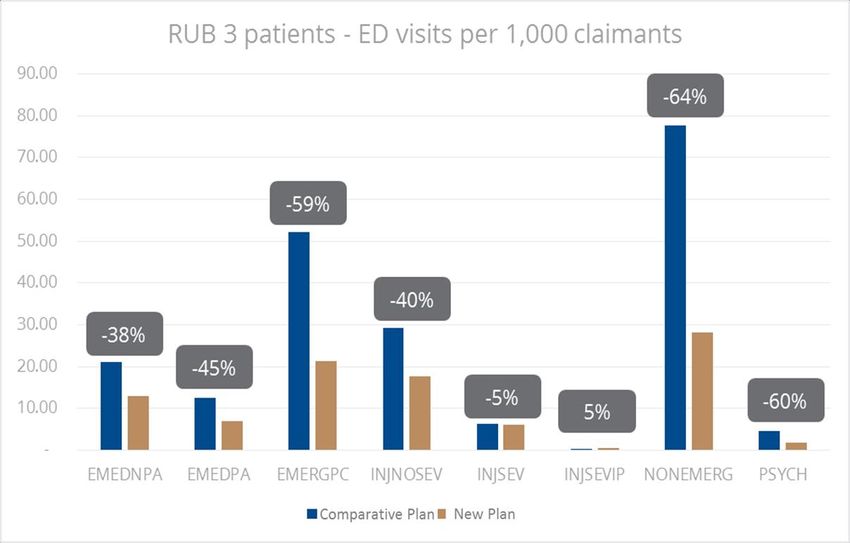
BUSINESS CASE

  “A CLOSER RELATIONSHIP WITH YOUR PRIMARY HEALTHCARE PROVIDER
         LEADS TO A REDUCTION IN EMERGENCY DEPARTMENT VISITS AND
         SUBSEQUENT ADMISSIONS FROM THE EMERGENCY DEPARTMENT
   RESULTING IN BETTER PATIENT OUTCOMES AND LOWER HEALTHCARE
                                                COSTS”.

INTRODUCTION

Discovery Health’s core purpose is to make people healthier and enhance and protect their lives. In
order to achive this purpose, Discovery Health seeks to ensure that high quality, cost-effective care is
available to all its members. Primary care sits at the centre of all strong healthcare systems and should
offer the first point of contact to all of our members.

Discovery Health has focused substantial energy over the years in understanding its primary healthcare
system and identifying opportunities for partnerships and potential network opportunities which can
help strengthen primary care. In the largely fragmented, hospital-centric, private healthcare system of
South Africa, care is rarely driven by the primary care provider which not only negatively impacts on
patient outcomes but also limits the system more broadly in its ability to offer value based care at an
acceptable cost, which maximises quality for all. The use of an emergency department as a first point of
care before consulting a primary care provider has been a specific challenge in the South African
environment for a while now and seems to be an ever increasing phenomenon.

Why is the use of emergency departments as first point of care a problem?

Emergency department visit rates and the consequent admission rate from emergency department
visits have been increasing year on year in the South African environment. In 2010, 21 out of every 100
admissions into hospital came via an emergency department and in 2018, 27 out of every 100
admissions into hospital came via an emergency department representing an increase of 32% in just 8
years.

                                                                                                Page 3 of 17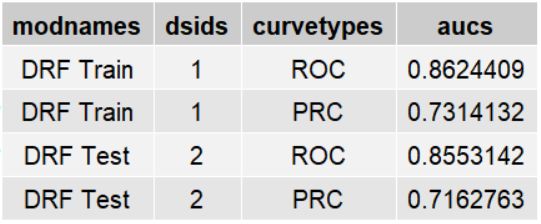
From 2010 to 2015 there has been a 26% increase in the admission rate to hospital via emergency
departments as evident from the graph below. Fitting a simple model adjusting for age, gender and the
presence of a chronic condition on 2010 data, it is clear that in 2015 there is at least a R480 million
residual i.e. more admissions than expected in our system indicating that there is a potential savings of
close to R500 million rand to be gained if better utilisation of primary health care is encouraged.

The majority of these emergency department visits with subsequent admissions occur during the week
and during normal working hours as per the graph below which creates a significant opportunity to
change behaviour and to encourage better primary health care utilisation.

                                                                                                 Page 4 of 17
AIMS
This paper aims to use new insights from the expected emergency department admission model
together with the new emergency department visit classification in the ACG system to demonstrate the
impact of improving primary care utilisation trends within the membership of the Discovery Health
Medical Scheme.
The paper aims to investigate the impact of better use of primary health care on healthcare costs in
four distinct steps namely:
1. It will describe how we created a model to calculate the expected admission rate for members
visiting an emergency department adjusting for patient multi-morbidity
2. It will then examine, using the ACO allocation strengths, if there is a difference in experience of
members with stronger relationships with their primary health care providers on emergency
department visits and subsequent admission rates into hospital from an emergency
department
3. It will then compare the outputs of this model to the ED classification outputs from the ACG
system to gain further insights as to the reasons for patients visiting the emergency
department and whether these visits are avoidable
4. The benefits of better relationships with primary health care providers and utilisation will then
be determined using two approaches
a. Benefit design
b. Network selection
Expected admission rate via emergency department methodology
The expected admission rate via an emergency department was calculated using the Johns Hopkins
ACG outputs together with additional scheme specific data as inputs into a distributed random forest
model. The data used to generate the expected model is based on all of Discovery Health Medical
scheme members that had an emergency department visit between 2015 to 2017 . The demographic
and clinical factors used (listed below) are based on the latest information in the month before the
emergency department visits. The train and test set are 70% and 10% of all emergency department visit
data from 2015 to 2017 respectively. The remaing 20% of the data was used as the validation set during
model fitting.
Various demographic and clinical factors were used in the model. The top factors are shown below by
variable importance with detailed descriptions of the variables set out in Appendix A.
Page 5 of 17Variable Relative_importance Scaled_importance
EMERGENCY_DEPARTMENT_CONDITION 8,736,610 100.0000%
ACG_ROLLING_12 2,206,529 25.2561%
RUB_ROLLING_12 1,766,514 20.2197%
EMERGENCY_DEPARTMENT_ICD_10 1,192,864 13.6536%
AGE 512,978 5.8716%
BENEFIT_PLAN 411,116 4.7057%
HYPERTENSION_FLAG 287,883 3.2951%
BENEFIT_PLAN_TYPE 272,938 3.1241%
CHRONIC_CONDITION_FLAG 223,589 2.5592%
BENEFIT_PLAN_OUT_OF_HOSPITAL_BENEFIT_LEVEL 184,716 2.1143%
DIABETES_FLAG 93,885 1.0746%
PREVIOUS_ADMISSIONS_30_DAYS 66,062 0.7562%
CONGESTIVE HEART FAILURE_FLAG 41,210 0.4717%
CHRON_OBSTRUCTIVE_PULMONARY_DISORDER_FLAG 19,468 0.2228%
CANCER_TREATMENT_FLAG 18,793 0.2151%
MEDICAL_SCHEME_DESCRIPTION 16,896 0.1934%
SEX 13,377 0.1531%
CHRONIC_RENAL_FAILURE_FLAG 12,281 0.1406%
EPILEPSY_FLAG 10,119 0.1158%
HIV_FLAG 7,150 0.0818%
BIPOLAR_DISORDER_FLAG 4,661 0.0534%
PERSISTENT_ASTHMA_FLAG 3,714 0.0425%
HYPOTHYROIDISM_FLAG 3,545 0.0406%
PARKINSONS_DISEASE_FLAG 1,446 0.0165%
The Precision-Recall Curve (PRC), Receiver-Operator Curve (ROC) and Area-Under-the-Curves (AUC)
indicating the model fit of the expected admissions via an emergency department are shown below,
the train and test are referring to the train and test data set defined above.
Page 6 of 17Page 7 of 17
ACO methodology
Claims data corresponding to the 2017 and 2018 calendar years were used for analysing the strength
of allocation to a healthcare provider and to evaluate the usage of emergency departments and
admission to hospital.
1. All members as at January 2017 were allocated to a healthcare provider using the ACO
allocation methodology.
2. All member visits to primary care providers and specialist providers out of hospital were
extracted for the period between January 2017 and December 2018.
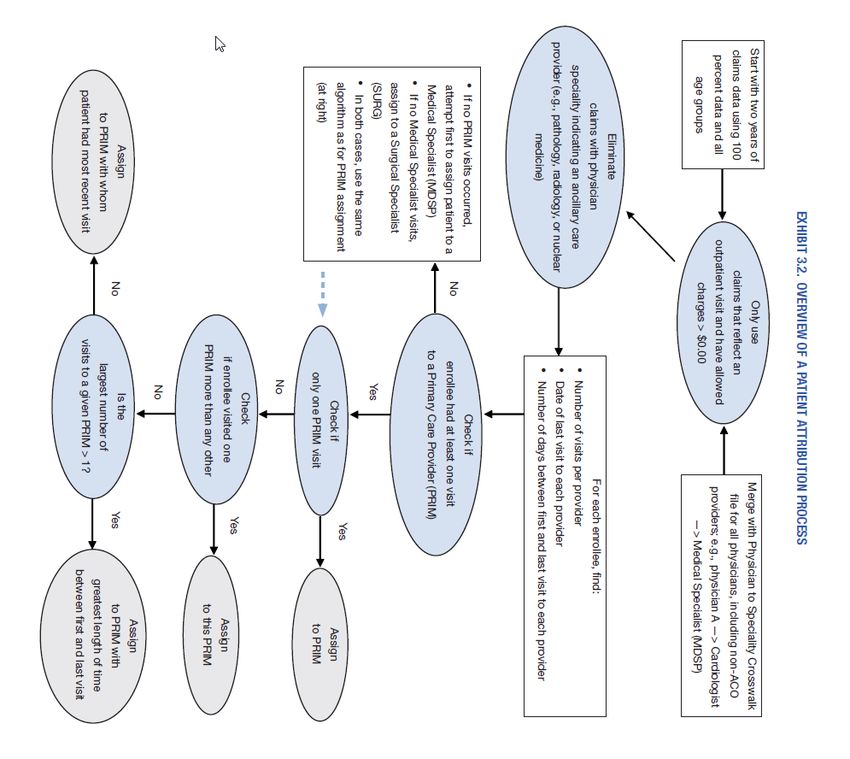
These members were allocated using the rules as described in the figure below:
Page 8 of 17In phase 1 of the allocation, members were forced to be allocated to a primary care doctor (General
Practitioner, Specialist Physician or Paediatrician), based on the majority of visits to a provider, given
that there were primary care visits to these doctors. Members failing allocation in phase 1 were then
allocated to medical specialists based on the same rule of majority visits. Failing to be allocated in
phase 2, members were then allocated to surgical specialists.
The strength of allocation was determined for each member in order to characterise the underlying
competition between providers for that allocation. The definition for these allocation strengths is
described in the figure below.
Measures the competition between Measures the strength in allocation
Strength of allocation generalist and specialist (impact of based on quantity of visits with other
the forced allocation to generalist) generalists/specialists
A member would have been allocated
to the generalist even when specialists 100% of all OH visits are to the allocated
Strong – Definite
are allowed to compete for the generalist
allocation
A member would have been allocated
to the generalist even when specialists >50% of all OH visits are to the allocated
Strong – Majority
are allowed to compete for the generalist
allocation
A member would have been allocated
to the generalist even when specialists 50% of all OH visits are to the allocated
Weak – Majority Since we have forced the allocation to a
generalist
generalist, the member is instead
allocated to a generalist
A member would have been allocated
to specialist (based on most visits).ANALYSIS AND RESULTS
In order to understand the influence of patient-doctor allocation and the impact of this relationship on
emergency department visits, three questions were posed:
1. Is there a difference in the actual versus expected admission rates via emergency department
by primary care provider allocation strength?
2. How does this correlate with the ED visit classification that is outputted by the ACG system?
a. To answer this question, we looked at the experience of RUB 3 members only to avoid
difference in patient complexity skewing the results
3. How much variation is there in the environment when it comes to making a decision to admit a
patient into hospital from an emergency department?
When we examine the impact of allocation on actual versus expected admission rate via the Emergency
Department (ED) in the figure below, we see that for those members allocated strongly to a GP as well
as KeyCare members have a lower than expected admission rate via ED.
Actual over expected admission via ED by allocation type
106%
105%
104%
102% 101%
100%
100%
98%
97%
96%
94%
92%
No allocation Weak allocation Strong allocation Keycare allocation
This clearly indicates that having a strong relationship with your primary care provider and using these
providers as the first point of entry into the healthcare system has a definite impact on downstream
costs and utilisation.
Page 10 of 17Further to this we also see that the type of relationship can improve outcomes even more i.e.
members with higher percentages of visits to their primary healthcare provider have lower
downstream costs and utilisation.
Actual over expected admission via ED by allocation type
98% 98%
97%
97%
96%
95%
94%
93%
93%
92%
91%
90%
Definite Majority Minority
Drilling down into RUB 3 members and looking at the ED classification output from the ACG system for
the ED visits for these patients it is clear that there is a significantly lower amount of ED visits per 1,000
claimants for strongly allocated patients compared to weakly allocated patients.
RUB 3 patients - ED visits per 1,000 claimants
140 -32%
120
100
-36%
80
60
40 -28% -31%
20
0
Emergent, ED Needed - Emergent, ED Needed - Emergent, Primary Care Non-emergent
Not Potentially Avoidable Potentially Avoidable Treatable
Weak Strong
Page 11 of 17This is evident across almost all 11 ED classifications for these RUB 3 patients with differentials of
between 12% and 38%.
Per 1,000 distinct claimants Weakly allocated Strongly allocated Differential
Alcohol Use 0.32 0.27 -16%
Drug Use 0.11 0.07 -37%
Emergent, ED Needed - Not Potentially Avoidable 26.77 19.17 -28%
Emergent, ED Needed - Potentially Avoidable 11.83 8.11 -31%
Emergent, Primary Care Treatable 89.17 57.47 -36%
Injury, Non-severe 53.77 47.37 -12%
Injury, Severe 13.45 9.77 -27%
Injury, Severe & Inpatient Hospitalization Likely 0.47 0.52 10%
Non-emergent 127.44 86.53 -32%
Psychiatric 8.30 5.14 -38%
Unclassified 7.40 4.90 -34%
Total 339.09 239.33 -29%
The following graph shows on the X-axis the number of ED visits and on the Y-axis the efficiency (actual
over expected admissions via ED). Each dot on the graph represents a single hospital facility. From the
graph it is clear that there is a lot of variation when it comes to admitting patients into hospital from ED
and there clearly are some hospital facilities that are much more efficient on admissions via ED into
hospital than other facilities.
ED visits versus admission via ED efficiency
200.0%
180.0%
Actual/Expectd admissions via ED
160.0%
140.0%
120.0%
100.0%
80.0%
60.0%
40.0%
20.0%
0.0%
- 5,000 10,000 15,000 20,000 25,000 30,000 35,000
ED visits
Page 12 of 17APPLICATIONS
Benefit design
In January 2019 Discovery Health Medical Scheme launched a new benefit plan which was designed
around the findings of this analysis. This benefit plan is designed with having a primary care provider
as your entry point into the healthcare system i.e. a member has to see their primary care provider first
before they can unlock any benefits to secondary and tertiary care. Initial analysis shows promising
findings around use of ED departments when comparing the new plan to an existing comparative plan
i.e. a plan with similar benefits without the need to enter through a primary care provider.
The graph below shows that in almost all of the categories there is more than a 40% difference in ED
visits per 1,000 claimants for the RUB 3 patients on the new plan compared to the comparative plan.
This is significantly more than the findings on RUB 3 patients presented above:
Page 13 of 17The admission rate via emergency department is also much lower for the patients in RUB 3 on the new
plan compared to the patients in RUB 3 on the comparative plan as is evident in the graph below:
RUB 3 patients - Admission rate via ED
33.0%
32.5%
32.0%
31.5%
31.0%
30.5%
Comparative plan New plan
This difference in behaviour in the utilisation of emergency departments and the subsequent
admission rate into hospital allowed us to decrease the contributions members pay on this benefit plan
significantly and to make this plan more attractive to our members. It clearly shows the benefits of
better primary health care utilisation and the consequent utilisation of tertiary health care.
Network selection
Another area in which the findings of this analysis were used was around hospital network selection. In
the benefit plans we offer we have the ability to offer the same benefits at a discounted contribution
for members who agree to use a network of healthcare provider.. These delta plans offer the same
benefits to the parent plan however members have to use one of the hospitals on the network list for
full cover. In selecting the hospitals on the network we have the ability to select the hospitals that are
most efficient on cost per admission (adjusted by DRG) as well as admissions into hospital from an
emergency department visit. This allows us to lower the contributions for our members who agree to
use these hospitals which makes these plans much more attractive. The graph below shows the
benefits and outcomes of our delta option compared to our parent plan on ED efficiency as well as
admission rate via ED.
Page 14 of 17Parent plan compared to Delta option
100% -6%
90%
80%
70%
60%
50%
40%
-7%
30%
20%
10%
0%
ED Efficiency Admission rate via ED
Parent plan Delta option
CONCLUSION
This paper has shown the importance of a strong relationship with a primary care provider in
managing downstream costs which leads to improved patient outcomes and lower healthcare costs.
The findings of this paper supports the new benefit design path that Discovery Health has embarked
on by creating lower costing benefit options where members’ entry point into the healthcare system
has to be a primary care provider.
The findings also supports the creation of more network based options which channels members to
more efficient hospitals, not only on cost of treating patients in hospital but also on the decision to
admit patients into hospital from an emergency department.
Page 15 of 17Appendix A
DETAILS OF VARIABLES USED IN THE EXPECTED ADMISSION RATE VIA EMERGENCY
DEPARTMENT METHODOLOGY
Variables Description
EMERGENCY_DEPARTMENT_CONDITION This is the condition of the emergency department visit as coded
by the emergency department.
ACG_ROLLING_12 Rolling 12 month ACG classification starting 12 month before and
ending one month before the emergency department visit.
RUB_ROLLING_12 RUB grouping of the ACG ROLLING 12 as above.
EMERGENCY_DEPARTMENT_ICD This is the primary ICD submitted with the claim from the
emergency department. We take GP’s ICD over Hospital’s ICD.
Except when the GP submitted a non-specific ICD. If the Hospital
also submitted a non-specific ICD we take the ICD from the
admission.
AGE Age one month before the emergency department visit.
BENEFIT_PLAN Member’s medical aid plan.
HYPERTENSION_FLAG Whether a member has a flag for HYPERTENSION from the ACG
output starting 12 month before and ending one month before
the emergency department visit.
PLAN_TYPE_DESCR Grouping of medical aid plan based on benefit level.
CHRONIC_CONDITION_FLAG Whether the member is registed for any chronic condition as
YES/NO.
BENEFIT_PLAN_OUT_OF_HOSPITAL_BENEFIT_LEVEL The OH benefit level offered by the plan the member is on.
DIABETES_FLAG Whether a member has a flag for DIABETES from the ACG output
starting 12 month before and ending one month before the
emergency department visit.
PREVIOUS_ADMISSIONS_30_DAYS Whether the member had an admission in the last 30 days.
CONGESTIVE_HEART_FAILURE_FLAG Whether a member has a flag for CONGESTIVE CARDIAC FAILURE
from the ACG output starting 12 month before and ending one
month before the emergency department visit.
CHRONIC_OBSTRUCTIVE_PULMONARY_DISORDER Whether a member has a flag for CHRONIC OBSTRUCTIVE
PULMONARY DISEASE from the ACG output starting 12 month
before and ending one month before the emergency department
visit.
CANCER_TREATMENT_FLAG Whether a member has a flag for CANCER from the ACG output
starting 12 month before and ending one month before the
emergency department visit.
Page 16 of 17MEDICAL_SCHEME_DESCR The medical scheme that the member belongs to.
SEX Biological characteristic of the member (male/female)
CHRONIC_RENAL_FAILURE_FLAG Whether a member has a flag for CHRONIC RENAL FAILURE from
the ACG output starting 12 month before and ending one month
before the emergency department visit.
EPILEPSY_FLAG Whether a member has a flag for EPILEPSY as a chronic condition
starting 12 month before and ending one month before the
emergency department visit..
HIV_FLAG Whether a member has a flag for HUMAN IMMUNODEFICIENCY
VIRUS HIV INFECTION from the ACG output starting 12 month
before and ending one month before the emergency department
visit.
BIPOLAR_DISORDER_FLAG Whether a member has a flag for BIPOLAR MOOD DISORDER from
the ACG output starting 12 month before and ending one month
before the emergency department visit.
PERSISTENT_ASTHMA_FLAG Whether a member has a flag for ASTHMA from the ACG output
starting 12 month before and ending one month before the
emergency department visit.
HYPOTHYROIDISM_FLAG Whether a member has a flag for HYPOTHYROIDISM from the ACG
output starting 12 month before and ending one month before
the emergency department visit.
PARKINSONS_DISEASE_FLAG Whether a member has a flag for PARKINSONS DISEASE from the
ACG output starting 12 month before and ending one month
before the emergency department visit.
Page 17 of 17You can also read