Regional Overview of Energy Situation in the Pacific Island Countries (PICs) - Makereta Lomaloma Economic Development Division Secretariat of the ...
←
→
Page content transcription
If your browser does not render page correctly, please read the page content below
Regional Overview of Energy Situation
 in the Pacific Island Countries (PICs)

                   Makereta Lomaloma
             Economic Development Division
           Secretariat of the Pacific Community
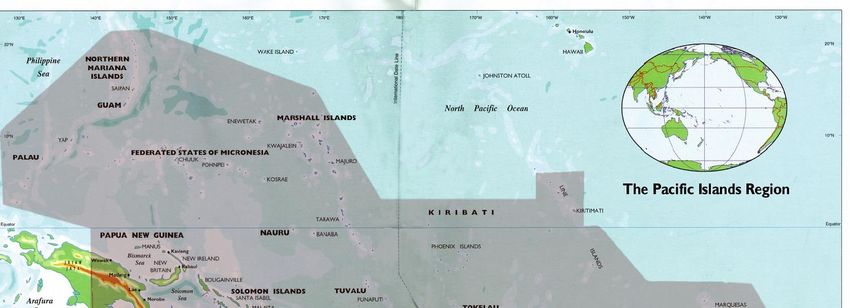
Content
• The PICs - Our geography and location
• The challenges we face
• Our guidance to energy security
  – FAESP Framework
• Our Energy Situation to date
1. All PICs put together
                                 GLOBAL SCENARIO
   contribute to 0.4% of the
   total global land mass.
2. Population of the PICs is
   roughly around 0.15% of the
   total global population.
3. PICs are scattered over 165.2
   million km2 in the Pacific
   Ocean which accounts for
   44% of the worlds ocean.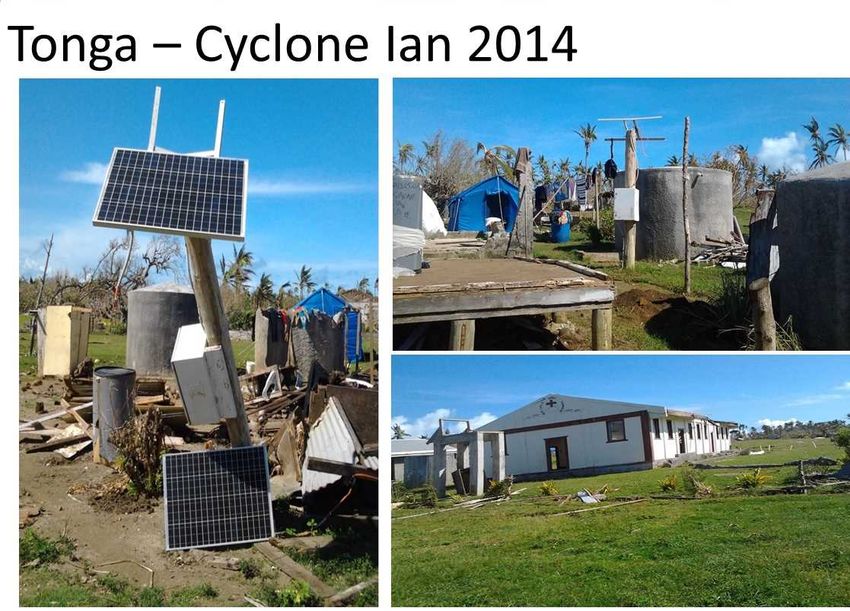
Cultural Sub-Regions

                       Micronesian
                          group

            Melanesian Group
                                                             Polynesia group

      2010 estimates       22PICs          Melanesian Polynesian Micronesian
           Land Area 553.52 thousand Km2        98.0%        1.4%       0.6%
                 EEZ         2.98 mil Km2       27.4%      37.2%       35.4%
          Population           9.8 million      87.8%        6.7%       5.5%
    Urban Population           2.2 million      18.7%      37.6%       66.6%
   Population density                   18         16          83        171
      GDP per capita            $US3,891 US$2,713 US$13,058         US11,489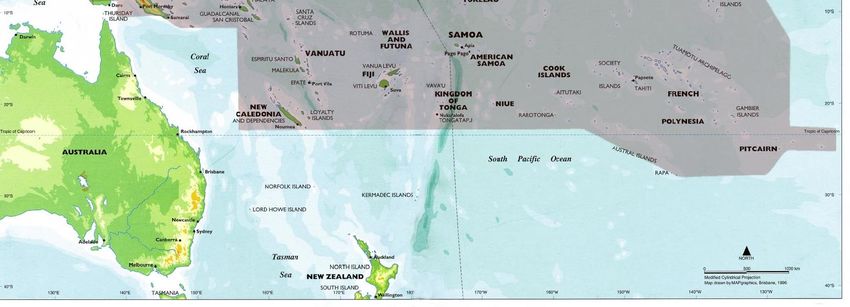
Cultural Sub-Regions by size and resources

Melanesian Countries                                         Polynesian & Micronesian countries
                                             Mid-sized island states                 Small &low island states
•Large, mountainous and mainly volcanic      • have limited land resources, little   • Land and soil poor
islands.                                       or no commercial forests, and no      • Natural resources are mostly limited
•Have considerable natural resources:          commercial mineral deposits.            to the ocean
fertile soils, large forests, and mineral    • Few tradable natural resources        • The most vulnerable places on Earth
deposits                                       and virtually no manufacturing          to the adverse impacts of climate
• Rural and agricultural (about 85% of the     industry                                change and sea level rise.
people live in rural areas;                  • Many of these islands enjoy a         • Key problems: shore erosion,
•Cultural and social diversity. More than      high standard of living from            vulnerability to storms and droughts,
100 dialects are spoken in PNG, Solomon        foreign assistance and                  fresh water scarcity, ground water
Islands and Vanuatu                            remittances from expatriate             pollution, solid waste disposal
                                               island communities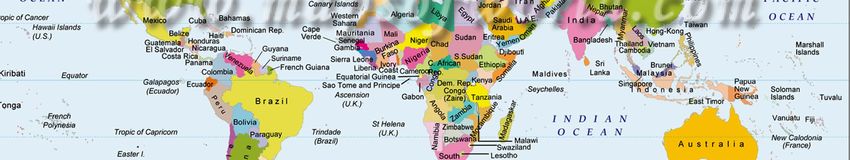
THE CHALLENGES WE FACE IN THE
           REGION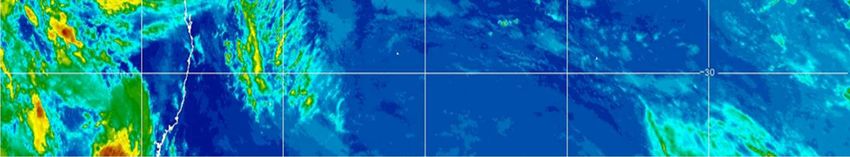
Isolated           Narrow
markets            range of
                  resources

             Small
           Population          Remote
             base             locations
                                            Limited
                                           skills and
                              Small       know how
                              market
                               sizes                       low
                                                        economies
                                                         of scale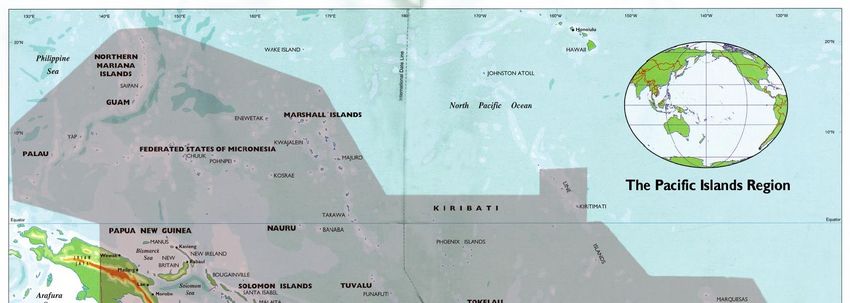
EXTREME CLIMATE
   CONDITION .
 Hurricanes
 Flooding
 tsunamis
 Draught
 Sea level rise
Our guidance to energy security
      FAESP Framework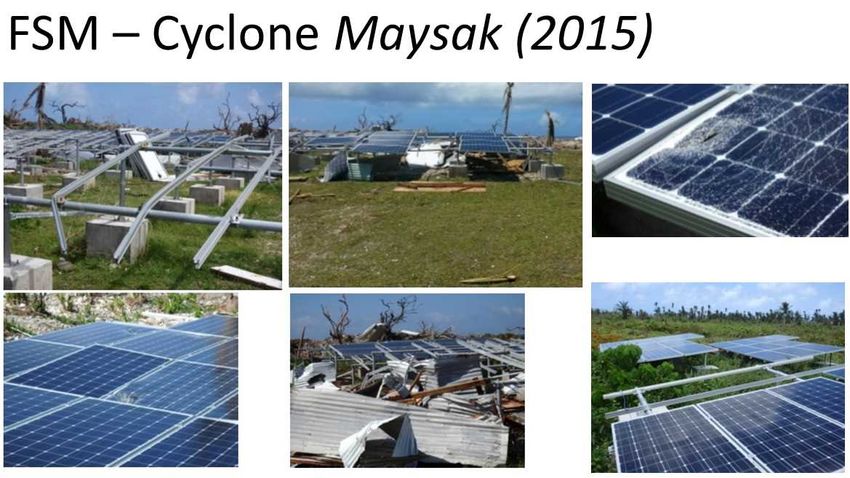
Framework for
 Action on Energy
  Security in the
      Pacific
“Energy security exists when all
 people at all times have access
to sufficient sustainable sources
 of clean and affordable energy
  and services to enhance their
    social and economic well-
              being”
Application of FAESP
IPESP Implementation Plan FAESP Baseline Security
2010 - 2015 IndicatorsOur Energy Situation to date
A stock of the Legislative and Policy
     process in the countries.
Planning and Coordination
Energy Sector Act Policy/Road Energy Institutions
map
Cook Yes Yes (4) Office of the Energy Commissioner (OPM)
Islands http://www.pmoffice.gov.ck
Fiji No Yes (2) Energy Department - www.fdoe.gov
FSM No Yes (2, 5) National Energy Office
Kiribati No Yes (2) Energy Planning Office - http://mpwu.gov.ki/
Nauru No Yes (1,2) Energy Unit
Niue No Yes (2) Ministry of Infrastructure
Palau Yes Yes (2, 5) Energy Office
http://www.palauenergyoffice.com/?page_id=2
PNG No No Energy Division
RMI No Yes (2, 5) Energy Planning Division
Samoa No Yes (3) Energy Policy Coordination and Management Division
http://www.mof.gov.ws/
Solomon No Yes (2,5) Energy Division
Is.
Tonga No Yes (1), (2) Energy Department
Tuvalu No Yes (2,4) Energy Unit
Vanuatu No Yes (1) Energy DepartmentPetroleum sector
Petroleum Act National Fuel Supply Price Control Act
Contract
Cook Islands Yes No Yes
Fiji Yes No Yes
FSM Yes Yes No
Kiribati Yes Yes Yes
Nauru Yes No Yes
Niue Yes Yes Yes
Palau Yes No No
PNG Yes No Yes
RMI No No Yes
Samoa Yes Yes Yes
Solomon Yes Yes Yes
Islands
Tonga Yes Yes Yes
Tuvalu Yes No Yes
Vanuatu Yes No NoPower Sector
Electricity Act Fuel Supply Feed In Tariff
Contract
Cook Islands Yes Yes No
Fiji Yes Yes Yes
FSM Yes NA Yes
Kiribati Yes NA No
Nauru Yes NA No
Niue Yes NA No
Palau Yes Yes Yes
PNG Yes Yes Yes
RMI No Yes No
Samoa Yes Yes Yes
Solomon Yes Yes Yes
Islands
Tonga Yes Yes Yes
Tuvalu Yes No No
Vanuatu Yes Yes YesRenewable Energy Sector
Renewable Act Policy Targets Net Metering
Act/Policy
Cook Islands No Yes 100% of inhabited islands by 2020 Yes
Fiji No Yes 81% by 2020 No
FSM No Yes 10% by 2020 ( urban area) No
50% by 2020 ( rural areas)
Kiribati No Yes 45% by 2025 ( Tarawa) No
60% by 2025 ( Kiritimati)
Nauru No Yes 50% by 2020 No
Niue No Yes 100% by 2020 No
Palau No Yes 20% by 2020 Yes
PNG No Yes 50% by 2030 ( GHG reduction) No
RMI No Yes 20% by 2020 No
Samoa No Yes 10% by 2016 No
Solomon Is. No Yes 50% by 2015 No
Tonga Yes Yes 50% by 2020 Yes
Tuvalu No Yes 100% by 2020 No
Vanuatu No Yes 65% by 2020 YesMonetary Policies
CKI FIJ FSM KIR NAU NIU PA PN RMI SA SOL TO TU VAN
L G M N V
Lifelines Tariff Yes Yes Yes No Yes Yes Yes Yes Yes Yes No No Yes Yes
Energy Loans No Yes No No No No Yes No No No No No No No
Petroleum Yes Yes No Yes Yes No No Yes No Yes Yes Yes Yes No
pricing control
Electricity tariff Yes Yes No No No No No Yes No Yes No Yes No Yes
control
Freight levy to Yes Yes No Yes NA NA No Yes No NA Yes No Yes No
outer islandsFiscal Incentives
Exemption/Reduced on Import/Excise Duty
CKI FIJ FSM KIR NAU NIU PAL PNG RMI SAM SOL TON TUV VAN
Diesel for power Yes No No Yes Yes Yes Yes ND Yes Yes No Yes Yes Yes
generation exemption
Diesel for biofuel or NA Yes NA NA NA NA NA ND NA No No NA NA No
Coconut Oil
production
Renewable Energy No No No No No No No ND Yes No No Yes No Yes
Technologies
[1
Energy efficient No Yes No No No No No No Yes No No No No No
(energy star) rated
appliances
Efficient vehicles Yes Yes No Yes Yes Yes No No No Yes No Yes No No
(increased seat
capacity and lower
fuel cylinder capacity
Fuel efficient vehicles No Yes No No No No No No No No No No No No
(LPG and hybrid cars)
Kerosene for NA Yes No Yes No NA No Yes NA No No Yes Yes No
household use
Aviation fuel Yes No No No Yes Yes No No No No No Yes Yes YesFiscal Incentives
Exemption on tax ( VAT ,Consumption Tax, VAGST, Service Tax)
CKI FIJ FSM KIR NAU NIU PAL PNG RM SA SO TO TU VAN
I M L N V
Electricity Yes No No No NA No No ND Yes No No No No No
cost
RESCOs NA Yes No No NA NA No No No No No No No No
(biofuel, solar
etc)
Kerosene for NA Yes No Yes NA NA No Yes No No No Yes No No
households
Aviation Fuel No No No NA Yes No ND No No No Yes No No
LPG No No No NA No No ND Yes No No No No No
Mogas No No No NA No No ND No No No No No No
(petrol,
gasoline) and
ADO
NA – Not Applicable
ND – No DataSome Energy Indicator Comparison
Electrification level
100%
                                 median - 93%
90%
80%
70%
60%

                                                                      100%

                                                                             99%

                                                                                         99%
50%
               98%

                                                                                   98%
                                                          97%

                                                                92%
                     93%

                                              84%
40%
       65%

                           62%

30%                              mean - 30%

20%

                                                    33%
                                       21%
                                 20%

10%
 0%

             estimates from other sources - DHS, HIES, Energy Office estimates.
             Latest census records (2009-2012)
Grid Connected Electrification
100%
90%
80%
70%
Median - 67%
60%
50%
99%
97%
96%
95%
95%
89%
40%
72%
62%
30% Mean - 25%
55%
43%
20%
28%
10%
17%
12%
0%
0%
Estimates from other sources - DHS, HIES, Energy Office estimates.
Latest census records (2009-2012)Off-grid electrification
35%
30%
25%
20%
31%
15%
10%
19%
9%
12% Mean - 4.4%
5%
9%
0.3%
5%
1%
5%
1%
4%
3%
3%
0%
0%
Latest census records (2009-2012) Estimates from other sources - DHS, HIES, Energy Office estimates.HH Access to Modern Cooking - National
120.0%
100.0%
96.1%
95.9%
92.50%
91.00%
80.0%
65.6%
60.0%
59.30%
54.5%
52.00%
40.0%
41.7%
32.6%
30.0%
20.0%
12.10%
13.6%
6.7%
0.0%0%
20%
40%
60%
80%
100%
120%
98.8%
97.6%
93.7%
97.8%
69.70%
96.3%
99%
92%
96.7%
97.8%
100%
HH Access to Modern Lighting - National
99.3%
96.00%
99.6%Macro-economic affordability - 2011
30.0%
25.8%
25.0%
20.0%
18.2% 18.5%
15.3%
15.0% 14.4%
10.5% 11.0%
9.8%
10.0%
6.8%
5.6%
5.0%
0.0%Average Electricity Tariff in PICs - 2011 0.9000 0.8000 0.7000 0.6000 0.5000 0.4000 0.3000 0.2000 0.1000 0.0000
0.00%
           5.00%
                     10.00%
                                 15.00%
                                             20.00%
                                                       25.00%
                                                                   30.00%

                                 13.76%

                                                      22.72%

                    7.82%

                                          16.23%

                       9.30%

                         9.84%

                   6.98%

                                                       23.83%

                    7.64%
                                                                            Household Energy Expenditure

        1.18%

                                                                 27.75%

                                          16.67%

                                                                26.76%
Renewable energy share - 2009
10.00%
8.81% 9.01%
9.00%
8.00%
7.00%
6.00% 5.60%
5.00%
4.00%
3.00%
2.00%
1.00%
0.33%
0.03% 0.04% 0.11% 0.05% 0.05% 0.02% 0.04% 0.03% 0.20% 0.03%
0.00%
Contribution from traditional use of biomass such as household cooking is
excluded in analysisSource : 2011 PPA Benchmarking
Source : 2011 PPA Benchmarking
Clean Electricity Contribution
2.00%                                             1.85%
                                                                                                 1.64%
1.50%

1.00%
                             0.65%                                             0.64%
0.50%     0.29%     0.26%                0.31%             0.30%    0.22%              0.29%

0.00%
          Cook      FSM -   Kiribati - Nauru -   Niue -   Palau -   RMI -   Solomon - Tonga -   Tuvalu -
        Islands -    ave.     PUB       NUA       NPC      PPUC     MEC        SIEA     TPL       TEC
           TAU
                                      Excluding - Fiji, PNG, Samoa & Vanuatu
Clean Electricity Contribution - Clean Electricity Contribution - Polynesian
Melanesian countries Countries
70.00% 40.00%
35.00%
60.00% 30.00%
50.00% 25.00%
40.00% 20.00%
30.00% 15.00%
10.00%
20.00% 5.00%
10.00% 0.00%
0.00% Cook Niue - NPC Samoa - Tonga - TPL Tuvalu -
Fiji - FEA PNG - PPL Solomon - SIEA Vanuatu - Islands - EPC TEC
UNELCO TAU
Clean Electricity Contribution - Micronesian countries
1.80%
1.60%
1.40%
1.20%
1.00%
0.80%
0.60%
0.40%
0.20%
0.00%
FSM - ave. Kiribati - PUB Nauru - NUA Palau - PPUC RMI - MEC Tuvalu - TECClean electricity contribution 2011
Source: 2011 PP Benchmarking reportSource: Pacific Fuel Price Monitor
Thank You
You can also read