Relative Age Effects in Welsh Age Grade Rugby Union
←
→
Page content transcription
If your browser does not render page correctly, please read the page content below
Relative Age Effects in Welsh Age Grade Rugby Union
Jason Lewis, Kevin Morgan, Stephen-Mark Cooper
Cardiff School of Sport
Cardiff Metropolitan University
ABSTRACT
Relative age effect (RAE) refers to the immediate and long-term consequences of
age difference within an age grouping. In sporting contexts, it has been widely
shown that those born in the first quarter gain an advantage over those born in the
last quarter of the year. Rugby union has received scant attention in relation to
RAE. The primary purpose of the present study was to examine the presence and
prevalence of RAE in Welsh age grade Rugby Union. A further purpose was to
consider how coaches’ selection processes have the potential to contribute to the
manifestation of RAE. A sequential multi-method research typology was adopted
to gain a richer, more contextualized understanding of RAE. Results revealed that
RAE was evident in all age groups of Welsh junior club rugby from ‘Under 7-19
yrs’. Odds ratios showed that the magnitude of the RAE increases with the three
levels of performance (district, regional and national) above the club game.
Further, the process of selection had characteristics that increased the risk of RAE
occurring, especially a propensity to use physical characteristics as the primary
selection criteria when selecting for representative teams. Also, coaches over
emphasis on game performance and winning appeared to determine that the older,
potentially bigger, faster, stronger players are preferred over the younger less
physically mature players.
Key words: Relative Age Effects, Rugby Union, Selection
Corresponding author: Dr. Kevin Morgan, Senior Lecturer, School of Sport,
Cardiff Metropolitan University Cyncoed Campus, Cyncoed Road, Cardiff, CF23
6XD, Wales, UK.
Telephone: 029 20416586. E-mail: kmorgan@cardiffmet.ac.uk.INTRODUCTION
Rugby Union is a popular male participation sport in Wales, with total playing
numbers exceeding 50,000; 30,000 of those are under 19 years of age. The
Welsh Rugby Union (WRU) organizes its age group players around an August
31st cut-off date in any year, in line with the education system’s academic year.
Representative teams begin at under 11 years of age (U’11) and continue at
each age group to under 18 years of age (U’18). Welsh male rugby union would,
therefore, appear to possess the necessary propagating conditions (popular male
team sport, established talent development pathway and high competition for
places) that increase the risk of relative age effect (RAE) bias occurring [1]. Like
many other sports, rugby in Wales is subject to a decline in playing numbers with
increasing age. The sport loses 32% of its participants between 13 and 19 years
of age [2].
RAE refers to the immediate and long-term consequences of relative age
difference between those within an age grouping [1]. In both the educational [3, 4]
and sporting [5, 6] contexts it has been widely shown that those born in the first
quarter gain an advantage over those born in the last quarter of the year. These
advantages include being more physically developed (taller, heavier, faster and
stronger) and, therefore, possessing a greater propensity to perform than their
younger peers in physical activities [7]. In addition, other advantages linked to
short-term maturational differences such as enhanced cognitive and social
development have been suggested that also assist the older players to outperform
their younger peers [8].
Rugby Union has received scant attention in relation to the presence and
prevalence of RAE. Also, acknowledging previous research directions in this area,
the present study aimed to not merely establish the presence or otherwise of RAE
in Welsh Rugby Union using quantitative analysis but to go further and use an
additional qualitative approach to consider the affect that the selection of players
by coaches might have on RAE, thus making this a distinctive addition to the
research in the area.
2RAE has been studied extensively in a variety of sports [e.g., 9, 10, 11]
Musch and Grondin’s [12] review of RAE identified 35 separate studies across
sports with a predominance of research in soccer and ice hockey. Further, Cobley
et al. [1] in their meta-analytical review of RAE research identified 38 studies in 14
different sports across 16 countries that had identified the presence of RAE.
Results from these studies broadly emphasised that the strongest and most
consistent RAE is identified in male sports and that those born closest to the start
of the selection year are over-represented within the higher representative levels
of that sport. Baker et al. [5] proposed that a sports’ popularity and competition
infrastructure provide the propagating conditions that perpetuate RAE. Consistent
with this, Musch and Grondin [12] propose that the strength of RAE is dependent
on the depth of competition for places in teams in talent development programmes,
created in popular sports. Further, Barnsley and Thompson [13], Deaner et al. [14]
and Sherar et al. [15], all provide support for the notion that competition for places,
particularly at the higher levels of talent identification infrastructures, increases the
risk of RAE bias. RAE has also been shown to contribute to drop out from sport
[16]
Physical performance is related to biological maturation. Philippaerts et al.
[7] and Musch and Grondin [12], note that a greater chronological age increases
the likelihood of more advanced physical characteristics being primarily
responsible for RAE. In sports, like rugby, where body size, strength and power
provide an advantage, RAE is likely to be more prevalent [17]. Martindale et al.
[18] identified that many talent development systems use current performance
measures as the main indicators of talent, when talent should be measured by
future potential. Vaeyens et al. [19] support this view, noting that talent
development systems over emphasise measures that are positively influenced by
maturational factors. They suggest that, as a result, a large number of current
talent development models are likely to exclude many, especially late maturing
athletes
To date, the investigation by Till et al. [17] represents the most detailed
study of RAE in rugby across either code (union and league) of the game. Their
3results revealed that RAE was present across all male age groups from as early
as U’7. Further, they demonstrated that between levels of performance the RAE is
magnified at each successive level of representation in the U’13 to U’15 age
groups. The significant magnification of this asymmetry with successive levels of
performance suggests that other factors, such as player selection processes,
might be contributing to the RAE observed.
Similarly, other recent research into RAE has begun to shift the focus away
from merely establishing the existence (or non-existence) of RAE in particular
sports, to seeking to understand the factors that contribute to that existence [e.g.,
20, 21, 22]. Player selection has been identified as a potential influence on RAE,
but to date, there is a lack of research that has investigated the nature of coach
selection behavior that propagates RAE [5].
Given the early maturational explanation offered as one of the underlying
process of RAE [23], and the physical requirements of Rugby Union, it is possible
that coaches involved in the selection of players will use measures, or be
influenced by factors, that have a positive relationship with early maturation. The
implications for rugby in Wales are significant. As Vaeyens et al. [24] noted, such
practices might provide the early born with enhanced selection opportunities but,
conversely, their younger counterparts will receive a less positive experience,
which ultimately might lead to the youngest in the age group dropping out.
METHODS
RESEARCH DESIGN
A sequential multi-method typology was adopted to gain a richer, more
contextualized understanding of RAE [25, 26]. Such a typology is particularly
useful when a researcher implements both quantitative and qualitative strands in
distinct sequential order [26]. In the present study, the quantitative strand firstly
examined the presence and extent of RAE in age grade rugby in Wales. The
qualitative strand that followed sought to provide a level of insight into the
processes that might promote RAE.
4QUANTITATIVE PHASE
Participants
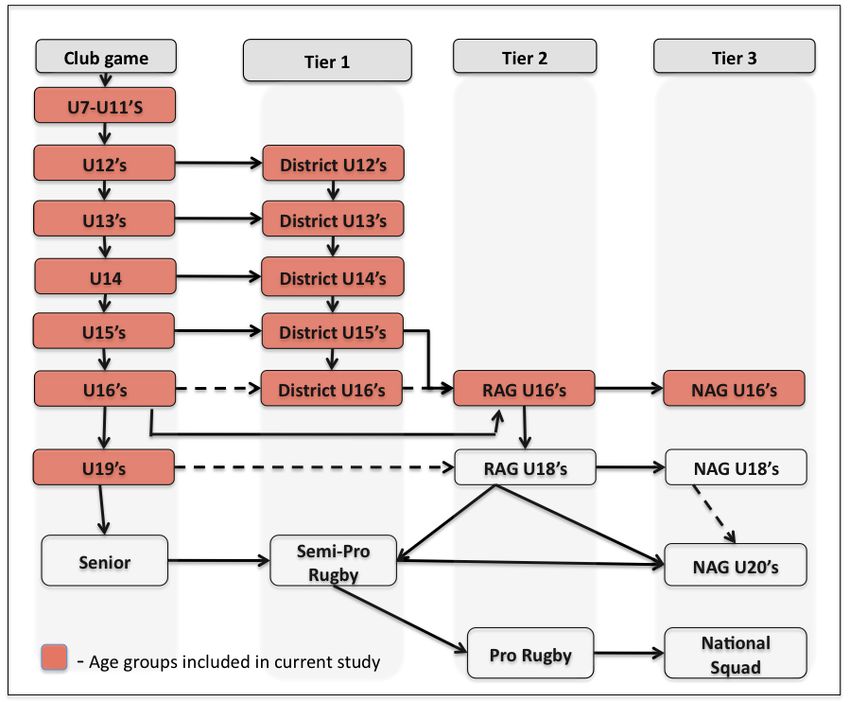
The quantitative phase accessed data for 98% of the whole population being
studied. Welsh rugby’s player development pathway (see Figure 1) is organised
by both age group and level of competition and the present study sampled a total
of 34,788 rugby players from within that pathway.
Insert Figure 1
Procedures
To measure the relative age distribution in Rugby Union players in Wales, the
study required an expected distribution for the wider population of similarly aged
males, to be used as a comparison. National statistics provided birth data, for
males only, for the years 1993 to 2003 inclusive, which correspond to the year of
birth of players in the club and representative teams in the study.
Following ethical approval from the research ethics sub-committee of the
Cardiff School of Sport and consent from the WRU, the WRU internal registration
system known as ‘MyWRU’ provided information on all club registered players in
the U’7 to U’19 age groups for the 2011/2012 playing season. Additionally, data
from the U’12 to U’16 district, regional and national cohorts was collected for the
2011/12 and 2012/13 seasons from WRU district and regional squad databases.
The MyWRU system and district databases provided data on players containing
only details of their date of birth (DOB).
Data were categorised into relative age quartiles: quartile one (Q1) =
September 1st to November 30th; quartile two (Q2) = December 1st to February
28th; quartile three (Q3) = March 1st to May 31st; and quartile four (Q4) = June 1st
to August 31st (see Table 1). The percentage of births for each quartile was
calculated from the births within the sample. The relative age in the registered U’7-
U’19 club players’ sample was compared to the expected relative age distribution
drawn from national statistics [27, 3]. To address the district, regional and national
representative teams, the relative age distribution of the club players sample was
5then used to compare the expected distribution with the observed birth distributions
of the representative players [28].
Insert Table 1
QUANTITATIVE DATA ANALYSIS
A chi-square test (2) for goodness-of-fit was used to analyse the data and an odds
ratio test (OR) was used to compare the odds of a player born in Q1, Q2 or Q3 to
the odds of a player born in Q4 being selected. The ORs provide an indication as
to the whether direction of the relative age distributions differed from the expected
distributions.
QUALITATIVE PHASE
Participants
The qualitative strand of the study adopted a purposive sampling strategy to
explore the selection processes employed by coaches for representative age
group teams. To investigate the impact that selection might have on RAE [29]. The
sample for this phase was drawn from three levels of competition (district, regional
and national). Twenty development officers who met the studies selection criteria
of having held coaching roles with a district team or regional team over the two
seasons before the start of the study (14 worked at district level exclusively, whilst
six had worked at both district and regional levels) agreed to participate in the
study. In addition, six coaches of a national age group squad agreed to participate,
Procedures
All participant coaches were provided with a letter detailing the nature of the study,
the research design and how the results were going to be used [30]. The principal
researcher confirmed the anonymity and confidentiality of the participants and
6informed them of their right to withdraw at any time. All agreed to participate,
providing written informed consent.
Coaches were told that they would be participating in a focus group
discussion about selection of players to representative teams. Focus groups were
adopted as the medium for this discussion as they serve to extend thinking about
a particular issue [31]. Furthermore, Bloor et al. [32] note that focus groups have
a role in shared understanding, both revealing shared values and identifying
difficulties with such norms. It was felt, therefore, that focus groups would be the
most effective method for exploring the shared difficulties of selection in relation to
the norms of expectation on the coaches. No reference was made to RAE in any
of the documentation or verbal explanation given to the participants before or
during the focus group meetings. All coaches therefore entered the focus groups
blind to the study intentions.
Three separate focus groups explored the coaches’ shared knowledge and
experience around the selection of players [33]. Each focus group was planned for
90 minutes duration and was held in a relaxed familiar setting. The national squad
coaches (n = 6), formed the first group, with the development officers groups
forming the second, (n = 6) and third (n = 14) focus groups. The total sample
represented 37% of the coaches working at district, regional, and national level in
Wales.
A series of questions was developed that followed the classic ‘funnel
structure’ of broad open-ended questions before shifting toward narrower more
focused questions [34, 30]. The questioning route was structured around 12
questions, organized into five categories (opening questions, introductory
questions, transition questions, key questions and ending questions) with the ‘key
questions’ having the highest level of importance and therefore receiving the
greatest amount of time and intensity of analysis. Examples of key questions asked
– ‘List the key characteristics you look for in a player’ ‘What processes do you use
to select players?’ ‘Do you use different criteria for selection of players to different
positions?’ ‘Discuss how important player size was in your selection decision’
‘What are your measures of success with this team?’
7Data collection took the form of audio recording of every focus group which,
was then fully transcribed. The participants were subsequently presented with a
copy of the transcript and asked to check for accuracy [30]. All participants
subsequently confirmed the accuracy of the transcripts.
Data Analyses
A constant comparative framework was adopted to analyse the transcribed
data whilst adopting an open coding approach [30]. Each transcript was read line-
by-line, to identify ‘meaning units’ which, using a thematic analysis approach, were
organized around the principle questions [36]. Meaning units were grouped into
sub-themes and assigned a label that best described them. All sub-themes were
then extracted and theme labels developed. In the final data reduction, categories
were created that subsumed all themes, sub-themes and meaning units. These
categories were checked and agreed upon by all members of the research team.
RESULTS
QUANTITATIVE ANALYSIS
Club Registered Players
For the national statistics on male births, a 31st August cut-off point produced the
following relative age distribution represented in quartiles: Q1 = 25%, Q2 = 24%,
Q3 = 25%, and Q4 = 26%. This distribution provided the expected distribution for
comparison with the observed club registered player population reported in Figure
2. The club player (combined) relative age distribution was calculated from all club
registrations (U’7 to U’19) and showed the distribution to be: Q1 = 29%, Q2 = 26%,
Q3 = 23%, Q4 = 22% for the club playing population (see Table 2).
Insert Figure 2
Insert Table 2
8Chi-square goodness-of-fit results showed that the relative age distribution
in club registered players (combined) was not equal to the all-Wales male
population: 2 = 489.7 (df = 3, n = 32485), P < 0.001. Table 2 shows the relative
age distribution in quartiles (Q1-Q4), 2 and OR for all male club registered players
(U’7 to U’19). Chi-square analyses revealed statistically significant (P < 0.05)
differences between the observed and expected distributions in every age group
from U’7 to U’19 club players.
There was an asymmetry to the distribution of the births in the club playing
population in favour of those born closer to the September 1st start of season date.
Significant OR (95% CI) were found at all age groups (U’7 to U’19) for Q1 v Q4,
Q2 v Q4 and Q3 v Q4. A comparison of relative age distribution (Figure 2) showed
a clear and significant (P < 0.05) over-representation of those born earlier in the
year.
Representative Players
Chi-square goodness-of-fit test results showed that the relative age distributions in
representative age grade players was not equal to the club registered players at
the three performance levels above club rugby: district level 2 = 93.25 [df = 3, n
= 2022], P < 0.001; regional level U’16* 2 = 3.91 [df = 3, n = 47], P < 0.050 and
U’16** 2 = 54.01 [df = 3, n = 191], P < 0.001 and national level NAG U’16* 2 =
16.96 [df = 3, n = 43], P < 0.001) and NAG U’16** 2 = 24.46 [df = 3, n = 48], P <
0.001)
Table 2 shows the relative age distribution in quartiles (Q1-Q4), and ORs
for district, regional age grade (RAG) and national age grade (NAG) representative
teams. Chi-square analyses reveal statistically significant differences between the
observed and expected relative age distributions for all age groups and at all
performance levels (P < 0.05 levels). In regional age grade and national age grade
squads, players born in the first half of the year account for 71.7% and 79.8% of
the total squads compared to an expected level of 55%.
9Odds ratio statistics showed that at all age groups and at all performance
levels those born in Q1, Q2 and Q3 were over-represented compared to those
born in Q4. Further, the magnitude of this difference increased with level of
performance (see Figure 3). Indeed, this culminated at national age group level
where the odds of a Q1 born player being selected are eleven times the odds of a
Q4 born player being selected to the U’16 national squad.(Q1 v Q4 OR: 11.96,
95% CI: 3.87 to 36.97)
Insert Figure 3.
QUALITATIVE ANALYSIS
The thematic analysis created 160 individual meaning units that produced 142 sub-
theme items. These in turn were reduced to 16 broader themes (see Figure 4),
leading to the emergence of three categories:
The criteria adopted by coaches
The process adopted by coaches
The context in which decisions are made
The ‘criteria adopted by coaches’ category was made up of 41% of the meaning
units, with the ‘process’ and ‘context’ categories accounting for 33% and 26%
respectively.
During the thematic coding the principal researcher attempted to adopt an
unbiased position, but it is accepted that preconceived views were difficult to fully
eliminate from the analysis. It is also acknowledged that the principal researcher
had 16 years of experience working with the players and coaches of the age
groups in question and that this experience added to the richness of detail in the
qualitative enquiry. Findings should, therefore, be viewed in this context.
Insert Figure 4.
Criteria Used in Selection
10The selection criteria used by coaches often focused on the most obvious physical
characteristics of a player, as exemplified by one RAG coach:
“If you have 30 players lined up and you’d never seen them play and
never seen them train, and we all had to pick a team, the 3ft 2in bloke isn’t
going to get picked by any of us and he might be the best player there!”
Similarly, at district representative level a number of coaches commented
on physical size as the first priority, e.g., ‘Oh, he’s a big lump!’ and then considering
other physical attributes, e.g., ‘Can he move?’ ‘Can he run?’ thus suggesting that:
‘The person you have your eye on first of all is the person who stands head and
shoulders above the rest.’ This reflects the influence that permeates age grade
rugby from those further up the pathway to provide the right sort of players required
to service the professional game. In the words of one NAG coach: ‘In the high
performance game, what counts is bigger, faster, stronger.’
Physical characteristics, however, were not the only criteria identified by
coaches in their selection process. In particular, the personal qualities such as
‘open mindedness’, ‘work ethic’ and ‘overall coachability’ were also noted as being
important criteria when selecting players. Interestingly, however, the comments
about such qualities were more evident at the lower levels of the pathway (district)
where there was clearly a more holistic approach to the engagement of players.
In some instances, development coaches perceived that players were not
going to make it any further in the game. They felt therefore that the opportunity to
play representative rugby was going to be the pinnacle of the player’s attainment,
which was consequently used to justify their selection. This raises some questions
about coach expectations and how they could possibly know this. Indeed, the
notion of future potential was a difficult concept for them to grasp, regardless of
performance. At the district level there was a greater awareness of the need to
keep as many players involved as possible. Coaches working at regional and
national levels felt that they were measured more by immediate results, such as
match outcomes, rather than by longer-term measures such as the number of
11players they produced who progressed to full international level. Consequently, the
coaches at national age grade felt that picking the best players based on their
immediate (current) performances was the only acceptable approach to the most
important games, e.g.: ‘I think the players will expect that we will pick what we
perceive to be the guys who are most likely to perform best for us.’
Across all levels future potential was dealt with by referencing the selection
of players who already possessed the necessary size criteria to make it at the
highest level. Thus, by selecting them now they felt they were selecting for longer-
term potential. Taking a long-term view on players who did not possess any
obvious standout physical qualities was a more difficult concept for coaches at all
levels. However, as already identified, there appeared to be a greater openness to
selection, based on future potential at district level (compared to regional and
national levels):
There are players there who, given a couple of years, could make
very good players and they’re the ones I’m bothered about. I’m not
bothered about the ones I send to the region, because we know that at this
moment in time, they’ve peaked (District coach).
Thus, game performances provided the main measures for coaches at all levels
in the player pathway. It was difficult for coaches to select against predictions of
future ability based on more intangible indices such as game understanding, or
future potential size, if those traits were not being exhibited at that particular time.
In the words of one regional coach: ‘This future potential thing, that’s just a fluffy
statement, isn’t it? Who can gauge the potential of any individual; there are so
many potential impacting factors.’
Processes Used in Selection
The themes emerging from this category suggest that there was no overarching
framework to shape and inform selection decisions of the coaches at all levels.
Even within coaching groups there was very little agreement on what each coach
12should be looking for in a player. As one national coach admitted: ‘I feel almost
embarrassed that we haven’t ever sat down as selectors at the start of the process
and said: “This is what we’re looking for in a player”.’
Selection of players, therefore, appears to be a personal process based
predominantly on the past experience of that coach regardless of the level at which
they coach. A shared mental image of the player required did not exist within this
group of coaches at any of the levels. Selection decisions were individualized,
typically based on personal experience, understanding or preference. In the words
of one of the national coaches: ‘When it comes to the end when everyone looks at
each other and says “Right, we have to make a decision”, then you have to go with
whatever is in your gut.’ Indeed among this group of coaches, it was suggested
that creating criteria could confuse the process of selection: ‘If you put a standard
down, e.g. “this is what we’re looking at, as a scrum-half or as a hooker,” you’d
contradict yourself from day one.’
In terms of selection processes, a hierarchical system seemed to exist
within this group of age grade coaches, with the head coach/es having the first
selection and ultimately the final say. As one national coach put it: ‘I think there is
a lot of respect within the group even though there are tiers within it. There’s the
Forwards Head Coach and a Backs Head Coach and they lead the way on it
(selection)’.
The focus groups revealed that the majority of selection decisions were
made through game observations. Only at the lowest level (district) was there any
opportunity to study players’ personal characteristics in an extended training
environment. Interestingly, coaches noted that training situations allowed them to
learn more about the personal characteristics of the player, e.g., ‘If I’m coaching
on a Wednesday night with the district U’14s, their ability level doesn’t really worry
me, but whether or not they listen, participate and give it 100%, does.’
Contexts in Which Selection Occurs
At district, regional and national levels the pathway is centred on competitions and
as such there is the additional pressure on coaches to win within those
13competitions. Competition therefore has an influence on the criteria used to select
players and the process of selection used by coaches. As stated by a district
coach:
As for the team I want to see success, I want to win. If we’re going to
compete in a tournament, then we’ve got to do the best we possibly can
with the players we’ve got. If every player goes out there, gives 100%
and we lose I can live with that, that’s not a problem, but I do want to do
well in the tournaments. (District coach)
At regional level, one coach identified the conflict between combining
competitions and development, suggesting that: ‘The structures of the
competitions don’t necessarily allow that development process to happen as well
as it could.’ However, at national level one coach offered an alternate view and felt
that development and winning can potentially sit alongside one another, whilst still
acknowledging the importance of winning for both the players and the coaches:
We don’t just select the 46 who are going to win every game, we also select
with a view to developing players. But as the competitions and tournaments
progress, winning definitely does become more important. We’ve won three
matches now, and we are keen to continue the momentum that we’ve
created because it builds confidence, it builds team spirit and makes
everything a lot easier for all of us. (National coach)
A fellow coach in the same national squad supported this view by stating
that: ‘The win element is huge in the development. I don’t think they can be
segregated, they’re massively together.’ However, he also acknowledged the
insecurity of his own position and the need to win games: ‘I definitely think, as
coaches, we are well aware of being judged ultimately on performances and
results.’
14The competition-focused nature of the player pathway, therefore, created a
tension for coaches in balancing longer-term player development approaches
against the realities of being in a competition, where the currency of success is
measured by win-loss ratios. Indeed, the results suggest that everything else is
second to the exigencies of winning immediate competitions and that coaches,
particularly at national level, feel they are judged on the win-loss success of their
teams. Such a situation would appear to encourage coaches to compromise their
longer-term aims in favour of short-term wins. Within this context there is an
increased likelihood of the bigger, faster, stronger players being selected ahead of
the longer-term prospect. Selecting the ‘best players at this moment’ appeared to
be an easily defendable position for the coaches, for their players and for the
players’ parents, compared to the alternative of selection based on less tangible
criteria, such as future potential.
DISCUSSION
RAE AND CLUB RUGBY
Findings from the present study demonstrated that RAE was evident in all age
groups of Welsh junior club rugby from U’7 to U’19. The analysis confirmed and
supported the notion that the risk of RAE inequality increased as a player’s birth
date moved away from the September 1st annual cut-off date for each age group.
The results revealed that for every age group (with the exception of U’8’s) both the
Q1 and Q2 born players were over-represented in club teams compared to Q4
born players. In the U’8’s only the Q1 born players were over represented.
These findings are consistent with a number of studies whose focus was
the presence of RAE in age grade teams [37, 15, 17]. Contrary to previous
suggestions by Barnsley and Thompson [13] that older age groups are potentially
more at risk of RAE, the present study found no difference in the risk of RAE
between the younger and older age groups from U’7 to U’19 in the club game.
There was no consistent pattern of increased incidence of RAE across club
registered players during adolescence compared to younger age groups.
15Consistent with the findings of Delorme and Raspaud [38] and of Hancock
et al. [39], RAE was identified in the youngest age groups (U’7 and U’8) of Welsh
rugby where formal competition opportunities are limited. Musch and Grondin [12]
have suggested that lack of formal competition at the youngest age groups should
negate the risk of RAE developing as there is less internal competition for places
within a team. It is particularly surprising in the context of Welsh rugby to find RAE
at such young age groups, as the game played at the U’7 and U’8 age groups is a
non-contact modified version of the game, where the advantages of physical size
are significantly reduced. The suggestion made by Hancock et al. [39] that parents’
make participation choices on behalf of their children and as a result smaller,
younger players might not be offered the opportunity to play rugby, may explain
this finding. This results in RAE patterns being present in even the youngest age
groups.
RAE AND REPRESENTATIVE RUGBY
The present study demonstrated that RAE was evident in all age groups from U’12
to U’16. The findings showed significant differences between the expected relative
age distribution of the club registered players and the observed relative age
distribution frequency of age grade representative players. More substantial,
however, was the finding that RAE increased with each and every performance
level within age grade rugby. RAE at district level increased at regional level and
climbed further at national level. The odds of an U’16 player born in June, July or
August were eleven times less likely to represent Wales at U’16 level compared to
the odds of a player born between September and November in the same selection
year. Till et al. [17] noted a similar pattern in rugby league and suggested that this
emphasized the processes associated with player performance evaluation,
assessment and selection as key causal mechanisms leading to heightened RAE.
The increasing difference between the RAE found at regional and national level
cannot simply be the mimetic expression of the critical mass of registered club
players [11], but must be influenced by other factors related to the process of
moving between levels of performance. The current quantitative findings,
16therefore, adheres to the Cobley et al’s maturation-selection hypothesis that
selection processes contribute to this increased RAE [1]. The qualitative evidence
on coaches’ selection processes also provides further confirmation.
RAE AND COACH SELECTION BEHAVIOUR
The present study offers a level of insight into the processes of selection that
previous studies on RAE have not provided [e.g., 17, 39]. The findings confirm that
the process of selection that occurs in Welsh age grade teams have a number of
characteristics that increase the risk of RAE occurring. Coaches placed a
heightened emphasis on the importance of physical size, which favours the early
born player. This emphasis was more prevalent the higher up the developmental
pathway a player progresses. Coaches’ comments at regional and national level
reflect an increased awareness of the demand on them to identify and develop
bigger, faster and indeed more skilful players. There is a widely held belief that the
professional game demands players of a particular physical size and shape. Such
a view is at odds with current research. Martindale et al. [18] identified this as a
weakness in many current talent development systems that created a bias towards
the bigger, older player. Further, Vaeyens et al. [19] note this uni-dimensional
approach is often adopted in team sports’ talent development models that
concentrate on anthropometric, physical, or physiological measures even though
their value has proven problematic.
Cobley et al. [1] note that numerous studies identify physical differences as
being primarily responsible for RAE. The qualitative analysis findings in the present
study show a propensity in coaches to use physical characteristics as the primary
selection criteria when selecting players to age grade teams. It would appear that
the value placed on size by coaches rather than size itself that drives the trend
towards bigger (older) players. This finding answers the question posed by Helsen
et al. [40] in regard to the criteria used by coaches to discover talent. Helsen et al.
[40] recognized that coaches’ assessment of talent was heavily weighted in terms
of physical maturation, not skill, or team play. Clearly, Welsh coaches’ vision of
talented players might be biased by temporary differences in growth and
17maturation. Selection based around size that is a product of advanced physical
maturation clearly will exclude a proportion of the playing population in Wales [41].
Given the relatively small playing base of Welsh rugby, the long-term implications
could be significant.
In rugby, as in many other sports, winning appears to define a good coach
and remains the currency by which coaches are measured. Coaches with ambition
to progress clearly feel pressure to demonstrate competency through winning. It
must be questioned whether such aspiring coaches are best suited to coach in
talent development programmes; their dependency on short-term successes might
be at odds with the long-term ambitions of the talent development programmes in
which they work.
The desire to win was also identified as a positive trait to develop in players.
Therefore, assisting players to win in pressured competition environments was
viewed as developmental, as it prepared players for those situations in the future.
A fundamental flaw in such thinking is that it assumes that those players currently
involved will go on to become the elite players of the future. Meylan et al. [42] note
that physical advantages afforded as a result of advanced age or maturity during
adolescence are largely transient and are reduced, or reversed in young
adulthood, a trend that has recently been shown in rugby league players [43, 44,
45].
Martindale et al. [18, p354] talk of the ‘systematic consideration of long term
aims and methods, wide ranging coherent messages and support and emphasis
on appropriate development rather than early selection’, as crucial elements in a
successful talent development structures. Whilst Welsh rugby has a well defined
structure and long-term view on its requirements (coaches knew what was required
at the end), there remains a real inconsistency in the coherent wide-ranging
messages and appropriate development required to deliver those requirements.
Comments made by coaches would appear to indicate that decisions on players
are not made as part of a long-term vision, but informed by the experience and ‘gut
feeling’ of individual coaches operating in the moment and in isolation, with an
over-emphasis on winning that encourages them to pick on current performance
18rather than future potential. Meylan et. al. [42] believes that this coach-driven
approach, built on intuitive knowledge of socially constructed images of the perfect
player can lead to repetitive misconceptions in talent evaluation
STUDY LIMITATIONS AND FUTURE DIRECTIONS
The present study had no mechanism to differentiate between active and inactive
player data entries. Whilst the analysis removed duplicate and rogue entries which
were not required in the study (such as female entries), it could not eliminate the
potential for measuring players who have since stopped playing. Also, the principal
researcher’s relationship with the coaches might have influenced the responses
received to questions in the focus groups, as some of the coaches present were
employees working under that researcher. Any potential bias resulting from such
relationship should be considered when considering the outcomes of the focus
group work.
The present study considered all players as one homogeneous group. A
characteristic of rugby is the role differentiation between positions in a team that
demand very different physical, skill and cognitive attributes. Future research on
RAE in Rugby Union should consider the effect that playing position might have
on the presence and magnitude of RAE. Similarly, understanding if a relationship
exists between relative age and a player’s maturational status would add further
support to the assumption that RAE is propagated by advanced physical
characteristics associated to maturational advantage. From a coaching
perspective translating the notion of developing ‘future potential’ from a concept to
a deliverable process remains a challenge for coaches in talent development
pathways.
CONCLUSIONS
The results of the study indicate that in Welsh age group Rugby Union an unequal
distribution of players exists in favour of those born earliest in the selection year.
This pattern of RAE is consistent across all age groups of junior and youth club
rugby. At representative levels, the RAE is magnified beyond levels found in clubs
19to the extent that other factors such as the processes of selection are thought to
impact and increase the risk of RAE. Results from discussions with coaches
identified that the criteria used to select players, allied to the accepted processes
adopted by coaches to make those decisions, are likely to increase the risk of RAE
developing. Further, the context, where players are judged by current performance
measures in an environment where an over emphasis is placed on winning, further
contribute to the risk of RAE occurring.
REFERENCES
1. Cobley, S., Baker, J., Wattie, N. and McKenna, J., Sports Annual Age-
Grouping and Athlete Development, A meta-Analytical Review of Relative
Age Effects, Sports Medicine, 2009, 39(3), 235-256.
2. Welsh Rugby Union WRU Club Audit, 2012.
3.Cobley, S., Abraham, C. and Baker, J., Relative Age Effects on Physical
20Education Attainment and School Sport Representation, Physical Education and
Sport Pedagogy, 2008, 13(3), 267-276.
4. Roberts, S. and Fairclough S., The Influence of Relative Age Effect in the
Assessment of High School Students in Physical Education in the United
Kingdom, Journal of Teaching in Physical Education, 2012, 31, 56-70.
5. Baker, J., Schorer, J., Cobley, S., Bräutigam, H. and Busch, D., Gender,
Depth of Competition and Relative Age Effects In Team Sports, Asian Journal of
Exercise & Sports Science, 2009, 6(1), 7-13.
6. Larouche, R., Laurencelle, L., Grondin, S. and Trudeau, F., Influence of
Birth Quarter on the Rate of Physical Activities and Sports Participation, Journal
of Sports Sciences, 2010, 28(6), 627-631.
7. Philippaerts R.M., Vaeyens, R., Jansseins, M., Van Renterghem, B., Matthys,
D.,Craen, R., Bourgois, J., Varijens, J., Beunen, G. and Malina, R., The
Relationship Between Peak Height Velocity and Physical Performance in Youth
Soccer Players, Journal of Sports Science, 2006, 24(3), 221-230.
8. Edgar S. and O’Donoghue, P., Season of Birth Distribution of Elite Tennis
Players, Journal of Sports Sciences, 2005, 23(10), 1013-1020.
9. Helsen, W.F., Baker, J., Michiels, S., Schorer, J., Van winckel J. and Williams,
A.M., The Relative Age Effect in European Professional Soccer: Did Ten Years
of Research Make Any Difference? Journal of Sports Sciences, 2012, 30(15),
1665-1671.
10. Thompson A.H., Barnsley R.H. and Stebelsky, G., Born to Play Ball: The
Relative Age Effect and Major League Baseball, Sociology of Sport Journal,
1991, 8,146-151.
11. Delorme, N. and Raspaud, M., The Relative Age Effect in Young French
Basketball Players: A Study on the Whole Population, Scandinavian Journal of
Medicine and Sports Science, 2009, 19, 235–242.
12. Musch, J. and Grondin, S., Unequal Competition as an Impediment to
Personal Development: A Review of the Relative Age Effect in Sport.
Developmental Review, 2001, 21, 147–167.
13. Barnsley, R.H. and Thompson A.H., Birthdate and Success in Minor Hockey:
21The key to the NHL, Journal of Behavioural Science Review Canada, 1988,
20(2), 167-176.
14. Deaner, R.O., Lowen, A. and Cobley, S., Born at the Wrong Time: Selection
Bias in the NHL Draft. PLoS ONE, 2013, 8 (2), 1-7.
15. Sherar, L.B., Baxter-Jones, A.D.G., Faulkner, R.A. and Russell, Keith W., Do
Physical Maturity and Birth Date Predict Talent in Male Youth Ice Hockey
Players? Journal of Sports Sciences, 2007, 25(8), 879-886.
16. Delorme, N., Boiché, J. and Raspaud, M., Relative Age and Dropout in
French Male Soccer, Journal of Sports Sciences, 2010b, 28(7), 717-722.
17. Till, K., Cobley, S., Wattie, N. J., O’Hara, J., Cooke, C., and Chapman, C.,
The Prevalence, Influential Factors and Mechanisms of Relative Age Effects in
UK Rugby League. Scandinavian Journal of Medicine and Sports Science, 2010,
20, 320–329.
18. Martindale R., Collins D. and Daubney J. (2005). Talent Development: a
Guide for Practice and Research within Sport. Quest, 2005, 57, 353-375.
19. Vaeyens, R., Lenoir, M., Williams A.M. and Philippaerts R.M., Talent
Identification and Development Programmes in Sport: Current Models and Future
Directions, Sports Medicine, 2008, 38(9), 703-714.
20. Carling, C., le Gall, C.F., Reilly, T. and Williams, A.M., Do Anthropometric
and Fitness Characteristics Vary According to Birthdate Distribution in Elite Youth
Academy Soccer Players? Scandinavian Journal of Medicine and Sport Science,
2009, 19, 3–9.
21. Hirose, N., Relationships Among Birth-Month Distribution, Skeletal Age and
Anthropometric Characteristics in Adolescent Elite Soccer Players, Journal of
Sports Sciences, 2009, 27(11), 1159-1166.
22. OkazakI F. H., Keller, B., Fontana, F.E. and Gallagher J.D., The Relative Age
Effect Among Female Brazilian Youth Volleyball Players, Research Quarterly for
Exercise and Sport Physical Education, Recreation and Dance, 2011, 82 (1),
135–139.
23. Wattie, N., Cobley, S. and Baker, J., Towards a Unified Understanding of
Relative Age Effects, Journal of Sports Sciences, 2008, 26(13), 1403-1409.
2224. Vaeyens, R., Philippaerts, R. M. and Malina, R. M., The Relative Age Effect
in Soccer: A Match-Related Perspective, Journal of Sports Sciences, 2005,
23(7), 747- 756.
25. Teddlie, C. and Tashakkori, A., Foundations of Mixed Methods Research,
Sage Publications, California, 2009.
26. Creswell, J.W. and Plano-Clarke V., Designing and Conducting Mixed
Methods Research, Sage Publications, California, 2011.
27. Baker, J. and Logan, A.J., Developmental Contexts and Sporting Success:
Birth Date and Birthplace Effects in National Hockey League Draftees 2000–
2005, British Journal of Sports Medicine, 2007, 41, 515–517.
28. Delorme, N., Boiché, J. and Raspaud, M., Relative Age Effect in Elite Sports:
Methodological Bias or Real Discrimination? European Journal of Sport Science,
2010, 10(2), 91-96.
29. Marshall, M.N., Sampling for Qualitative Research, Family Practice, 1996,
13(6), 522-525.
30. Krueger, R.A. and Casey M.A. Focus Groups. A Practical Guide for
Applied Research, Sage, California, 2009.
31. Macnaghten, G. and Myers, G., in: Seale, C., Gobo G., Gubrium J. F., and
Silverman, D. (eds.), Focus Groups. Sage, 2007, 65-67.
32. Bloor, M., Frankland, J., Thomas, M. and Robson, K., Focus Groups in Social
Research. Sage. London, 2001.
33. Holstein, J.A., and Gubrium, J.F., The Active Interview, CA: Sage:Thousand
Oaks, 1995.
34. Morgan, D.L., Fellows, C. and Guevara, H. (2008). Emergent Approaches to
Focus Group Research, in: Hesse-Biber S. N., and Leavy, P.(eds.), Handbook of
Emergent Methods, New York, Guilford Press, 2008, 189-207.
35. Guba, E. G. and Lincoln, Y. S., Effective Evaluation: Improving the
Usefulness of Evaluation results through Responsive and Naturalistic
Approaches, San Francisco, CA: Jossey-Bass, 1981.
36. Padgett, D.K., Qualitative Research Methods in Social Work Research,
Sage, California, 1998.
2337. Glamser F.D. and Vincent J., The Relative Age Effect Among Elite American
Youth Soccer Players, Journal of Sports Behaviour, 2004, 27(1), 120-128.
38. Delorme, N., Boiché, J. and Raspaud, M., The Relative Age Effect in Elite
Sport: The French Case, Research Quarterly for Exercise and Sport, 2009,
80(2), 336–344.
39. Hancock D.J., Ste-Marie, D.M. and Young B.W., Coach Selections and the
Relative Age Effect in Male Youth Ice Hockey. Research Quarterly for Exercise
and Sport, 2013, 84(1), 126-130.
40. Helsen, W.F., Hodges, N.J., Van Winkel, J. and Starkes, J.L.,The Roles of
Talent, Physical Precocity and Practice in the Development of Soccer Expertise,
Journal of Sports Sciences, 2000, 18, 727-736.
41. Gray H.J. and Plucker J.A., ‘She’s a Natural’: Identifying and Developing
Athletic Talent, Journal for the Education of the Gifted, 2010, 33 (3), 361–380.
42. Meylan, C., Cronin, J., Oliver, J. and Hughes M., Talent Identification in
Soccer: The Role of Maturity Status on Physical, Physiological and Technical
Characteristics, International Journal of Sports Science and Coaching, 2010,
5(4), 571-592.
43. Till, K., Cobley, S., O' Hara, J., Chapman, C. and Cooke, C., A
Longitudinal Evaluation of Anthropometric and Fitness Characteristics in Junior
Rugby League Players Considering Playing Position and Selection Level, Journal
of science and medicine in sport / Sports Medicine Australia, 2013, 16, 438-443.
44. Till, K., Cobley, S., O' Hara, J., Cooke, C. and Chapman, C., Considering
Maturation Status and Relative Age in the Longitudinal Evaluation of Junior
Rugby League Players, Scandinavian Journal of Medicine and Science in Sports,
2014, 24, 569-576.
45. Cobley, S., Hanratty, M., O’Connor, D. and Cotton, W., First Club Location
and Relative Age as Influences on Being a Professional Australian Rugby
League Player, International Journal of Sports Science and Coaching, 2014, 9,
335–346.
24Table 1: Characteristics of the Samples Analysed as Part of the Quantitative
Phase of the Study
Total Mean ± SD
Playing group sample n Q1n Q2n Q3n Q4n age (yrs)
Registered club 32485 9410 8361 7604 7110 12.4 ± 2.2
players
25Tier 1 competition 2022 728 566 437 291 14.3 ± 0.3
(district)
Tier 2 competition 238 97 73 35 33 15.7 ± 0.3
(regional)
Tier 3 competition 91 45 28 10 8 15.7 ± 0.3
(national)
Total 34788 10255 8904 8081 7438
Key: Q1 = Quartile 1, Q2 = Quartile 2, Q3 = Quartile 3 and Q4 = Quartile
26Table 2: Relative Age Distributions of Welsh Age Group Club and Representative Team Rugby Union Players
Q1 Q2 Q3 Q4 Grand χ2 OR 95% CI
Team total (df = 3) P-value (Q1 vs Q4) (Q1 vs Q4)
total % total % total % total %
Club U’7 434 32.0 341 25.1 315 23.2 268 19.7 1358 49.3 0.001 1.91 1.61 to 2.26
Club U’8 607 27.7 525 24.0 511 23.3 546 24.9 2189 9.9 0.050 1.16 1.01 to 1.32
Club U’9 736 32.3 645 28.3 307 13.5 591 25.9 2279 187.3 0.001 1.36 1.21 to 1.54
Club U’10 761 26.0 747 25.6 731 25.0 683 23.4 2922 12.0 0.010 1.15 1.03 to 1.30
Club U’11 853 28.8 748 25.3 689 23.3 671 22.7 2961 35.4 0.001 1.38 1.23 to 1.55
Club U’12 909 27.6 864 26.2 826 25.1 695 21.1 3294 46.1 0.001 1.43 1.28 to 1.59
Club U’13 891 27.1 826 25.2 834 25.4 731 22.3 3282 25.7 0.001 1.30 1.17 to 1.45
Club U’14 899 27.7 819 25.2 817 25.2 712 21.9 3247 32.1 0.001 1.36 1.22 to 1.52
Club U’15 954 30.3 827 26.3 754 23.9 615 19.5 3150 94.1 0.001 1.79 1.60 to 2.00
Club U’16 936 31.4 772 25.9 672 22.6 598 20.1 2978 101.0 0.001 1.82 1.63 to 2.05
Club U’17 436 29.8 379 25.9 355 24.2 294 20.1 1464 35.6 0.001 1.69 1.43 to 1.99
Club U’18 495 30.1 430 26.1 358 21.7 364 22.1 1647 36.5 0.001 1.52 1.30 to 1.76
Club U’19 499 29.1 438 25.6 435 25.4 342 20.0 1714 37.5 0.001 1.65 1.41 to 1.92
Club players 9410 29.0 8361 25.7 7604 23.4 7110 21.9 32485 489.7 0.001 1.45 1.41 to 1.51
combinedTable 2 cont.: Relative Age Distributions of Welsh Age Group Club and Representative Team Rugby Union
Players
Q1 Q2 Q3 Q4 Grand χ2 OR 95% CI
Team total (df = 3) P-value (Q1 vs Q4) (Q1 vs Q4)
total % total % total % total %
Dist U’12 190 36.1 153 29.0 114 21.6 70 13.3 527 66.49 0.001 3.68 2.73 to 4.97
Dist U’13 118 27.7 128 30.0 110 25.8 70 16.4 426 22.85 0.001 1.95 1.41 to 2.70
Dist U’14 188 41.4 122 26.9 92 20.3 52 11.5 454 91.48 0.001 5.46 3.91 to 7.63
Dist U’15 176 37.3 129 27.3 96 20.3 71 15.0 472 56.59 0.001 3.36 2.48 to 4.55
Dist U’16 56 39.2 34 23.8 25 17.5 28 19.6 143 16.97 0.001 2.64 1.59 to 4.40
District players
combined 728 29.0 566 25.7 437 23.0 291 21.9 2022 93.25 0.001 3.35 2.88 to 3.88
RAG U’16* 16 34.0 11 23.4 13 27.7 7 14.9 47 3.91 0.050 2.95 1.11 to 7.83
RAG U’16** 81 42.4 62 32.5 22 11.5 26 13.6 191 54.01 0.001 4.67 2.88 to 7.59
NAG U’16* 20 46.5 14 32.6 5 11.6 4 9.3 43 16.96 0.001 8.48 2.68 to 26.88
NAG U’16** 25 52.1 14 29.2 5 10.4 4 8.3 48 24.46 0.001 11.96 3.87 to 36.97
Key: Q1 – Q4 = quartiles 1 – 4, χ2 = chi-square value, df = degrees of freedom for χ2, P-value = level of statistical significance
for χ2, OR = odds ratio for Q1 vs Q4, 95% CI = 95% confidence interval for OR, Dist = district level players, RAG = regional
age grade, NAG = national age grade, * = 1995/1996 year group, ** = 1996/1997 year group
28Figure 1: Playing Pathway and Performance Levels in Welsh Age Group Rugby Union
35.0

 30.0

 25.0

 20.0

 15.0

 10.0

  5.0

  0.0
            Quarter 1    Quarter 2        Quarter 3   Quarter 4
                            All club    Expected

Figure 2:      Comparison of Expected Verses Observed Relative Age
Distributions in Club Registered Players

                                       30
60.0
50.0
40.0
Quarter 1
30.0 Quarter 2
Quarter 3
Quarter 4
20.0
10.0
0.0
All club District RAG NAG
Figure 3: Relative Age Distributions by Level of Performance
Key: RAG = regional age grade, NAG = national age grade
31Figure 4: Thematic Analysis of Focus Group Transcripts
32You can also read