Report on Epidemiological Mapping of Schistosomiasis and Soil Transmitted Helminthiasis in 19 States and the FCT, Nigeria.
←
→
Page content transcription
If your browser does not render page correctly, please read the page content below
Report on Epidemiological Mapping of Schistosomiasis and
 Soil Transmitted Helminthiasis in 19 States and the FCT,
                         Nigeria.

                         May, 2015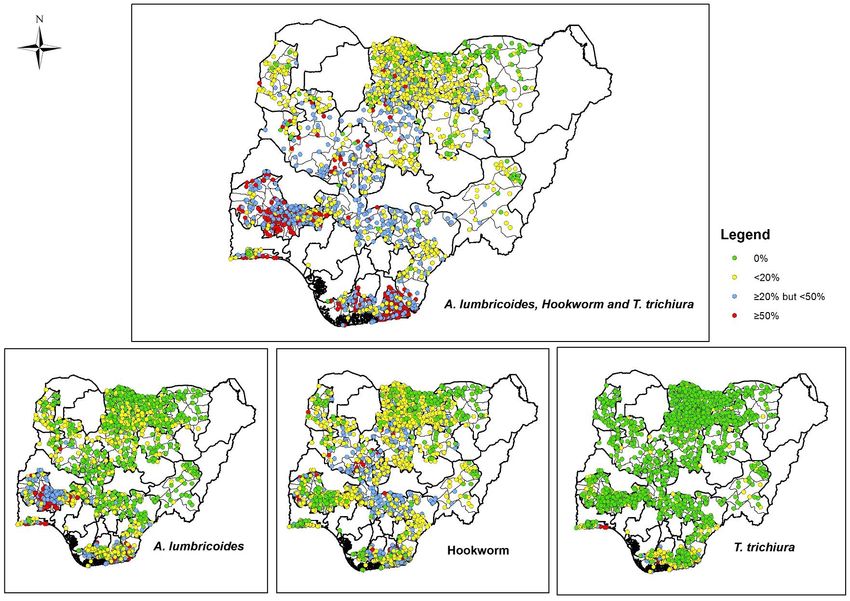
Report on Epidemiological Mapping of Schistosomiasis and
 Soil Transmitted Helminthiasis in 19 States and the FCT,
                         Nigeria.

                            ii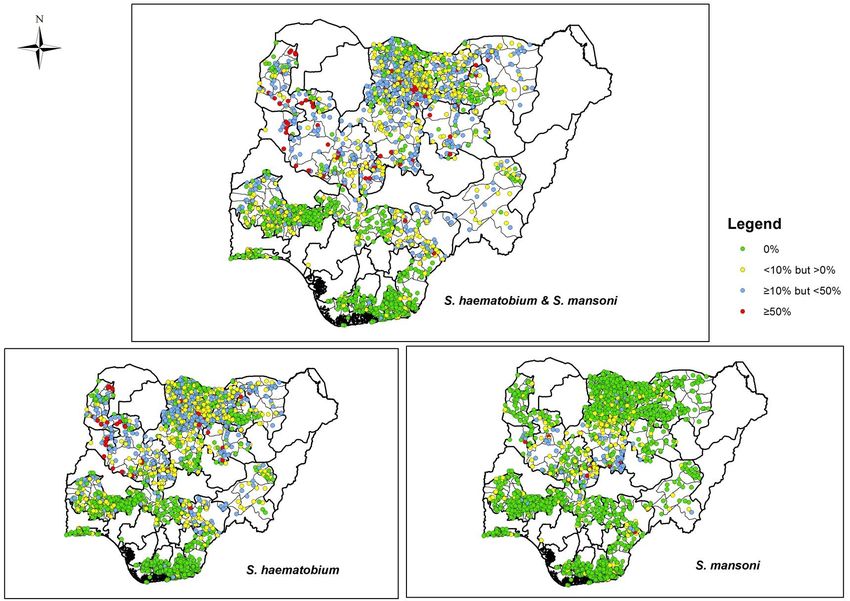
TABLE OF CONTENTS
LIST OF FIGURES ...................................................................................................................................... v

LIST OF PLATES ...................................................................................................................................... vii

FOREWORD.............................................................................................................................................. x

EXECUTIVE SUMMARY........................................................................................................................... xii

1.0 BACKGROUND ................................................................................................................................... 1

   1.1 Introduction ................................................................................................................................... 1

   1.2 Objectives of the Mapping Project ................................................................................................ 2

   1.3 Justification for the Survey ............................................................................................................ 2

2.0. MAPPING METHODOLOGY ............................................................................................................... 3

   2.1 Study Area ..................................................................................................................................... 3

   2.2. Study Design ................................................................................................................................. 4

  2.2.1 Selection of Participating Schools and Children .......................................................................... 4

   2.3 School and Community Mobilization and Sensitization ................................................................ 5

   2.4 Training of Personnel..................................................................................................................... 5

   2.5 Field Data Collection Process and Uploading into Cloud Server ................................................... 8

   2.6 Sample Collection and Examination .............................................................................................. 9

   2.7 Data Analyses .............................................................................................................................. 10

   2.8 Ethical Clearance ......................................................................................................................... 11

3.0 RESULTS ........................................................................................................................................... 12

   3.1 Demographic data ....................................................................................................................... 12

   3.2 Parasitological Findings ............................................................................................................... 12

  3.1.1 Schistosomiasis Result ............................................................................................................... 16

  3.1.2 Soil Transmitted Helminths (STHs) Results ................................................................................ 19

  3.1.3 Prevalence of schistosomiasis and STH by Sex .......................................................................... 22

  3.1.4 Prevalence of schistosomiasis and STH by Age group ............................................................... 24

  3.1.5 Intensity of Infection .................................................................................................................. 26

   3.2 Implication of Findings on Intervention ...................................................................................... 27

   3.3 Defeacation practices and water contact activities .................................................................... 31
                                                                           iii
4.0 DISCUSSIONS ................................................................................................................................... 33

   4.1 Discussion of Results ................................................................................................................... 33

   4.2 Implications of Findings ............................................................................................................... 35

   4.3 Some Key Achievements of the Project ...................................................................................... 36

5.0. CHALLENGES/CONSTRAINTS .......................................................................................................... 37

   5.1 Logistics ....................................................................................................................................... 37

   5.2 Mobilisation/Misconception ....................................................................................................... 37

   5.3 Communication/Technology Challenges ..................................................................................... 37

   5.4 Access challenges to schools in some LGAs ................................................................................ 37

   5.5 Security Challenges...................................................................................................................... 38

6.0. RECOMMENDATIONS ..................................................................................................................... 39

REFERENCES .......................................................................................................................................... 41

APPENDIX .............................................................................................................................................. 43

   Appendix 1: Coordinated Mapping of Schistosomiasis & STH in Nigeria: Project Organogram ....... 43

   Appendix 2: Survey Teams ................................................................................................................ 44

   Appendix 3: Data collection tools...................................................................................................... 49

   Appendix 4: Flow Diagram of the Android Based Electronic Data Management ............................. 58

   Appendix 5: Ethical Clearance ........................................................................................................... 59

   Appendix 6: Treatment guideline for schistosomiasis/STH............................................................... 60

   Appendix 7: LGAs Requiring Interventions ........................................................................................ 61

   Appendix 8: Schistosomiasis and STHs Prevalence by Practice of Defecation .................................. 72

   Appendix 9: Prevalence of Schistosomiasis and STHs by water contact activities ........................... 75

                                                                           iv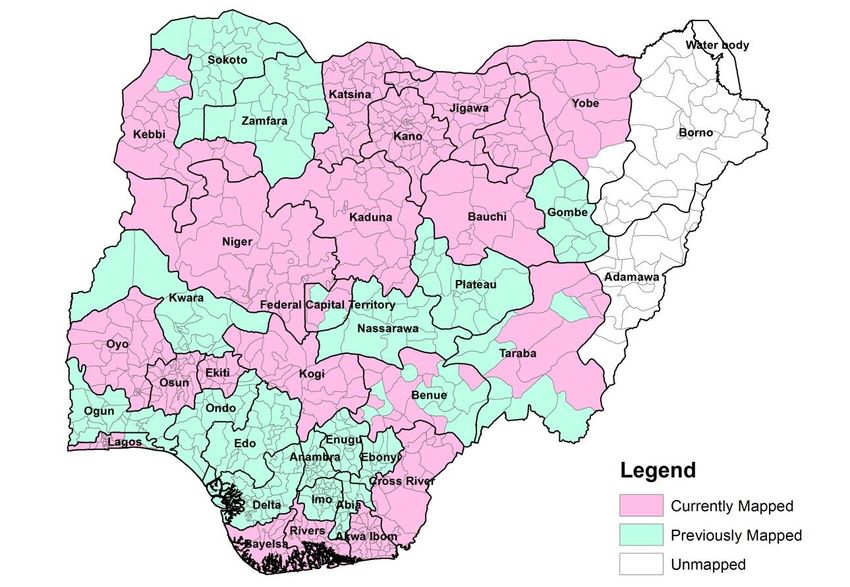
LIST OF TABLES
Table 1: Categories of Personnel Trained for the Survey ........................................................................ 6

Table 2: Demographic Characteristics of the Study Population ............................................................ 12

Table 3: Prevalence of Schistosomiasis, Soil Transmitted Helminths and Co-Infection........................ 13

Table 4: Range of Schistosomiasis and STHs Prevalence by State ........................................................ 15

Table 5: Parasite intensity in eggs per gram (epg) of faeces or per 10 ml of urine .............................. 27

Table 6: LGAs requiring Intervention for Schistosomiasis ..................................................................... 28

Table 7: LGAs requiring Intervention for Soil Transmitted Helminths (STHs) ....................................... 30

Table 8: Prevalence of schistosomiasis and STHs in relation to places of defeacation. ....................... 31

Table 9: Prevalence of Schistosomiasis in relation to water contact activities ..................................... 32

LIST OF FIGURES
Figure 1: Map of Nigeria showing study area.......................................................................................... 3

Figure 2: Map of Nigeria showing the study area and funding partners ................................................ 4

Figure 3: Schistosomiasis and STHs endemic areas ............................................................................... 14

Figure 4: Prevalence of Schistosomiasis by LGA .................................................................................... 15

Figure 5: Prevalence of STHs by LGA ..................................................................................................... 16

Figure 6: Proportion of S. haematobium and S. mansoni in the study area .......................................... 16

Figure 7: Prevalence of S. haematobium and S.mansoni by State...................................................... 17

Figure 8: Schistosomiasis Point Prevalence maps ................................................................................. 18

Figure 9: Proportion of the three species of STHs in the Study Area ..................................................... 19

Figure 10: Prevalence of A. lumbricoides, Hookworm and T. trichiura ................................................. 20

Figure 11: STHs Point Prevalence maps ................................................................................................. 21

Figure 12: Proportion of pupils infected with Schistosomiasis by sex ................................................... 22

Figure 13: Prevalence of Schistosomiasis by sex ................................................................................... 22

Figure 14: Proportion of Pupils infected with STHs by sex..................................................................... 23

Figure 15: Prevalence of STHs by sex ..................................................................................................... 23

Figure 16: Proportion of schistosomiasis infected pupils by age group ................................................ 24

Figure 17: Prevalence of schistosomiasis by age group ........................................................................ 25

Figure 18: Proportion of STHs infected pupils by age group ................................................................. 25
                                                   v
Figure 19: Prevalence of STHs infected pupils by age group ................................................................. 26

Figure 20: Intervention planning map for Schistosomiasis in 19 States and FCT. ................................. 29

Figure 21: Intervention planning map for STHs in 19 States and the FCT ............................................. 31

                                                              vi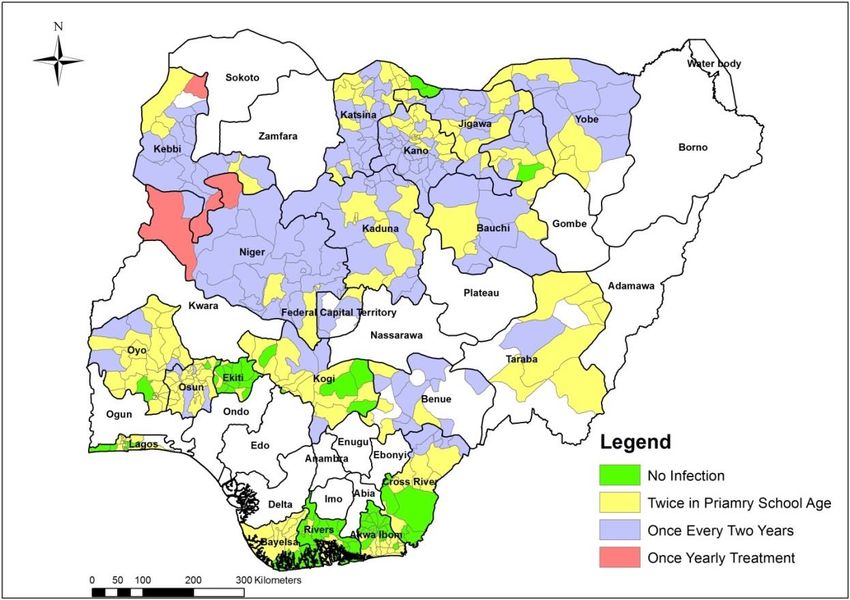
LIST OF PLATES
Plates 1a & 1b: A cross section of school pupils being selected for sample collection .......................... 5

Plate 2a: Advocacy visit to Education Secretary.                                             Plate 2b: Advocacy visit to the
Hon. Commissioner for Health................................................................................................................. 5

Plate 3: Participants and Facilitators for the Quantum GIS training at Abuja ........................................ 7

Plate 4: Laboratory training session. ....................................................................................................... 7

Plate 5: State survey team ....................................................................................................................... 8

Plate 6: A Recorder inputting student’s information to the android phone ........................................... 9

Plate 7: Water contact behavioural activities ......................................................................................... 9

Plate 8: Technicians Preparing Kato-Katz in the laboratory. ................................................................. 10

Plate 9: Technicians conducting urinalysis in the laboratory. .............................................................. 10

                                                                        vii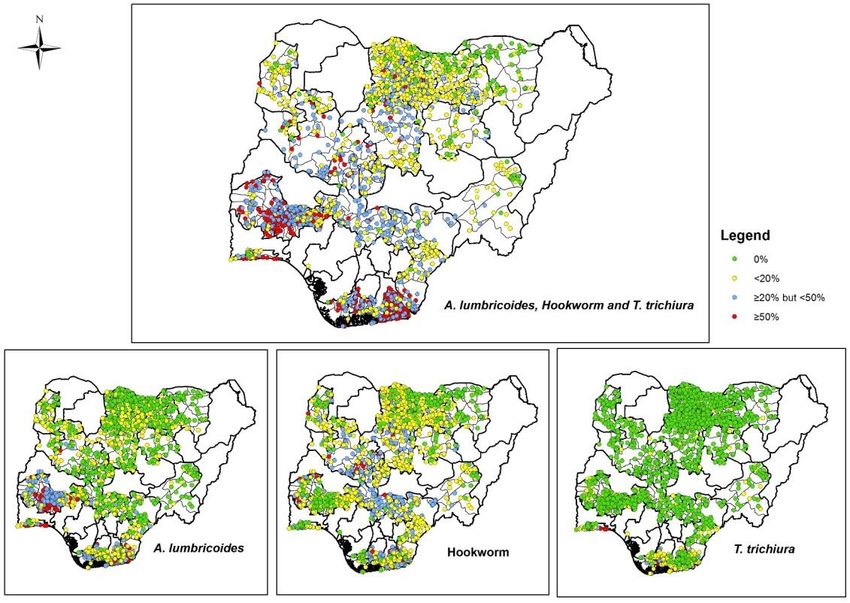
ACRONYMS
CDC                       Centers for Disease Control and Prevention

CIFF                      Children's Investment Fund Foundation

DFID                      Department for International Development

FCT                       Federal Capital Territory

FMOH       ital TerrFed   Federal Ministry of Health

GTMP                      Global Trachoma Mapping Project

HANDS                     Health and Development Support

HKI                       Helen Keller International

IBM                       International Business Machine

LGA                       Local Government Area

LSHTM                     London School of Hygiene and Tropical Medicine

MAM                       Mass Administration of Medicines

MITOSATH                  Mission to Save the Helpless

NBS                       National Bureau of Statistics
NGDOs                     Non-Governmental Development Organizations

NHMIS                     National Health Management Information System

NHREC                     National Health Research Ethical Committee
NPC                       National Population Commission
NTDs                      Neglected Tropical Diseases

PAG                       Project Advisory Group

PCT                       Preventive Chemotherapy

PHASE                     Preventive chemotherapy, Access to clean water, Sanitation
                          improvement and environmental manipulation
QGIS                      Quantum Geographic Information System

SCI                       Schistosomiasis Control Initiative

SDGs                      Sustainable Development Goals

SMOH                      State Ministry of Health

SPSS                      Statistical Package for Social Science

STHs                      Soil Transmitted Helminths

                                              viii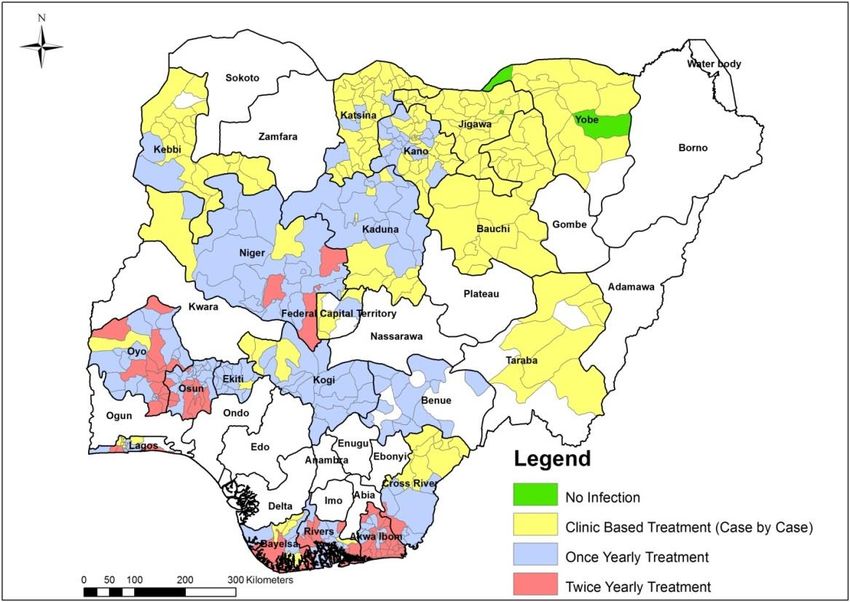
SUBEB   State Universal Basic Education Board

TCC     The Carter Center

TFGH    Task Force for Global Health

UK      United Kingdom

WASH    Water, Sanitation and Hygiene

WHO     World Health Organization

                            ix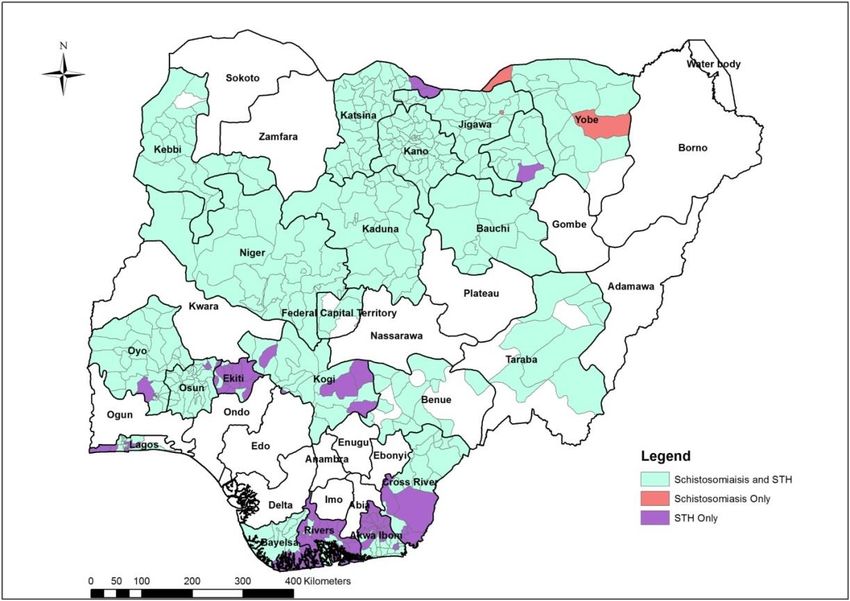
FOREWORD
Schistosomiasis and Soil Transmitted Helminths (STHs) are among the group of Neglected Tropical
Diseases (NTDs) that cause chronic infections and ill health in endemic areas. Nigeria is one of the
countries that have the highest burden of these NTDs. In the last two years, Nigeria has scaled-up
epidemiological mapping for NTDs with the support of partners and stakeholders. There are further
plans to scale up Preventive Chemotherapy, Health Education, Access to clean water, Sanitation
improvement and Environmental manipulation (PHASE) activities to reduce disease burden.

This report provides epidemiological information on 19 States and the Federal Capital Territory (FCT)
that were mapped for schistosomiasis and STHs from November 2013 to May 2015. The Children’s
Investment Fund Foundation (CIFF) provided funding to map 14 States and the remaining States were
supported by Department for International Development (DFID) funded Global Trachoma Mapping
Project (GTMP), RTI/ENVISION project and Sightsavers. Findings from the survey showed that all 19
States and the FCT are endemic for schistosomiasis or STHs and in some cases both. This provides vital
evidence for improved strategic planning for schistosomiasis and STHs integrated disease control and
elimination in Nigeria.

One of the key innovations of this project was transition from use of paper–based questionnaires to
electronic data collection tools, the Android–based smart phones and cloud server platform. The
electronic-based mapping project provided opportunity for enhanced data collection, timely
transmission and reporting as well as data security. The completion of the Schistosomiasis and STHs
epidemiological mapping in 19 States and the FCT is an important milestone in the fight against NTDs
and has given Nigeria a pride of place in the global NTDs elimination landscape.

I wish to convey the nation's appreciation to the funding organizations and other stakeholders that
have worked tirelessly to achieve this feat. I would also like to remind everyone that this is a giant
stride in our collective and collaborative effort towards meeting the national and global NTDs
elimination goals. The findings from this project provide evidence-based data for decision making in
order to appropriately target interventions. It is expected that our children at risk will benefit
immensely from this for a brighter future.

I wish to reaffirm the commitment of the Federal Government of Nigeria to the elimination of NTDs in
Nigeria and in particular schistosomiasis and STHs.

                                                  x
ACKNOWLEDGEMENTS
The Federal Ministry of Health sincerely acknowledges the immense support and contributions of our
NGDO partners especially Sightsavers, HANDS, HKI, TCC and MITOSATH towards the control and
elimination of Schistosomiasis and STHs in Nigeria.
Special appreciation goes to the Children’s Investment Fund Foundation (CIFF) and partners;
Sightsavers, RTI/ENVISION and DFID for their tremendous financial and technical support and
humanitarian gesture to conduct the Schistosomiasis and STHs epidemiological mapping in 19 States
and the FCT.
We also thank the Project Advisory Group (PAG) and Schistosomiasis Control Initiative (SCI), UK for
their advice and useful insight towards the development of the mapping protocol and survey tools.
The Honourable Commissioners for Health in the States and the FCT Secretary for Health are
appreciated for their collaboration and support during the mapping activities. We also recognize the
effort and contributions of the consultants, technical officers from the Federal and State Ministries of
Health and other support personnel at all levels of operation. The management and staff of the 19
States and FCT, State Universal Basic Education Board (SUBEB), the LGAs, participating schools and
members of the surveyed communities are most appreciated for their support and cooperation
throughout the duration of the exercise.
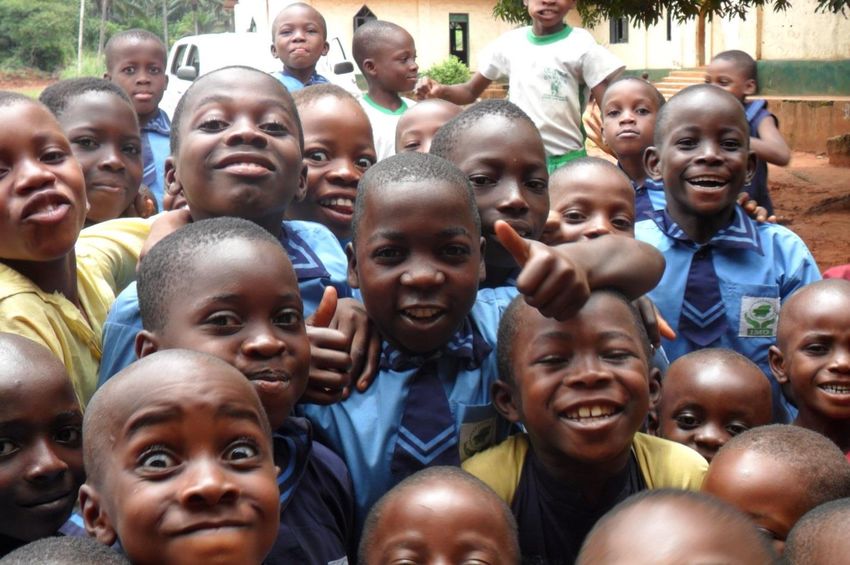
Our immense thanks go to the school children for their cooperation and enthusiastic participation in
the mapping activities.
xiEXECUTIVE SUMMARY
Epidemiological mapping is a prerequisite for Neglected Tropical Diseases (NTDs) Preventive
chemotherapy, Access to clean water, Sanitation improvement and Environmental manipulation
(PHASE) interventions.
The Children’s Investment Fund Foundation (CIFF) as part of its investment in Nigeria provided funding
to map schistosomiasis and Soil Transmitted Helminths (STHs) in 347 LGAs in 14 States. This support
provided leverage for additional funding to map 86 LGAs in five other States and the Federal Capital
Territory (FCT). The coordinated mapping of schistosomiasis and STHs was conducted in 19 States and
the FCT of Nigeria from November 2013 to May 2015.
A sample of 50 - 55 children from five randomly selected schools in each of the 433 LGAs in 19 States
and four Area Councils of the FCT were examined for schistosomiasis and STHs with generous funding
support from CIFF, Sightsavers, Department for International Development (DFID) funded Global
Trachoma Mapping Project (GTMP) and the RTI/ENVISION project.
Epidemiological data on both diseases were mapped using a novel technique; the LINKS system
developed by the Task Force for Global Health (TFGH). This system uses a collection of open source
tools for data collection on Android devices and cloud based data reporting and management. The
application of these devices supported the transition from paper-based questionnaires to electronic
data collection tools. Also, Water, Sanitation and Hygiene (WASH) information for schools and school
children were collected. The Kato-Katz technique, dipsticks (Haemastix), syringe filtration and
sedimentation techniques were used to examine stool and urine samples collected from the school
children.
The result of this survey revealed that all the States and the FCT were endemic for one or both diseases
with an overall prevalence of 9.5% for schistosomiasis and 27% for STHs suggesting low risks of both
diseases in the project area. However, the data captured by LGA; the intervention unit showed that
prevalence of infections varied from low to high risk. Of the 433 LGAs surveyed the number of LGAs
requiring interventions for schistosomiasis and STHs were 359 and 237 respectively. The prevalence
of infection was significantly higher in males than in females for both diseases. STHs were more
prevalent among the younger age group (5-10years) while schistosomiasis was more prevalent among
the older age group (11-16 years). Two percent of the pupils surveyed were co-infected with
schistosomes and STHs.
Schistosomiasis and STHs were seen among pupils who claimed to defeacate in the school toilets,
around the school compound and outside school environment. The mapping exercise provided insight
into disease distribution and intensity in the 19 States and FCT surveyed.
xiiAt the end of the exercise, the capacities of the national and state government personnel have been
strengthened in implementing and evaluating planned NTD control activities effectively. Working with
the various partners has provided a platform for cross learning, skills sharing and ultimately improved
programme coordination.
There were several engagements with the Honorable Commissioners for Health and other
stakeholders to advocate for support to the project, present the findings and need for rapid public
health action. At the community level awareness on the prevalence of schistosomiasis and STHs were
raised to secure their participation.
The mapping of schistosomiasis and STHs in 19 States and the Federal Capital Territory of Nigeria was
successfully completed and has achieved all the set objectives. Data generated from this crucial survey
provided vital evidence for appropriate and sustainable intervention by Government in collaboration
with our highly esteemed NTDs partners. It is the right of every child in Nigeria to enjoy good health
and the time to intervene is now.
It is recommended that Governments (Federal, State and LGAs) and stakeholders scale up
uninterrupted provision and administration of appropriate medicines which should be implemented
alongside other interventions in the PHASE strategy. Plans should be put in place for impact
assessment after the third year of consistent Mass Administration of Medicines (MAM).
xiii1.0 BACKGROUND
1.1 Introduction
Schistosomiasis and Soil Transmitted Helminths (STHs) are Neglected Tropical Diseases (NTD) that
cause ill-health and chronic infections in endemic countries, including Nigeria. The country is estimated
to have the highest number of people infected with NTDs in Africa; a group of parasitic and bacterial
infections that affect the world's poorest populations (WHO 2015; Hotez and Kamath 2009). Nigeria
has the highest burden of endemicity of intestinal helminth infections and cases of schistosomiasis.
The latter includes intestinal schistosomiasis caused by Schistosoma mansoni and urogenital
schistosomiasis caused by Schistosoma haematobium (WHO 2015; Hotez and Kamath 2009). These
parasites are known to have detrimental impact on child health as they deplete nutrients in children
and adversely affect physical and cognitive development, causing symptoms such as abdominal pain,
anaemia, bladder and liver diseases and other health problems which impair growth, reduce school
attendance with poor learning outcomes (Lobato et al., 2012).
The exact national distribution and disease burden of schistosomiasis and STHs was largely unknown
before the current scale up of epidemiological mapping activities in Nigeria. The national data available
were from limited number of epidemiological surveys conducted between 2008 and 2012, among
school age children in 207 of the 774 LGAs. Although mapping had not been conducted in all 36 States
and the FCT, schistosomiasis and STHs were suspected to be co-endemic in majority of the States.
As part of the ongoing effort to scale up epidemiological mapping activities in Nigeria, the Federal
Ministry of Health (FMOH), in collaboration with various partners and stakeholders launched several
disease mapping projects nationwide (Appendix 1). Within this effort CIFF provided Eight hundred and
eighty nine thousand, five hundred and sixty three pounds sterling (£889,563.00) to map
schistosomiasis and STHs in 347 LGAs in 14 States. This support enabled FMOH to standardise a
training manual for schistosomiasis and STHs mapping that eased data collection and management.
This also led to the development of national mapping protocol and data collection platform used by
other donors to support the field data collection. The national protocol was used as a standard and
reference document during training of the field personnel and throughout the mapping process. The
technical support from Schistosomiasis Control Initiative (SCI) provided further guidance and insight
into the design and development of these mapping tools. Other partners leveraged on the support
provided by CIFF to map other States. The DFID-funded GTMP mapped Bauchi, Niger and Taraba
States; RTI/ENVISION mapped Cross River and Ondo States while Sightsavers mapped Benue State.
Technical officers from FMOH, in-country consultants and NGDO partners were trained on the use of
1Geographic Information System (GIS). The skills acquired were used to capture, store, analyse and
manage spatial data and also to develop disease and intervention maps.
1.2 Objectives of the Mapping Project
i. To complete epidemiological mapping of schistosomiasis and STHs in the 347 LGAs in 14 States
of Nigeria over an 18 month period
ii. To provide the necessary evidence of disease burden to be used for advocacy to leverage
government funding and inform the broader NTD community beyond Nigeria
iii. To develop the capacity of government personnel on epidemiological mapping for
schistosomiasis and STHs, and ensure commitment to implement a national deworming
programme
1.3 Justification for the Survey
Schistosomiasis and STHs remain a serious public health problem in Nigeria. Assessment of disease
prevalence and the geographic distribution are the first steps in planning effective intervention
measures for schistosomiasis and STHs.
The completion of epidemiological mapping equally presented a unique opportunity to collect for the
first time, a more comprehensive data on the national disease distribution. Specific national
information on the prevalence, distribution and disease burden resulting from these NTDs provided a
basis for prioritizing control programme strategies in line with the national NTDs Master Plan and the
Global Elimination target. The findings of the survey are a useful advocacy tool for leveraging
Government resources and accessing global donated NTD medicines. Comprehensive up-to-date maps
showing the diseases distribution will facilitate efficient resource utilization and appropriate drugs
distribution to target populations.
The benefits of control and elimination of these diseases include reduction of school absenteeism,
malnutrition and anaemia leading to improvement of growth, physical and intellectual development
and attainment of full potentials by children in Nigeria. It will also contribute to poverty reduction and
improved socio-economic wellbeing of families. Giving the strong association between helminthic,
other NTDs, economic and human development, it has become essential to give due consideration to
eliminating helminths infection as a means to achieve the Sustainable Development Goals (SDGs) in
Nigeria (Hotez and Herricks 2015).
22.0. MAPPING METHODOLOGY
2.1 Study Area
Nigeria is the most populous country in Africa with a projected population of over 170 million, National
Population Commission (NPC 2006). Nigeria occupies the area along the West Coast of Africa between
latitude 40 and 140 N and longitude 50 and 140 E covering about 923,768 square kilometres and
bordered in the North by the Republics of Niger and Chad and in the East by Cameroon while Benin
Republic borders it on the West and Atlantic Ocean to the south. Nigeria has a coast line of about 3,122
kilometres. The capital city Abuja is located within the Federal Capital Territory, which is about 713
square kilometres. There are 36 States and the FCT with 774 Local Government Areas (LGAs) in the
Federation.
The study area comprised 19 States and the FCT as shown in Figure 1. Altogether the 19 States and
the FCT have 456 LGAs and an estimated population of 106,243,198 projected 2006 population (NPC
2006). The survey was conducted in 433 out of the 456 LGAs, 21 were previously mapped and two
were not mapped due to security challenges. The Children’s Investment Fund Foundation and other
partners provided funding support for mapping activities in different States (Figure 2).
Figure 1: Map of Nigeria showing study area
3Figure 2: Map of Nigeria showing the study area and funding partners
2.2. Study Design
State-wide mapping for schistosomiasis and STHs infections was conducted in a coordinated manner
using National protocol based on WHO (2010) framework. The survey was cross sectional and
purposive at State and LGA levels aimed at completing epidemiological mapping in Nigeria. There was
a randomised selection of schools from the sampling frame followed by a randomised systematic
selection of children in the schools surveyed. The sampling frame was the list of all primary schools in
each ward. A stratified random cluster sampling procedure was used in line with the FMOH protocol
on integrated epidemiological mapping and baseline survey for schistosomiasis and STHs (FMOH
2013). Primary schools in northern Nigeria included non-formal schools (“Madrasat”/Islamic Schools).
The survey was based on standard diagnostic procedures for collection and examination of urine and
faecal samples from school age children for the presence of schistosome and intestinal helminth eggs.
Enrolled school age children were targeted from the surveyed communities. Males and females were
selected on pro rata basis.
2.2.1 Selection of Participating Schools and Children
In all the LGAs of the States surveyed, five schools were randomly selected from different
communities; however, schools in areas with large water bodies were prioritised. A sampling frame
4was developed and used for selection of pupils in each selected school. A range of 50-55 pupils of both
sexes from 5 – 16 years old from each school was sampled (Plates 1a & 1b).
Plates 1a & 1b: A cross section of school pupils being selected for sample collection
2.3 School and Community Mobilization and Sensitization
Advocacy visits were paid to the Honourable Commissioners for Health and this was preceded by
letters from the FMOH. The State Universal Basic Education Board (SUBEB) personnel mobilised the
schools. Letters were also sent from the States Ministry of Health through SUBEB to selected schools
and communities. Some States also mobilised the communities through the mass media, including
radio and television. Education secretaries, community health educators and districts heads in some
communities were also sensitized (Plates 2a & 2b).
Plate 2a: Advocacy visit to Education Secretary. Plate 2b: Advocacy visit to the Hon. Commissioner for Health
2.4 Training of Personnel
Training of personnel covered the use of the following:
i. Electronic data collection device (LINKS system)
ii. Backup forms (for data verification and validation)
iii. Quantum Geographic Information System (QGIS)
iv. Kato-Katz techniques (for stool analysis)
v. Filtration and sedimentation technique (for urinalysis)
5The training was conducted at National, Zonal and State levels. A total of 774 personnel were trained
and participated in the mapping exercise (Table 1). A list of the survey team is in Appendix 2.
Table 1: Categories of Personnel Trained for the Survey
S/N Categories of personnel Number trained
1 Laboratory scientists 100
2 Laboratory technicians 100
3 Recorders 100
4 LGA Coordinators 433
5 In-country consultants 8
6 NGDO and FMOH personnel 33
Total 774
Trainings at the national level were on the use of LINKS mobile system and QGIS. The LINKS mobile
system was developed by the Task Force for Global Health. The system uses a collection of open source
tools for data collection on Android powered devices and cloud based data reporting and
management. During the training session, the system was field tested and feedback given to the
developer which facilitated necessary adjustment on the platform before commencement of project.
The QGIS training was facilitated by a team from the London School of Hygiene and Tropical Medicine
(LSHTM), UK. This provided participants with an overview on the use of epidemiological mapping tools
to assist in the implementation and evaluation of planned NTD control activities in Nigeria. Participants
included FMOH staff, NGDOs, National Bureau of Statistics (NBS) and in-country consultants (Plate 3).
The Training of Trainers (ToT) at zonal level took place in four locations, two in the North (Jigawa and
Bauchi States) and two in the South (Lagos and Ekiti States). The ToT in Jigawa State was followed by
flag off of the survey by the Honourable Minister of Health. At the flag off event, participants included
the State officials: the Honourable Commissioner for Health, Jigawa, trainers of trainers, NGDOs, in-
country consultants and FMOH team.
6Plate 3: Participants and Facilitators for the Quantum GIS training at Abuja
A training was cascaded for the field teams; comprising staff of State Ministries of Health and
Education (including SUBEB) on the mapping methodology and community mobilization. Laboratory
staff were trained on sample collection and examination while the recorders were trained on the use
of electronic data capturing devices (Plates 4).
Plate 4: Laboratory training session.
7Practical sessions and post training tests were also conducted. At the end of each State’s training, field
teams were selected based on post-training performance. Micro planning meetings were held to
discuss schools and community mobilization, survey approach and detailed implementation plans
developed.
In each State, a team was constituted of recorders, scientists, technicians, State NTD programme
officer, SUBEB representative, in-country consultant, FMOH supervisor and NGDO technical officer
(Plate 5). This team was further divided into five sub-teams made up of a recorder, laboratory
technician, scientist, a supervisor, a driver and a local guide.
Plate 5: State survey team
2.5 Field Data Collection Process and Uploading into Cloud Server
The electronic data collection tool has five forms; school and child information forms, urine and stool
results, and error reporting forms (Appendix 3). These forms were downloaded into the android-based
phones used by recorders for data collection in the field and transmission to the cloud server platform
(Plate 6 and Appendix 4). Geographical coordinates of each sampled school and community were
captured within the school premises in the process of collecting the school information. In order to
document the knowledge, attitude and practices of the surveyed population as relates to disease
transmission; Water, Sanitation and Hygiene (WASH) parameters were collected. Some of these are
hand washing practices and availability of toilet facilities in the schools. Toilet facilities were
ascertained and inspected.
8The proximity of water bodies to schools and water contact behavioural activities (Plate 7) were
documented in all the schools visited through interviews with school Heads and the pupils.
Plate 6: A Recorder inputting student’s information to the android phone
Plate 7: Water contact behavioural activities
2.6 Sample Collection and Examination
Midstream urine and stool samples were collected from selected school children using sterile
specimen bottles. Physical appearance of the urine samples collected ranged from clear, amber, pale,
cloudy and bloody. These samples were tested for haematuria using Combi-9® reagent strip and were
examined in the laboratory for schistosome eggs using urine filtration/sedimentation technique
(Lengeler et al., 1993). Stool samples collected from the field were examined for parasite eggs using
the Kato-Katz technique (WHO,1991; 2010), as shown in Plates 8 and 9. Quality control was instituted
9and laboratory results were verified by the consultants and FMOH supervisors to ensure consistency
in samples preparation and examination.
Plate 8: Technicians Preparing Kato-Katz in the laboratory.
Plate 9: Technicians conducting urinalysis in the laboratory.
2.7 Data Analyses
Data cleaning by FMOH and NGDOs data managers/technical officers was carried on completion of
the mapping activities using specified guidelines. State specific linked datasets from the cloud server
were downloaded and cleaned using excel add-in (Ablebit®). This was to validate any observed
discrepancy between uploaded data and entries on back-up forms. Statistical analyses were carried
out using IBM SPSS® version 20 and Epi Info 7.
Descriptive statistics such as percentages were calculated. Frequencies and prevalence of key
indicators were generated and presented in tables, graphs, charts and maps. Chi-square test was used
to investigate associations between categorical variables while Z-test for proportions was to compare
proportions of diseases by gender and age groups. The statistical tests were carried out at 5% level of
significance.
102.8 Ethical Clearance
Ethical clearance was obtained from the National Health Research Ethical Committee (NHREC) of the
FMOH (Appendix 5). Ethical permissions obtained from the SMOH and SUBEB were conveyed to the
schools. Head of schools acknowledged receipt and gave consent for the exercise to be carried out.
113.0 RESULTS
3.1 Demographic data
Schistosomiasis and STHs epidemiological survey was conducted in Nigeria between November, 2013
and May, 2015 in 19 States and the FCT in 433 unmapped LGAs covering 2,160 schools and
communities. Samples were collected from 108,472 pupils comprising 57,670 (53.2%) males and
50,802(46.8%) females. The age range of the sampled pupils were between 5-10 years (57,599) and
11-16 years (50,873) Table 2.
Table 2: Demographic Characteristics of the Study Population
No Surveyed
State LGAs School/ Female Male 5 - 10 Years 11 - 16 Years
(Surveyed/Total) Community
Akwa Ibom 31 /31 155 3,839 4,027 4,646 3,220
Bauchi 20/20 100 2,368 2,590 2,771 2,187
Bayelsa 8/8 40 967 976 1,102 841
Benue** 14/23 70 1,561 1,891 2,181 1,271
Cross River 18/18 87 2,399 2,544 3,247 1,696
Ekiti 16/16 75 1,658 1,865 2,144 1,379
FCT** 4/6 20 505 498 520 483
Jigawa 27/27 135 2,954 3,575 3,015 3,514
Kaduna 23/23 115 2,742 3,119 2,987 2,874
Kano 44/44 220 5,106 5,898 5,408 5,596
Katsina 34/34 170 3,901 4,435 3,531 4,805
Kebbi** 20/21 100 1,505 3,349 2,701 2,153
Kogi 21/21 105 2,541 2,731 2,872 2,400
Lagos** 19/20 95 2,437 2,337 1,712 3,062
Niger 25/25 132 3,143 4,054 4,503 2,694
Osun 30/30 149 3,703 3,876 4,737 2,842
Oyo 33/33 165 3,983 4,127 4,488 3,622
Rivers 23/23 115 2,887 2,833 2,399 3,321
Taraba** 8/16 37 892 955 871 976
Yobe* 15/17 75 1,711 1,990 1,764 1,937
Total 433/456 2,160 50,802 57,670 57,599 50,873
** States where some LGAs were previously mapped
* State where some LGAs were not mapped due to insecurity
3.2 Parasitological Findings
Out of the 108,472 pupils sampled, 10,349 (9.5%) were infected with schistosomes, 29,269 (27.0%)
with STHs and 2,163 (2.0%) were co-infected with schistosomes and STHs. In the 19 States and FCT
surveyed for schistosomiasis, the highest prevalence occurred in Niger State (26.1%), followed by
Kebbi State (21.9%) and FCT (20.3%). Lowest values were recorded in Rivers and Akwa Ibom States
with prevalence of 0.1% and 0.3% respectively. The prevalence of STHs was highest in Akwa Ibom State
(58.4%) followed by Oyo (47.2%) and Osun (45.2%) and lowest in Yobe (1.4%) and Taraba (5.6%) States.
Of the infected, 2,163 (1.99%) co-infected, Niger State had the highest prevalence of 8.96% followed
by FCT 4.19%. Rivers State had the lowest prevalence of 0.03% (Table 3 and figure 3).
12Table 3: Prevalence of Schistosomiasis, Soil Transmitted Helminths and Co-Infection
Schistosomiasis
No of Schistosomiasis STH and STH co-
State persons infection
examined No.(%) No.(%)
95% Cl 95% Cl No.(%) infected
infected infected
Akwa-Ibom 7,866 22 (0.3) (0.18 – 0.43) 4,590 (58.4) (57.25 – 59.44) 12(0.15)
Bauchi 4,958 675 (13.6) (12.67 – 14.6) 496 (10.0) (9.19 – 10.88) 58 (1.17)
Bayelsa 1,943 17 (0.9) (0.52 – 1.42) 639 (32.9) (30.81 – 35.04) 10 (0.51)
Benue 3,452 451 (13.1) (11.96 – 14.24) 872 (25.3) (23.82 – 26.75) 135 (3.91)
Cross River 4,943 283 (5.7) (5.11 – 6.42) 1,209 (24.5) (23.27 – 25.69) 45 (0.91)
Ekiti 3,523 8 (0.2) (0.11 – 0.47) 1,084 (30.8) (29.25 – 32.33) 4 (11)
FCT 1,003 204 (20.3) (17.92 – 22.99) 193 (19.2) (16.87 – 21.85) 42 (4.19)
Jigawa 6,529 743 (11.4) (10.62 – 12.18) 404 (6.2) (05.62 – 06.81) 66 (1.01)
Kaduna 5,861 811 (13.8) (12.97 – 14.76) 1,279 (21.8) (20.77 – 22.90) 122 (2.08)
Kano 11,004 1,531 (13.9) (13.27 – 14.57) 1,923 (17.5) (16.78 – 18.21) 307 (2.79)
Katsina 8,336 944 (11.3) (10.65 – 12.02) 872 (10.5) (9.82 – 11.14) 127 (1.52)
Kebbi 4,854 1,062 (21.9) (20.73 – 23.08) 480 (9.9) (9.07 – 10.77) 85 (1.75)
Kogi 5,272 149 (2.8) (2.41 – 3.32) 1,481 (28.1) (26.88 – 29.33) 51 (0.97)
Lagos 4,774 41 (0.9) (0.63 – 1.18) 1,341 (28.1) (26.82 – 29.39) 12 (0.25)
Niger 7,197 1,879 (26.1) (25.1 – 27.14) 2,531 (35.2) (34.07 – 36.29) 645 (8.96)
Osun 7,579 405 (5.3) (4.88 – 5.88) 3,426 (45.2) (44.08 – 46.33) 203 (2.68)
Oyo 8,110 435 (5.4) (4.88 – 5.88) 3,828 (47.2) (46.11 – 48.29) 216 (2.66)
Rivers 5,720 7 (0.1) (0.05 – 0.26) 2,467 (43.1) (41.84 – 44.43) 2 (0.03)
Taraba 1,847 103 (5.6) (4.6 – 6.75) 103 (5.6) (4.60 – 6.75) 12 (0.65)
Yobe 3,701 579 (15.6) (14.49 – 16.86) 51 (1.4) (1.04 – 1.82) 9 (0.24)
Total 108,472 10,349 (9.5) (9.37 – 9.72) 29,269 (27.0) (26.72 – 27.25) 2,163 (1.99)
13Figure 3: Schistosomiasis and STHs endemic areas
In the LGAs of each State, it was also found that the range of prevalence of each disease varied (Table
4). With respect to schistosomiasis, LGAs prevalence in four States were in the low risk range, LGAs in
13 States ranged from low to moderate risk while in two States; Niger and Kebbi, the prevalence
ranged from low to high as stated in WHO treatment guidelines for schistosomiasis and STHs
(Appendix 6). STHs disease prevalence range in the LGAs of the 19 States and FCT surveyed showed
wider variation. LGAs in four States were in the clinical case management. In seven States, the LGA
prevalence rate ranged from clinical to low risk levels. Only Benue State had all its LGAs at low risk
range. Five States had clinical to high risk prevalence levels in the LGAs while two States; Akwa Ibom
and Osun had prevalence levels ranging between low and high. Figures 4 and 5 show the prevalence
of schistosomiasis and STHs respectively.
14Table 4: Range of Schistosomiasis and STHs Prevalence by State
Prevalence Range (%)
State No of LGAs Surveyed Schistosomiasis STHs
Akwa Ibom 31 0.0 - 1.2 25.1 -91.4
Bauchi 20 0.0 - 33.9 1.6 - 19.3
Bayelsa 8 0.0 -3.4 14.9 - 59.2
Benue 14 1.4 - 24.8 20.2 - 36.8
Cross River 18 0 - 32.8 12.5 - 50.2
Ekiti 16 0.0 - 2.5 15.8 - 48.9
FCT 4 7.5 - 27.9 16.1 - 25.5
Jigawa 27 0.5 -31.7 0 - 15.4
Kaduna 23 1.5 - 44.2 4.2 - 40.0
Kano 44 1.2 39.0 5.6 - 34.0
Katsina 34 0 - 28.9 0.8 - 40.6
Kebbi 20 0.8 - 68.3 3.8 - 22.0
Kogi 21 0 - 21.4 16.2 - 39.0
Lagos 19 0 - 3.2 0 - 44.8
Niger 25 2.8 - 51.6 13.7 - 64.7
Osun 30 0 - 16.2 24 - 71.1
Oyo 33 0 - 19.6 16.7 - 67.7
Rivers 23 0 - 0.8 17.6 - 85.9
Taraba 8 1.0 - 11.1 1.6 - 12.9
Yobe 15 1.2 - 39.6 0 - 3.3
Figure 4: Prevalence of Schistosomiasis by LGA
15Figure 5: Prevalence of STHs by LGA
3.1.1 Schistosomiasis Result
Schistosoma haematobium (82%) was the predominant species in the survey compared to
Schistosoma mansoni (18%) as shown in Figure 6. Of the total pupils examined, 8.1% were positive for
S. haematobium with highest prevalence occurring in Kebbi (21.7%) followed by Niger (19.6%) and
Yobe (15.6%) States. For S. mansoni, 1.8% pupils were positive, FCT and Niger States ranked highest
with prevalence of 10.5% and 9.4% respectively while Yobe State had no S. mansoni. Akwa Ibom,
Lagos, Katsina and Rivers States had 0.1% prevalence each (Figures 6, 7 and 8).
Total
S. mansoni
18%
S. haematobium
82%
Figure 6: Proportion of S. haematobium and S. mansoni in the study area
16Figure 7: Prevalence of S. haematobium and S.mansoni by State
17Figure 8: Schistosomiasis Point Prevalence maps
183.1.2 Soil Transmitted Helminths (STHs) Results
All three STHs species Ascaris lumbricoides, Hookworm and Trichuris trichiura were observed in the
present survey. The most prevalent species was hookworm (47%), A. lumbricoides (42%) and T.
trichiura (11%). All the 19 States and FCT surveyed showed presence of A. lumbricoides and Hookworm
infections. Only Yobe State had no prevalence of T. trichiura. Osun State followed by Oyo and Akwa
Ibom States had the highest prevalence of A. lumbricoides with 40.9%, 35.9% and 31.9% respectively.
Hookworm infection was highest in Akwa Ibom State with 40.3% followed by Niger State with 32.6%
and the lowest in Yobe State with 0.7%. Rivers State recorded highest prevalence in Trichuris infection
with 19.1% and followed closely by neighbouring Bayelsa State with 15.5% (Figure 9, 10 and 11). Of
the 4.0% that had multiple STHs infection, Akwa Ibom State had highest prevalence of 20.8%. The
lowest prevalence of 0.04% was recorded in Kebbi State.
Figure 9: Proportion of the three species of STHs in the Study Area
19Figure 10: Prevalence of A. lumbricoides, Hookworm and T. trichiura
20Figure 11: STHs Point Prevalence maps
213.1.3 Prevalence of schistosomiasis and STH by Sex Of the total pupils infected with schistosomiasis, 65% were males and 35% females. Niger State had highest prevalence of infection both in males (29.4%) and females (21.9%). Rivers State had the least infection in both sexes (Figure 12 and 13). There is a statistical significant association with schistosomiasis infection by sex (χ2 = 957.37, P
For STHs, of the total infected pupils, 53% were males and 47% females. Akwa Ibom State had highest
prevalence in both males (59.8%) and females (56.8%) while Yobe State had the least prevalence for
both sexes 1.2% for males and 1.6% females (Figures 14 & 15). There is a statistically significant
association between sex and STHs infection (χ2 = 101.49, P
3.1.4 Prevalence of schistosomiasis and STH by Age group
Schistosomiasis was found to be more prevalent among the 11-16 years age group (55%) as compared
to the 5-10 years age group (45%) as shown in figure 16. In both age groups examined, Niger State had
the highest prevalence of schistosomiasis with 24.1% and 29.4% for 5-10 and 11-16 years respectively.
The lowest prevalence of 0.04% and 0.2% were recorded in Rivers State for both age groups
respectively (Figure 17). Statistically, it was also observed that there was significant difference
between prevalence of disease of the age groups (χ2 = 139.48, P
35.00%

       30.00%

       25.00%

       20.00%

                                                                                      5 - 10 Years
       15.00%                                                                         11 - 16 Years

       10.00%

        5.00%

         .00%

      Figure 17: Prevalence of schistosomiasis by age group

STHs were found to be more prevalent among the 5-10 years age group (51%) as compared to the 11-
16 years age group (49%). Akwa Ibom had the highest prevalence for both age groups; 56.2% for 5-10
years and 61.5% for 11-16 years. The lowest prevalence was found in Yobe State with 1.4% and 1.3%
for both age groups respectively (Figures 18 and 19). There was statistically significant difference
between the age groups (χ2 = 11.12, P
70.0%
60.0%
50.0%
40.0%
30.0% 5 - 10 Years
20.0% 11 - 16 Years
10.0%
0.0%
Ekiti
Osun
Niger
Rivers
FCT
Kaduna
Cross Riv
Katsina
Oyo
Akwa-Ibom
Bauchi
Lagos
Kebbi
Kano
Bayelsa
Total
Kogi
Yobe
Benue
Taraba
Figure 19: Prevalence of STHs infected pupils by age group
3.1.5 Intensity of Infection
The intensity levels (expressed as numbers of eggs per ml of urine or gram of faeces) of the various
species of parasites recorded in this mapping survey are shown in table 5. The result shows that there
were generally more cases of light and moderate intensities of infection. Heavy intensity levels were
nearly equal for S. haematobium (24.31%) and S. mansoni (23.48%). However, heavy intensity of S.
haematobium was higher in males (25.02%) than females (22.64%). Conversely, females (25.41%)
recorded cases of heavy intensity of S. mansoni than males (22.01%). The intensity levels of S.
haematobium showed statistical significant difference (PTable 5: Parasite intensity in eggs per gram (epg) of faeces or per 10 ml of urine
Parasite species Level of intensity Number (%) of intensity of infection
Male Female Total
S. haematobium Light Infection (400 epg) 247 (22.01) 215 (25.41) 462 (23.48)
A. lumbricoides Light Infection (1-4,999 epg) 5,721 (76.28) 5,061 (74.42) 10,782(75.39)
Moderate Infection (5,000-49,999 1,681 (22.41) 1,638 (24.08) 3,319 (23.21)
epg)
Heavy Infection (>50,000 epg) 98 (1.31) 102 (1.50) 200 (1.40)
Hookworm Light Infection (1-1,999 epg) 8,883 (92.70) 6,143 (92.03) 15,026 (92.42)
Moderate Infection (2,000-3,999 443 (4.62) 311 (4.66) 754 (4.64)
epg)
Heavy Infection (>4,000 epg) 257 (2.68) 221 (3.31) 478 (2.94)
T. trichiura Light Infection (1-999 epg) 1,684 (88.45) 1,484 (86.43) 3,168 (87.49)
Moderate Infection (1,000-9,999 212 (11.13) 223 (12.99) 435 (12.01)
epg)
Heavy Infection (>10,000 epg) 8 (0.42) 10 (0.58) 18 (0.50)
3.2 Implication of Findings on Intervention
Results of the survey showed that of 433 LGAs mapped, 359 (83%) required interventions for
schistosomiasis (Appendix 7). Furthermore, in eight States and FCT, all the LGAs mapped (180) require
treatment. Rivers State has the least number of LGAs (26%) requiring treatment. A total of 202 LGAs
fall within the low risk category, 153 moderate and four LGAs were high risk category. The four LGAs
in the high risk category are found in Niger (2) and Kebbi (2) States (Table 6 and Figure 20).
27Table 6: LGAs requiring Intervention for Schistosomiasis
No of LGAs Number of LGAs requiring Intervention
State mapped Low Risk Moderate High Risk Total number
(Figure 20: Intervention planning map for Schistosomiasis in 19 States and FCT.
A total of 237(55%) LGAs require some form of intervention for STHs as shown in Table 7 and Figure
21. All the LGAs mapped in Akwa Ibom, Benue and Osun States (75 LGAs) qualify for intervention.
However, no LGA was found to qualify for intervention in Bauchi, Jigawa, Taraba and Yobe States.
Case-based management is required in 191 LGAs of the surveyed States, 177 LGAs fall within the low
risk and 60 LGAs in the high risk categories (Appendix 7).
29Table 7: LGAs requiring Intervention for Soil Transmitted Helminths (STHs)
No of LGAs Number of LGAs requiring Intervention
State mapped Case-based Low Risk (20 High Risk Total No.
Mgt (Figure 21: Intervention planning map for STHs in 19 States and the FCT
3.3 Defeacation practices and water contact activities
Table 8 shows prevalence of schistosomiasis and STHs in relation to place of defeacation by pupils
surveyed. The highest prevalence for schistosomiasis and STHs was among respondents who
defecated around the school compound (11.1% and 31.0% respectively). The second highest
prevalence occurred among those who defecate outside school environment (10.7% for
schistosomiasis and 26.5% for STHs). The State level prevalence is as shown on Appendix 8.
Table 8: Prevalence of schistosomiasis and STHs in relation to places of defeacation.
Defeacation Practices No of Schistosomiasis STHs
Persons No (%) Infected No (%) Infected
Examined
In the School Toilet 45,726 3,501 (7.66) 11,314 (24.74)
Around school 29,847 3,319 (11.12) 9,250 (30.99)
Compound
Outside School 32,899 3,529 (10.73) 8,705 (26.46)
Environment
Total 108,472 10,349 (9.54) 29,269 (26.98)
Table 9 and Appendix 9 showed that all respondents had some form of contact with water. The
activities include bathing, fishing, washing, swimming, playing, fetching water, crossing water and
others. The prevalence of schistosomiasis was highest among those who perform swimming activity
31(17.0%) followed by those who play in water (11.3%). For STHs the highest prevalence was among
those who bath (34.3%) and those who fish (33.9%).
Table 9: Prevalence of Schistosomiasis in relation to water contact activities
Water Contact No of Schistosomiasis STHs
Activities Respondents No (%) of Persons No (%) of Persons
Infected Infected
Bathing 13,835 1,351(9.8) 4,739 (34.3)
Washing 20,689 2,106 (10.2) 6,160 (29.8)
Fishing 3,535 349 (9.9) 1,199 (33.9)
Crossing Water 3,253 279 (8.6) 917 (28.2)
Fetching Water 14,804 1,124 (7.6) 4,481 (30.3)
Playing 14,364 1,624 (11.3) 3,223 (22.4)
Swimming 6,590 1,119 (17.0) 1,970 (29.9)
Others 31,402 2,397 (7.6) 6,580 (21.0)
Total 108,472 10,349 (9.5) 29,269 (27.0)
324.0 DISCUSSIONS
4.1 Discussion of Results
The results of the Schistosomiasis and STHs epidemiological mapping in the 19 States and FCT provided
insight to the disease distribution and intensity by age group and sex for pupils in the surveyed area.
There are 456 LGAs in the 19 States but 21 LGAs (in Benue, FCT, Lagos, Kebbi and Taraba) had
previously been mapped by government and partners. The intention of this survey was to complete
the mapping in the remaining 435 LGAs; however, two LGAs in Yobe State could not be mapped due
to insecurity.
The findings on schistosomiasis revealed that the overall prevalence was within the low risk range
(9.5%), although data captured by LGA showed high levels of prevalence in some LGAs within some
States. High salinity waters may not support the viability of freshwater snail hosts of schistosomes and
may account for the low prevalence observed in Rivers, Akwa Ibom, Bayelsa and Lagos States that
border the Atlantic and have brackish water bodies. The finding of this present survey agrees with
other studies by Osama, 2009; Leveque et al, 1978; Kefford and Nugegoda (2005). However, in Cross
River also a coastal State, five LGAs had moderate risk. These LGAs are situated in the northern part
of the State bordering Benue State where the infection was also moderate. The low prevalence in Ekiti
State could be explained by the deworming programme for schistosomiasis which was launched in
2010 although treatment has not been consistent over the years.
Regarding STHs, the overall prevalence rate was low, but LGA rates in some State were greater than
50% which is WHO classification for high risk (WHO, 2011). Most of the LGAs with high risk were found
in States in the southern part of the country except Niger State in the North Central zone. The survey
showed higher prevalence of STHs than schistosomiasis which was in contrast to findings in similar
studies in Zimbabwe where schistosomiasis was 22.7% and STHs 5.5% (Midzi et al., 2014)
Prevalence of infection shows the parasites burden in the population while intensity estimates the
worm burden per host. The ability of a parasite to elicit disease symptoms depends on its intensity in
the host and a combination of other factors such as the physiological state of the host and the
presence of other parasites. Although cases of heavy intensity were few in this survey, those of
moderate and light infections were quite high and could graduate into heavy intensity if they remain
untreated. Studies have demonstrated a relationship between the initial worm burden and growth
after treatment (Mohammed et al., 2002). Children with higher worm burden were observed to gain
less weight than those with lower worm burden.
Co-infection of schistosomiasis and STHs was observed in all the States sampled except in Rivers State.
The range of the prevalence of schistosomiasis and STHs in the LGAs of the States was in agreement
with the findings from other studies that schistosomiasis is a focal disease even in one State where its
33You can also read