Restaurant Brands NZ Limited - 1H 20 Results Presentation - AWS

Page created by Mike Schwartz
 
CONTINUE READING
Restaurant Brands NZ Limited - 1H 20 Results Presentation - AWS
Restaurant Brands NZ Limited
   1H 20 Results Presentation

                   Russel Creedy - Group CEO
                   Grant Ellis – Group CFO
                   16 October 2020
Restaurant Brands NZ Limited - 1H 20 Results Presentation - AWS
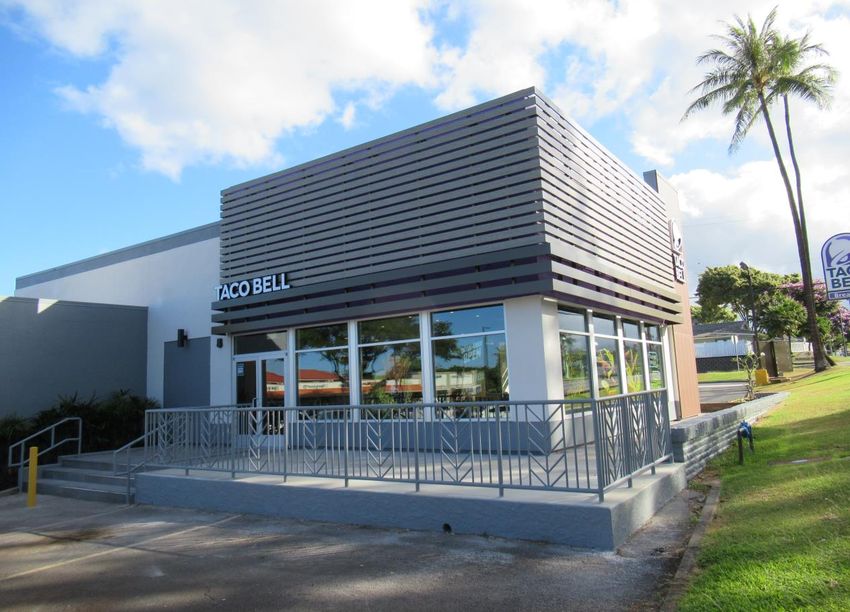
Presentation Outline

               • Highlights

               • Results Overview

               • New Zealand Operations

               • Australia Operations

               • Hawaii Operations

               • Growth Opportunities

               • Outlook
Highlights

   • Group sales $442.6 million up $11.6 million (+2.7%)

   • NPAT $20.0 million down $0.4 million (-2.0%)

   • NPAT (excluding non-trading items and effect of NZ IFRS 16) up $3.2 million (+14.4%)

   • Brand EBITDA (excluding G&A) up $3.4 million (+5.0%)
Results overview – NPAT (1)
Reported NPAT down 2.0% on prior year to $20.0m with
significant impact from NZ IFRS 16

               $NZm                    20.4
                                                        20.0
                          19.1

                          1H 18        1H 19           1H 20

                EPS       15.5c        16.5c            16.0c
NZ IFRS 16
Impact of NZ IFRS 16 on reported profit has been substantial

              $NZm                                        1H 20

              Lease costs (previously expensed)            20.2
              Depreciation - right of use assets          (14.0)
              Finance cost - right of use assets          (10.1)
              NZ IFRS 16 impact pre-tax                    (3.9)
              Income tax                                    1.0
              NPAT impact of NZ IFRS 16                    (2.9)
Non-trading items
Non-trading items similar to prior year overall

     $NZm                                   1H 19     1H 20

     Lease modification                           -   (0.2)
     Gain on sale Pizza Hut stores           (1.6)    0.1
     Leave remediation                       2.0      0.3
     Store closure costs                     0.2      0.4
     Relocations                             0.4      0.6
     Franchise rights amortisation           1.1      1.1

                                              2.1      2.3
     Less tax                                (0.7)    (0.2)
                                             1.4      2.1
Results overview – NPAT (2)
NPAT on a comparative basis up 14.4% on 1H 19

           $NZm                                                               25.0

                                                                +14.4%        2.9
                                                        21.9
                                 20.4     +7.4%         1.4                   2.1

                                  1.3                   20.4
                                                                              20.0
                                 19.1

                                  1H 18               1H 19                  1H 20

                                 Reported NPAT         Non Trading        NZ IFRS 16
            Note: 1H 19 trading included a further $1.1m NPAT from Starbucks Coffee business

             EPS                 16.6c                 17.6c                 20.0c
Results overview by division
Sales and margins grew across all three divisions with strong
sales growth in Hawaii

                                                        EBITDA
        Sales                                                                           72.6
                                                         $NZm             69.2
        $NZm
                           431.0         442.6
                                                             63.4                       14.1
            386.1                                                         12.8
                           97.4          106.9               12.7
                                                                                        15.5
            88.9                                                          15.2
                           103.4         104.8               10.6
            71.9                                                                        43.0
                                                             40.1         41.2
            225.4          230.2         230.8

           1H 18           1H 19         1H 20              1H 18         1H 19        1H 20 *

             New Zealand     Australia   Hawaii             New Zealand    Australia   Hawaii

* Excludes impact of NZ IFRS 16
Cash flows remain strong
Operating cash flow growth utilised in accelerated capex programme

        $NZm                                1H 18             1H 19    1H 20

        Operating cash flow                 37.6              47.3     53.6     **

        Investing cash flow (adjusted)      (10.1)    *       (13.9)   (27.7)

        Free cash flow                      27.5              33.4     25.9

        *Adjusted for PIR purchase

        **Adjusted as follows:           Reported under NZ IFRS 16      63.7
                                         Less lease expense            (20.2)
                                         Add back lease interest        10.1
                                                                        53.6
Net borrowings
Continued growth in free cash flow, together with dividend hold reduces net borrowings

        Net debt $NZm
                                                  159.6
                                                                  151.1
                                                   12.0
                              133.1               147.6
                               8.7                                 41.3
                              124.4
                                                                  109.8

                             1H 18               1H 19           1H 20
                                      Net Debt            Cash

         Ratios

          Net Debt: EBITDA   1.4:1               1.5:1           1.1:1
          Gearing (D:D+E)    39.2%               40.5%           35.0%
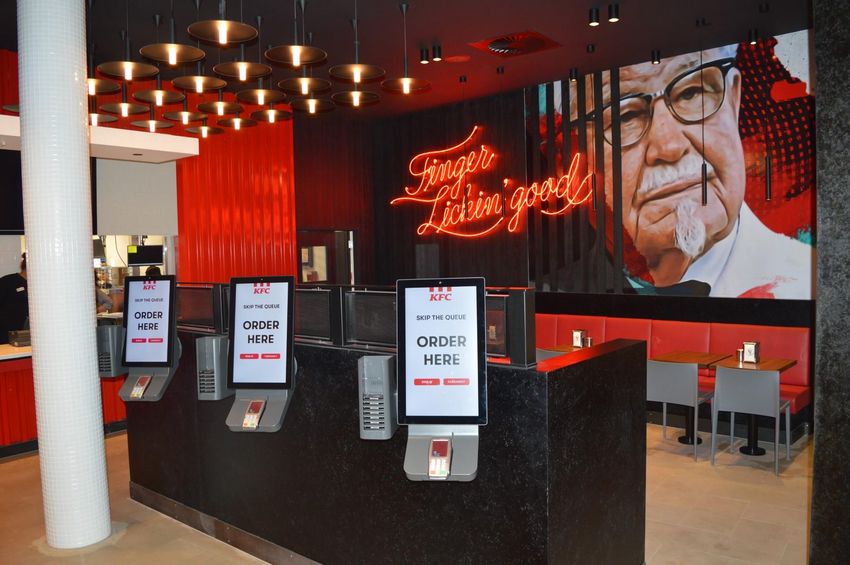
                             1H 18               1H 19           1H 20
New Zealand operations

 • Standout sales and margin performance by KFC

 • Pizza Hut weak sales and margins reduced

 • Carl’s Jr. significant sales improvement with delivery service introduced

 • Taco Bell infrastructure established, staff trained. First store opening in November 2019
   (Lynnmall)

 • Three KFC stores opened in 1H 20, bringing RBD KFC stores to 99

 • Pizza Hut store sales to independent franchisees continues (mix of new builds and
   existing stores)
Newmarket KFC
Newly opened KFC featuring the new food-court design
New Zealand division sales
Another record performance by KFC and good recovery by Carl’s Jr. offset by softer Pizza Hut result

                                                                10.6%
                          KFC Sales
                                                                 22.9                    20.5                  18.3
      7.0%
                                                                                                                               Pizza Hut Sales
                                                     5.7%

                               3.8%                                                       -4.9%                 -4.4%
                                                     193.5      1H 18                    1H 19                1H 20
                                                                       Total Sales $m             Same Store Sales %
                               179.3
      170.3

      1H 18                    1H 19                 1H 20
                                                                                                                        9.8%
              Total Sales $m           Same Store Sales %
                                                                18.8                      17.5                    19.0
                                                                                                                                Carl's Jr. Sales
                                                                                                -2.0%
                                                                -2.3%
                                                                1H 18                    1H 19                  1H 20
                                                                        Total Sales $m             Same Store Sales %
New Zealand division EBITDA
Sales leverage and good cost control assisted earnings with KFC reaching a new record
                                                             9.0%

                    KFC EBITDA                                                    7.1%

                                                                                                                     Pizza Hut EBITDA
                                                              2.1
                                                                                   1.5                        2.7%
                                              21.6%
                         20.7%
     20.7%                                                                                                     0.5

                                                             1H 18                1H 19                   1H 20
                                                41.8                 EBITDA $m              EBITDA % of Sales
                          37.0
     35.3
                                                                                                        4.4%
                                                                                 4.0%

                                                              2.9%
     1H 18               1H 19                  1H 20

             EBITDA $m           EBITDA % of Sales                                                      0.8
                                                                                  0.7                                 Carl’s Jr. EBITDA

                                                              0.5

                                                             1H 18               1H 19                1H 20

                                                                     EBITDA $m            EBITDA % of Sales
Australia operations

 • Solid same store sales growth and profit performance in KFC

 • No new KFC store openings in 1H, however two planned for 2H

 • Taco Bell infrastructure established, staff trained. Two new stores opening pre-Christmas
   in Jesmond and Blacktown
Australia division
A sound result from KFC as business continues to consolidate on recent acquisitions

                         KFC Australia Sales                            KFC Australia EBITDA

      5.8%                                           5.9%

                                4.5%
                                                             14.7%                 14.7%                14.9%

                                                     99.5                                                14.8
                                 95.5                                              14.0
      66.7                                                    9.8

      1H 18                     1H 19               1H 20     1H 18                1H 19                1H 20
              Total Sales $Am           Same Store Sales %            EBITDA $Am           EBITDA % of Sales
Hawaii operations

• Very strong sales performance by Taco Bell on good promotions and innovative product
  releases

• Pizza Hut showing improved performance with local promotional activity (Big New Yorker)

• Both brands are seeing some margin pressure (wage rates and imported ingredients)

• Moanalua Taco Bell reopened after transformation with +29% sales growth since
  reopening.

• Two more Taco Bell transformations scheduled by year end
Moanalua Taco Bell
Latest Taco Bell transformation
Hawaii division
Double-digit same store sales growth for Taco Bell with some very strong promotions.
Pizza Hut sales and margins stabilised with local promotions and resolution of systems issues
                                                         13.7%
                                                                       Taco Bell EBITDA                 20.1%                  19.8%
        Taco Bell Sales
                                                                           19.7%

                                                         42.4                                                                    8.4
                                                                                                        7.8
                                     38.6                                      7.2
               36.6
                                     3.2%

               1H 18                 1H 19               1H 20                1H 18                     1H 19                   1H 20
                                                                                      EBITDA $USm                EBITDA % of Sales
                  Total Sales $USm           Same Store Sales %

        Pizza Hut Sales                                                Pizza Hut EBITDA
                                                                             7.1%

               27.3                  28.4                 28.5
                                                                                                              3.5%               3.5%
                                                                2.9%                1.9

                                                                                                          1.0                     1.0
                                     -2.0%
              1H 18                  1H 19              1H 20                  1H 18                     1H 19                  1H 20

                  Total Sales $USm           Same Store Sales %                           EBITDA $USm                EBITDA % of Sales
Growth opportunities progress to date (FY20)

           New Zealand                        Australia                           Hawaii                         US

    PLAN   • Network and channel            • Network and channel expansion • Potential acquisition              • Potential acquisition (beachhead)
             expansion (4-5 new stores)       (2 new stores)                • New store builds                     Actively looking (West Coast, US)
                                            • Small franchisee acquisitions
                                            • Large acquisition

    1H     • Delivery rolled out to a total • Delivery rolled out to 30 stores   • No further progress on        • Focus sharpening on potential
             of 32 stores in network          in network                           acquisition (now 15 stores)     targets
           • 3 new stores opened with 2 • No new stores 1H with 2 new            • Sites identified for new
             new stores in 2H                 stores in 2H                         builds
                                            • Discussions continuing with
                                              small franchisees

    PLAN   • Store builds (network)                                              • Relocations
           • 8 builds for re-sale                                                • New store builds (1-2 new
                                                                                   delcos)
    1H     • 3 built and 2 on-sold

    PLAN   • Market secured                 • NSW / ACT market secured           • New store builds              • Potential acquisition (beachhead)
             2 new stores                     2 new stores                       • Transformations
                                                                                   (2-3 transformations)
    1H
           • Development agreement          • Development agreement signed • No new store builds         • No further progress to date
             signed                         • 2 stores to open in 2H       • One transformation complete
           • 2 stores to open in 2H                                          (1H) – Moanalua
                                                                           • 2 scheduled for 2H
Outlook

 • The Group expects to deliver a NPAT (excluding effect of NZ IFRS 16) for FY20 of at
   least 10% in excess of FY19
Questions

DISCLAIMER
The information in this presentation:
       Is provided by Restaurant Brands New Zealand Limited (“RBD”) for general information purposes and does not constitute investment advice or an offer of or invitation to purchase RBD securities.
       Includes forward-looking statements. These statements are not guarantees or predictions of future performance. They involve known and unknown risks, uncertainties and other factors, many of which
        are beyond RBD’s control, and which may cause actual results to differ materially from those contained in this presentation.
       Includes statements relating to past performance which should not be regarded as reliable indicators of future performance.
       Is current at the date of this presentation, unless otherwise stated. Except as required by law or the NZX Main Board and ASX listing rules, RBD is not under any obligation to update this presentation,
        whether as a result of new information, future events or otherwise.
       Should be read in conjunction with RBD’s consolidated financial statements for the 28 weeks to 9 September 2019, the audited consolidated financial statements for the full year ended 25 February
        2019 and the NZX and ASX market releases relating to these financial statements.
       Includes non-GAAP financial measures including "EBITDA”. These measures do not have a standardised meaning prescribed by GAAP and therefore may not be comparable to similar financial
        information presented by other entities, and should not be used in substitution for, or isolation of, RBD’s audited consolidated financial statements.
       Has been prepared with due care and attention. However, RBD and its directors and employees accept no liability for any errors or omissions.
       Contains information from third parties RBD believes reliable. However, no representations or warranties are made as to the accuracy or completeness of such information.
You can also read